

Decreased expression of ABAT and STC2 hallmarks ER-positive inflammatory breast cancer and endocrine therapy resistance in advanced disease
- PMID: 25771305
- PMCID: PMC5528763
- DOI: 10.1016/j.molonc.2015.02.006
Decreased expression of ABAT and STC2 hallmarks ER-positive inflammatory breast cancer and endocrine therapy resistance in advanced disease
Abstract
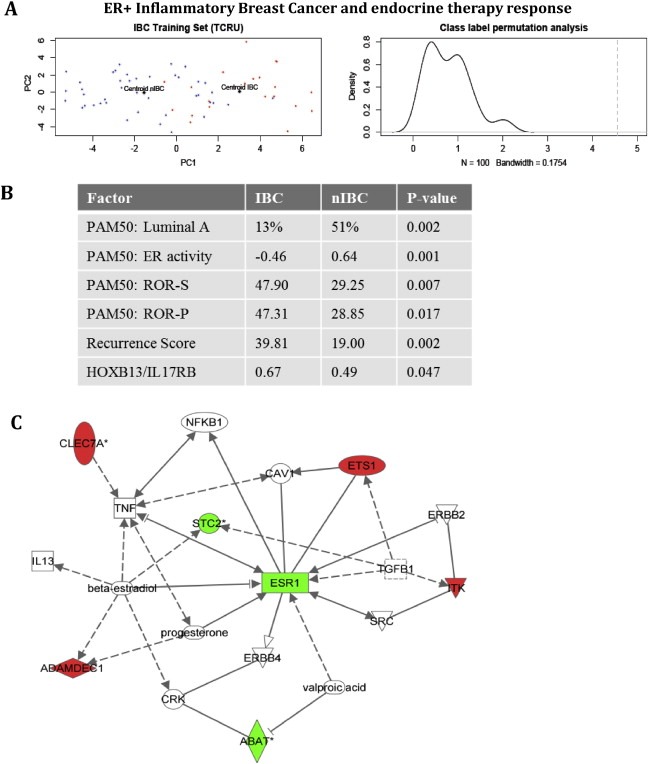
Background: Patients with Estrogen Receptor α-positive (ER+) Inflammatory Breast Cancer (IBC) are less responsive to endocrine therapy compared with ER+ non-IBC (nIBC) patients. The study of ER+ IBC samples might reveal biomarkers for endocrine resistant breast cancer.
Materials & methods: Gene expression profiles of ER+ samples from 201 patients were explored for genes that discriminated between IBC and nIBC. Classifier genes were applied onto clinically annotated expression data from 947 patients with ER+ breast cancer and validated with RT-qPCR for 231 patients treated with first-line tamoxifen. Relationships with metastasis-free survival (MFS) and progression-free survival (PFS) following adjuvant and first-line endocrine treatment, respectively, were investigated using Cox regression analysis.
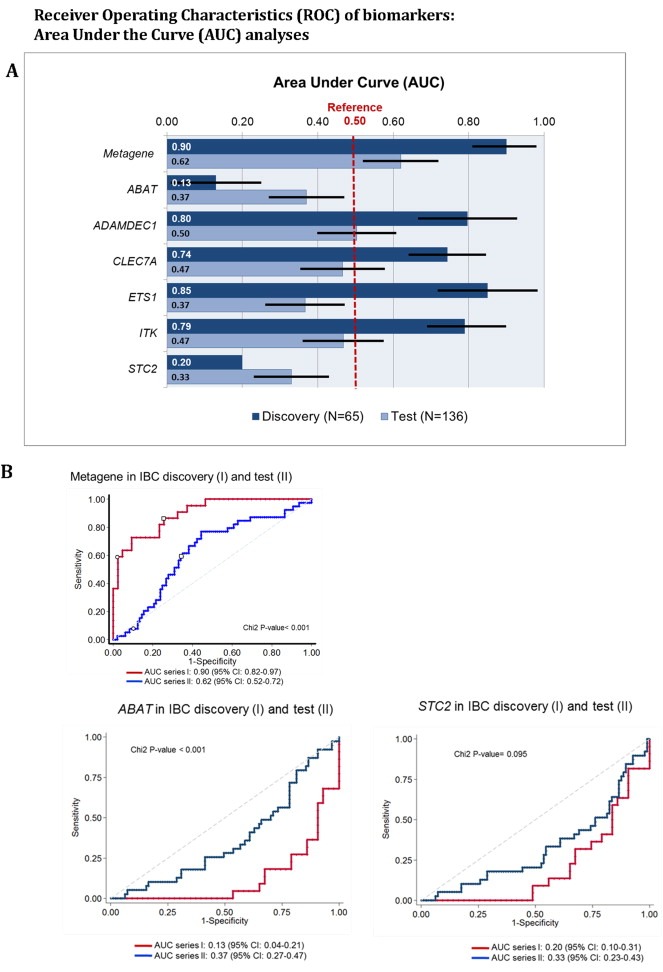
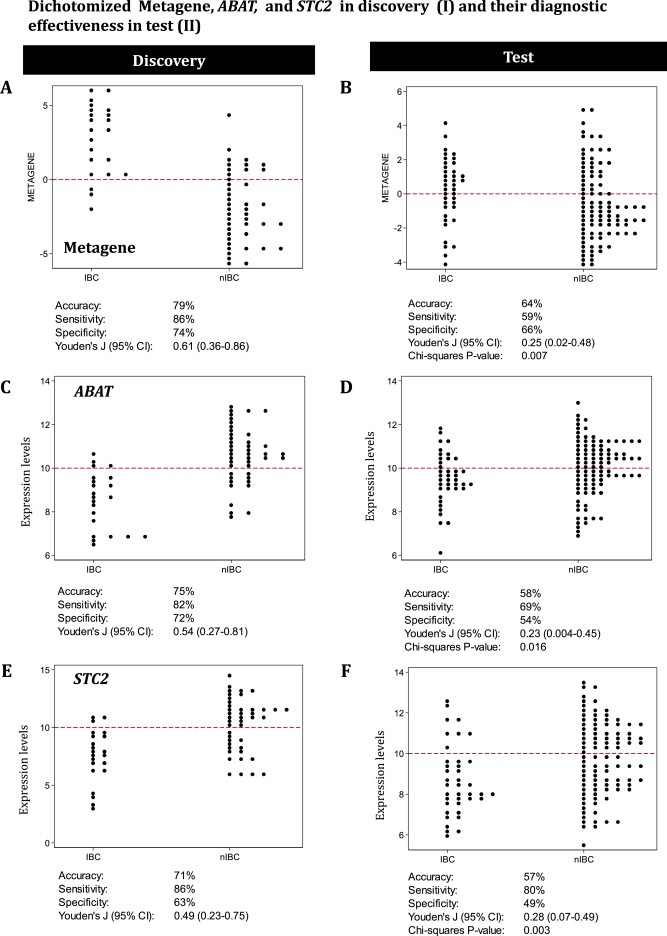
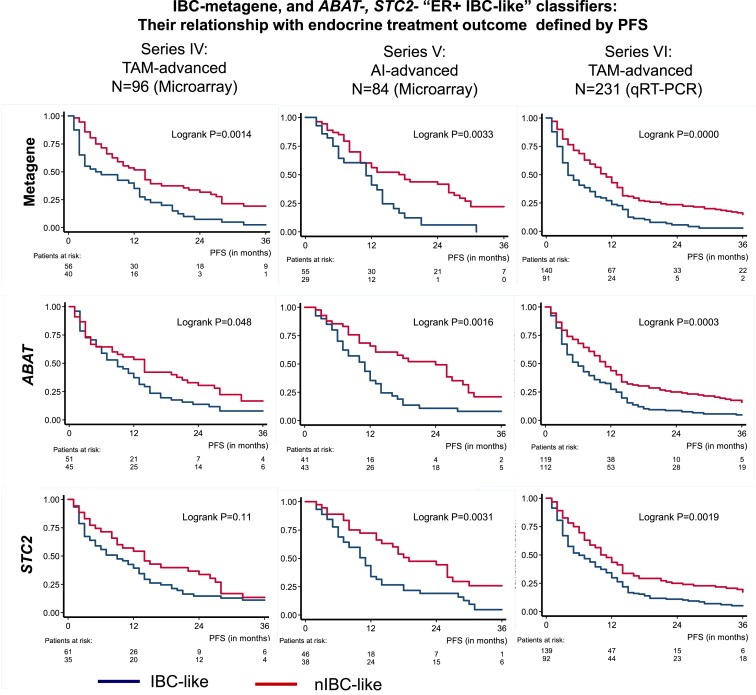
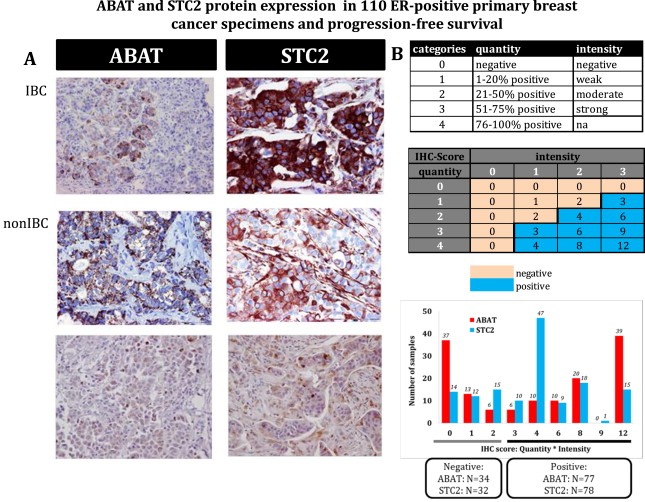
Results: A metagene of six genes including the genes encoding for 4-aminobutyrate aminotransferase (ABAT) and Stanniocalcin-2 (STC2) were identified to distinguish 22 ER+ IBC from 43 ER+ nIBC patients and remained discriminatory in an independent series of 136 patients. The metagene and two genes were not prognostic in 517 (neo)adjuvant untreated lymph node-negative ER+ nIBC breast cancer patients. Only ABAT was related to outcome in 250 patients treated with adjuvant tamoxifen. Three independent series of in total 411 patients with advanced disease showed increased metagene scores and decreased expression of ABAT and STC2 to be correlated with poor first-line endocrine therapy outcome. The biomarkers remained predictive for first-line tamoxifen treatment outcome in multivariate analysis including traditional factors or published signatures. In an exploratory analysis, ABAT and STC2 protein expression levels had no relation with PFS after first-line tamoxifen.
Conclusions: This study utilized ER+ IBC to identify a metagene including ABAT and STC2 as predictive biomarkers for endocrine therapy resistance.
Keywords: ABAT; Endocrine therapy resistance; Inflammatory breast cancer; Metastatic disease; STC2.
Copyright © 2015 Federation of European Biochemical Societies. Published by Elsevier B.V. All rights reserved.
Figures
References
-
- Bekhouche, I. , Finetti, P. , Adelaide, J. , Ferrari, A. , Tarpin, C. , Charafe-Jauffret, E. , Charpin, C. , Houvenaeghel, G. , Jacquemier, J. , Bidaut, G. , Birnbaum, D. , Viens, P. , Chaffanet, M. , Bertucci, F. , 2011. High-resolution comparative genomic hybridization of inflammatory breast cancer and identification of candidate genes. PLoS One 6, e16950 - PMC - PubMed
-
- Bertucci, F. , Finetti, P. , Rougemont, J. , Charafe-Jauffret, E. , Nasser, V. , Loriod, B. , Camerlo, J. , Tagett, R. , Tarpin, C. , Houvenaeghel, G. , Nguyen, C. , Maraninchi, D. , Jacquemier, J. , Houlgatte, R. , Birnbaum, D. , Viens, P. , 2004. Gene expression profiling for molecular characterization of inflammatory breast cancer and prediction of response to chemotherapy. Cancer Res. 64, 8558–8565. - PubMed
-
- Bouras, T. , Southey, M.C. , Chang, A.C. , Reddel, R.R. , Willhite, D. , Glynne, R. , Henderson, M.A. , Armes, J.E. , Venter, D.J. , 2002. Stanniocalcin 2 is an estrogen-responsive gene coexpressed with the estrogen receptor in human breast cancer. Cancer Res. 62, 1289–1295. - PubMed
-
- Budczies, J. , Brockmoller, S.F. , Muller, B.M. , Barupal, D.K. , Richter-Ehrenstein, C. , Kleine-Tebbe, A. , Griffin, J.L. , Oresic, M. , Dietel, M. , Denkert, C. , Fiehn, O. , 2013. Comparative metabolomics of estrogen receptor positive and estrogen receptor negative breast cancer: alterations in glutamine and beta-alanine metabolism. J. Proteomics 94, 279–288. - PubMed
-
- Dawood, S. , Merajver, S.D. , Viens, P. , Vermeulen, P.B. , Swain, S.M. , Buchholz, T.A. , Dirix, L.Y. , Levine, P.H. , Lucci, A. , Krishnamurthy, S. , Robertson, F.M. , Woodward, W.A. , Yang, W.T. , Ueno, N.T. , Cristofanilli, M. , 2011. International expert panel on inflammatory breast cancer: consensus statement for standardized diagnosis and treatment. Ann. Oncol. 22, 515–523. - PMC - PubMed
Publication types
MeSH terms
Substances
LinkOut - more resources
Full Text Sources
Other Literature Sources
Medical
Miscellaneous
