

Modeling an irritant gas plume for epidemiologic study
- PMID: 25772143
- PMCID: PMC4573378
- DOI: 10.1080/09603123.2015.1020414
Modeling an irritant gas plume for epidemiologic study
Abstract
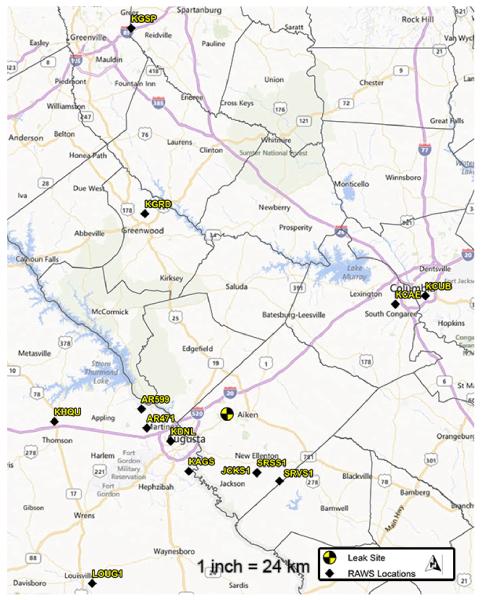
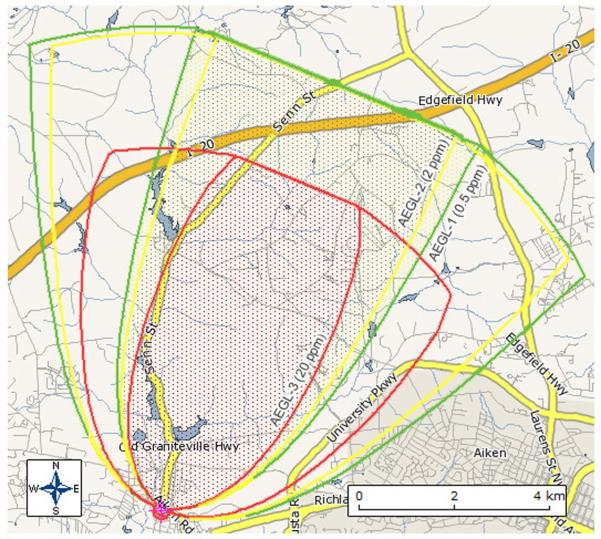
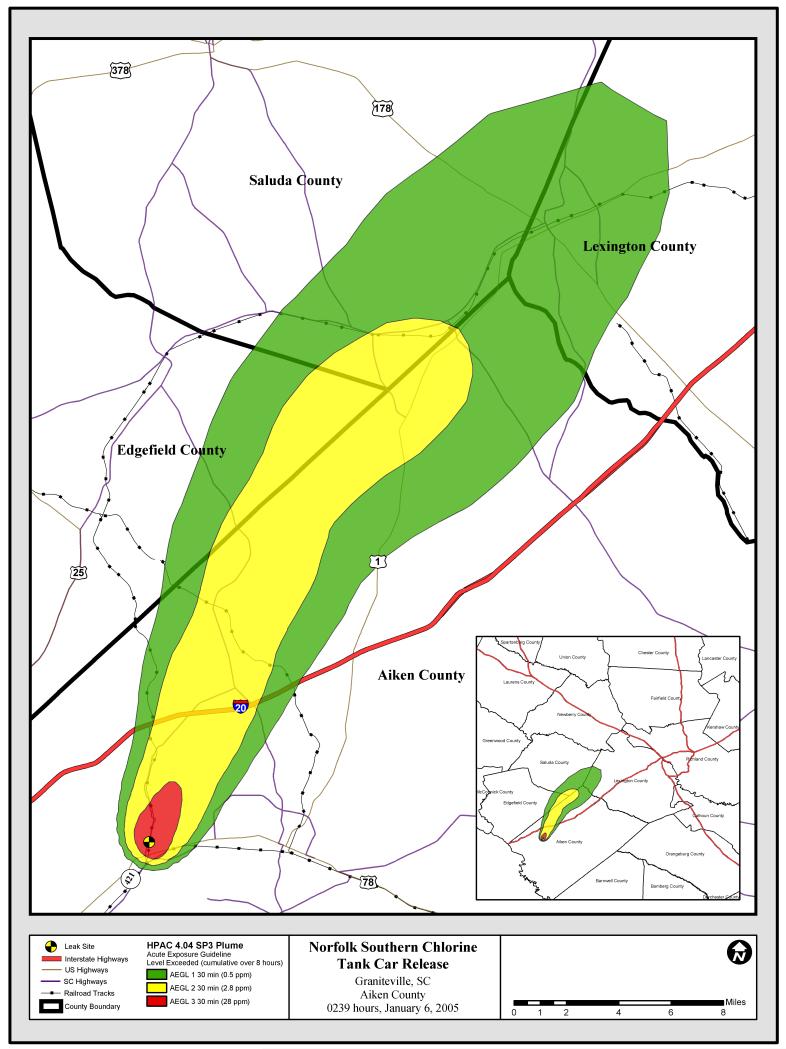
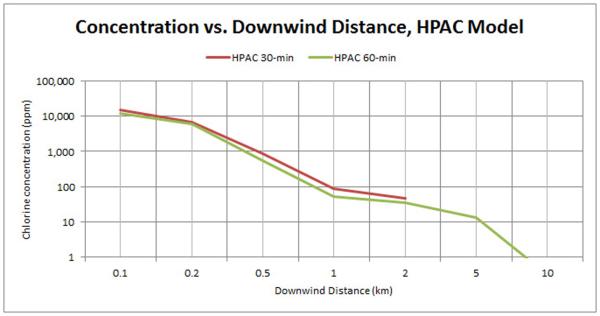
Plume dispersion modeling systems are often used in assessing human exposures to chemical hazards for epidemiologic study. We modeled the 2005 Graniteville, South Carolina, 54,915 kg railcar chlorine release using both the Areal Locations of Hazardous Atmospheres and Hazard Prediction and Assessment Capability (HPAC) plume modeling systems. We estimated the release rate by an engineering analysis combining semi-quantitative observations and fundamental physical principles. The use of regional meteorological conditions was validated by comparing concentration estimates generated by two source-location weather data-sets. The HPAC model estimated a chlorine plume with 20 ppm outdoor concentrations up to 7 km downwind and 0.25 km upwind/downgrade. A comparative analysis of our two models showed that HPAC was the best candidate for use as a model system on which epidemiologic studies could be based after further model validation. Further validation studies are needed before individual exposure estimates can be reliable and the chlorine plume more definitively modeled.
Keywords: agriculture; atmospheric; epidemiology; risk.
Figures
References
-
- Agency for Toxic Substances and Disease Registry (ATSDR) Toxicological Profile for Chlorine. 2010 Retrieved January 15, 2013, from http://www.atsdr.cdc.gov/toxprofiles/tp172.pdf. - PubMed
-
- Association of American Railroads HazMat Transport by Rail. 2007 Retrieved January 15,2013, from http://www.aar.org.
-
- Binder RC. Flow Measurement. In: Streeter VL, editor. Handbook for Fluid Dynamics. McGraw-Hill Book Co; New York, NY: 1961. Chap. 14.
-
- Board on Atmospheric Sciences and Climate (BASC) Tracking and Predicting the Atmospheric Dispersion of Hazardous Material Releases: Implications for Homeland Security. The National Academies Press; Washington D.C: 2003.
-
- Britter R, Jeffrey W, Leung J, Hanna S. Toxic Industrial Chemical (TIC) Source Emissions Modeling for Pressurized Liquified Gases. Atmospheric Environment. 2011;45:1–25.
Publication types
MeSH terms
Substances
Grants and funding
LinkOut - more resources
Full Text Sources
Other Literature Sources