. 2015 Apr 9;161(2):387-403.
doi: 10.1016/j.cell.2015.02.046. Epub 2015 Mar 12.

The genetic architecture of the human immune system: a bioresource for autoimmunity and disease pathogenesis

Affiliations

The genetic architecture of the human immune system: a bioresource for autoimmunity and disease pathogenesis

Mario Roederer et al. Cell. .

Abstract

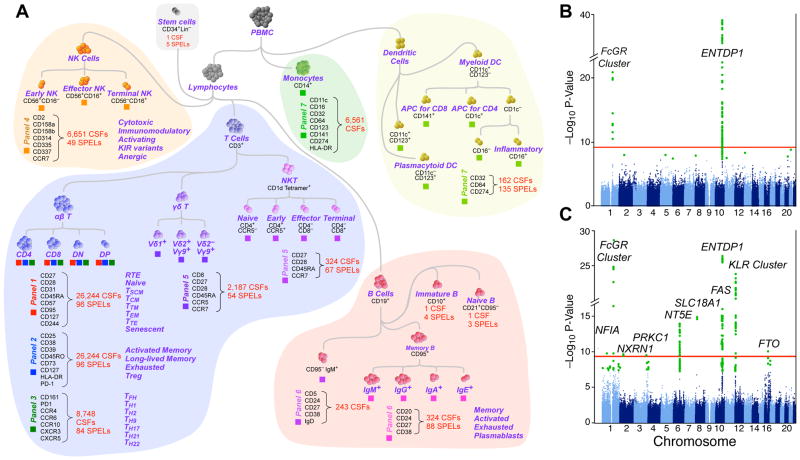
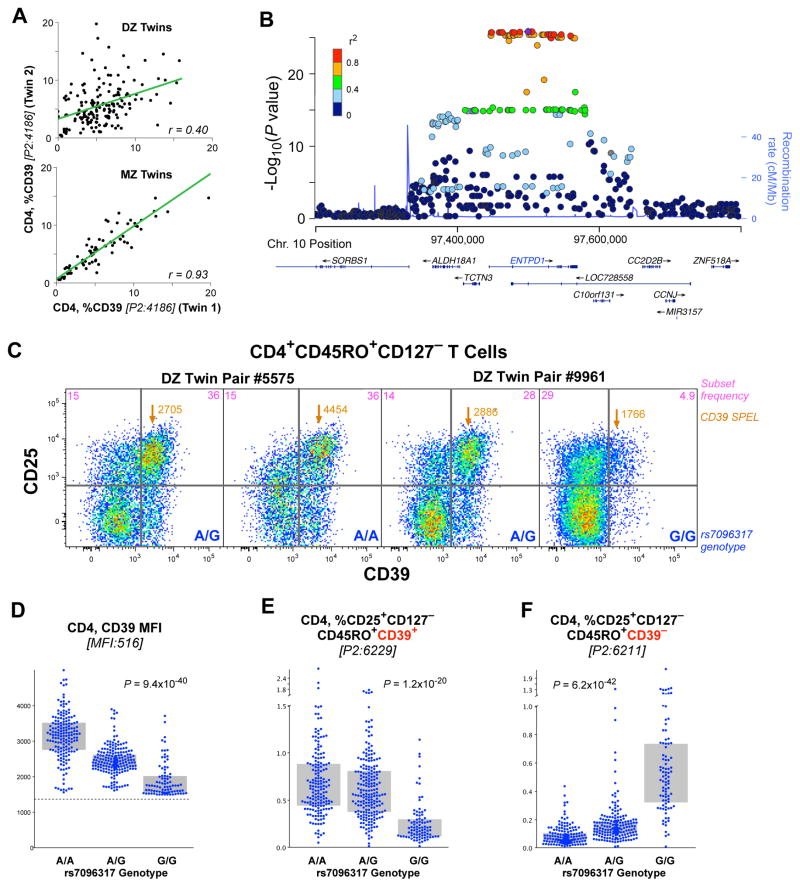
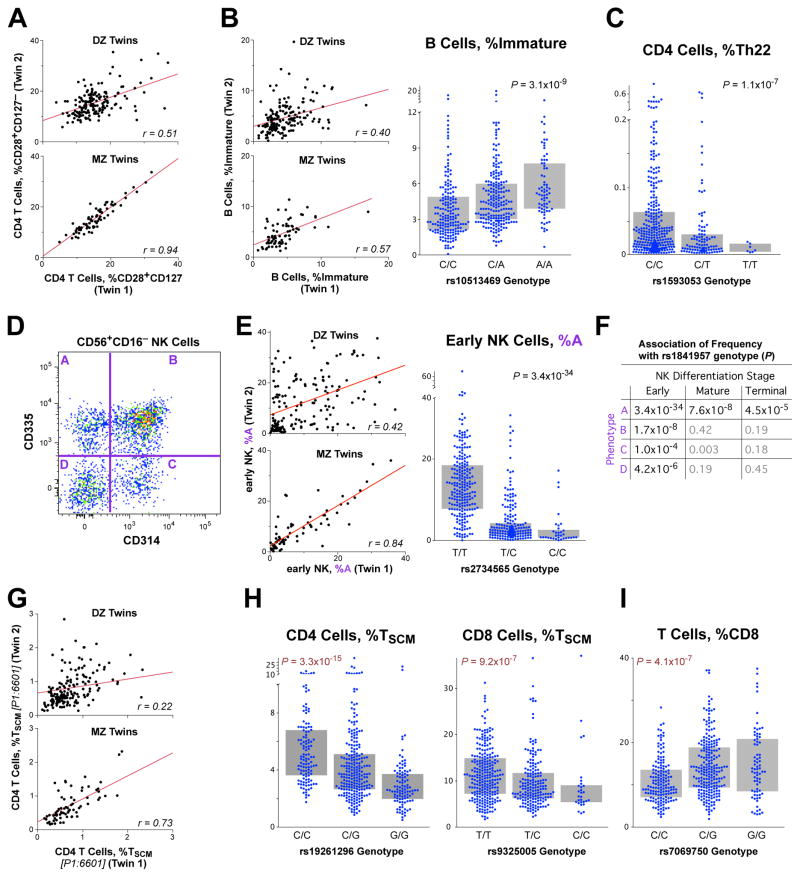
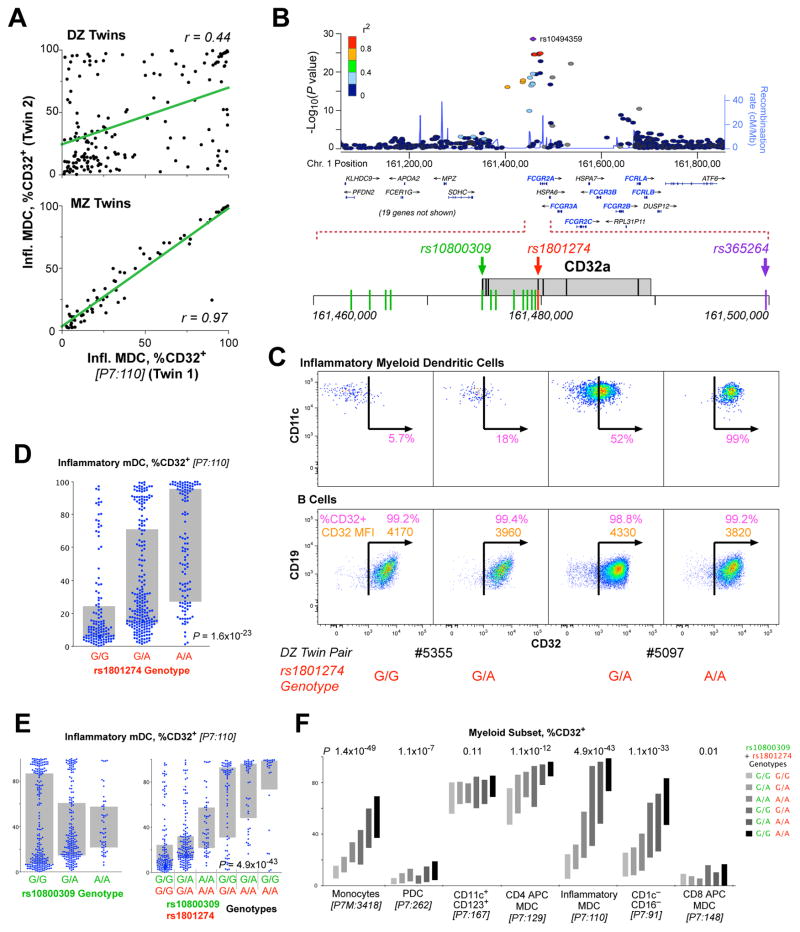
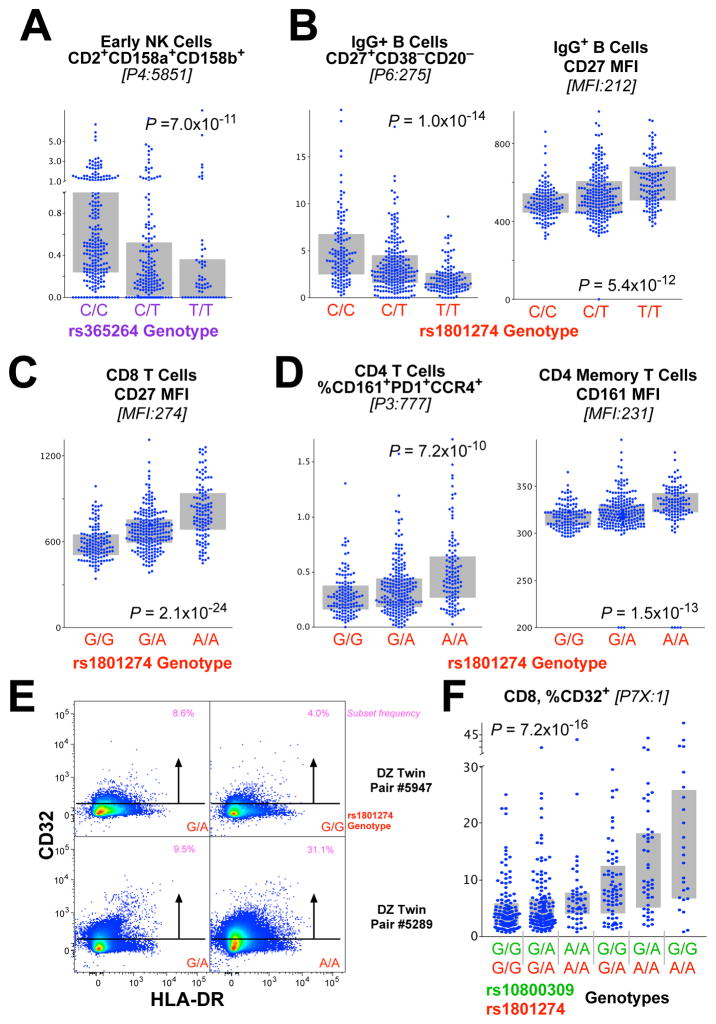
Despite recent discoveries of genetic variants associated with autoimmunity and infection, genetic control of the human immune system during homeostasis is poorly understood. We undertook a comprehensive immunophenotyping approach, analyzing 78,000 immune traits in 669 female twins. From the top 151 heritable traits (up to 96% heritable), we used replicated GWAS to obtain 297 SNP associations at 11 genetic loci, explaining up to 36% of the variation of 19 traits. We found multiple associations with canonical traits of all major immune cell subsets and uncovered insights into genetic control for regulatory T cells. This data set also revealed traits associated with loci known to confer autoimmune susceptibility, providing mechanistic hypotheses linking immune traits with the etiology of disease. Our data establish a bioresource that links genetic control elements associated with normal immune traits to common autoimmune and infectious diseases, providing a shortcut to identifying potential mechanisms of immune-related diseases.


Figures

Figure 1
Figure 1. Schematic representation of leukocyte populations analyzed and summary Manhattan plot
(A) This diagram illustrates the approach to analyzing the immunophenotyping data obtained by flow cytometry. It is not meant to convey differentiation stages of leukocyte populations though that property is largely reflected in this diagram. Each “lineage” of a subset of leukocytes was identified through hierarchical gating. Within each of these lineages, all possible combinations of markers with heterogeneous expression within the lineage were analyzed. The number of subsets identified by this combinatorial approach is shown in various lineages; the trait analyzed was the cell subset frequency (CSF) within its parent lineage. In addition, the cell surface protein expression level (SPEL) was quantified by the median fluorescence intensity of the antibody staining on a given cell subset; the number of SPEL traits is indicated as well. (B, C) Summary Manhattan plots: Green dots: genome-wide significant associations (P<5×10⁻⁸). The red line indicates the significance threshold of P<3.3×10⁻¹⁰, which corresponds to the standard genome wide threshold after further adjustment for 151 independent tests. The variants shown are MAF≥0.1, Call rate ≥0.9, HWE P-value ≥1×10⁻⁸. Shown are separate plots for SPEL associations (B) and CSF associations (C).
Figure 2
Figure 2. Genetic associations with Treg phenotype cells
(A) The correlation of the fraction of CD4 T cells that are CD39+ in dizygotic twins (upper) and monozygotic twins (lower). The linear correlation, r, is shown for each comparison. (B) Locus-plot showing significant effect of individual SNPs on CD39 expression on CD4 T cells. (C) Shown are the expression profiles of CD39 and CD25 for the subset of CD4 T cells that are CD45RO+CD127, for two pairs of dizygotic twins discordant for the rs7096317 allele (in the CD39 gene locus). Within each graphic is shown the fraction of cells in the upper two quadrants and the surface protein expression level (SPEL) of CD39 for the cells in the upper right quadrant, as well as the genotype of each individual. (D) The CD39 SPEL of CD39 positive cells is graphed by the genotype of rs7096317; the dotted line indicates the threshold of positivity above which a cell was considered CD39+. In the C/C genotype, relatively few cells are above this threshold and the median fluorescence intensity values are not robust. (E, F) The fraction of CD4 T cells of the designated phenotype is graphed by the rs7096317 genotype. Bars indicate interquartile range.
Figure 3
Figure 3. Genetic associations with lymphocyte differentiation
(A) The proportion of CD4 T cells that are “transitional memory” (CD28+CD127) is shown for DZ and MZ twins. (B) The proportion of B cells that are immature is shown for twins (left) and is strongly associated with the genotype of rs10513469 (MME gene) (right). (C) The proportion of CD4 T cells that are Th22 (CXCR3CCR4+CCR6+CCR10+) is associated with the genotype of rs2019604. (D) A frequency of four phenotypes within NK cells (designated as “A”…”D” based on the expression of CD314 (KLRC4) and CD335 is shown for “early” (CD56+CD16+) differentiated NK cells. (E) The proportion of early NK cells that are CD314CD335+ (population “A”) is shown for DZ and MZ twins (left). (Right) The genotypes of rs1841957 (near the KLRC4/CD314 locus) strongly associates with the frequency of CD314CD335+ cells amongst early NK. (F) The associations of rs1841957 with all four phenotypes within differentiation stages of NK cells is shown by P-value. (G) The proportion of CD4 T cells that are “stem cell memory” (TSCM: CD45RA+CD95+CD27+CD28+CD127+CD57) is shown for DZ and MZ twins. (H, I) The genotypes of rs7069750 (FAS gene) are associated with the proportion of CD4 and CD8 T cells that are TSCM, as well as the proportion of all T cells that are CD8.
Figure 4
Figure 4. Genetic associations of the FcR locus with myeloid immunophenotypes
(A) The correlation of the fraction of imDCs that are CD32+ for dizygotic twins (upper) and monozygotic twins (lower). The linear correlation, r, is shown for each comparison. (B) Organization of the FcR locus of chromosome 1 showing the position of immunologically relevant genes (shown in gray boxes). The positions of three SNPs are highlighted in color; rs1801274 and rs10800309 are the two that are most closely associated to susceptibility to SLE. SNP’s shown in green were in complete linkage disequilibrium within the samples analyzed in our cohort. (C) Sample expression profiles of CD32 on imDCs (upper) and B cells (lower). Shown are the fraction of cells that are CD32+ (in pink) and, for the B cells, the CD32 SPEL (in orange). Two pairs of dizygotic twins discordant for the genotype at rs1801274 are shown. (D) The distribution of expression of CD32+ imDCs is shown by genotype at rs1801274. (E) The expression of CD32 on the imDCs is not significantly associated with the genotype at rs10800309 by standard ANOVA (p = ns); however, the distributions are clearly different by genotype. The combination of the genotype at rs10800309 and rs1801274 provides a dramatic distinction for the expression of CD32 on imDC. (F) The expression profile of CD32 on seven different myeloid populations is shown, broken down by the combined genotype of the two SNPs. Bars indicate interquartile range.
Figure 5
Figure 5. Genetic associations of the FcR locus with lymphoid immunophenotypes
(A) The genotype of rs365264 (close to CD16a on chromosome 1) is strongly associated CD56+CD16 (“early”) NK cells that are CD2+CD158a+CD158b+. (B) The genotype of rs1801274 is associated with the frequency of memory IgG+ B cells that are CD27+CD38CD20 as well as the fraction of CD27+ cells. Note that, for this case, a lower frequency of the subset (left) is associated with higher protein expression (right). (C) Similarly, the genotype of rs1801274 is strongly associated with the cell surface expression of CD27 on CD8 T cells. (D) The genotype of rs1801274 is strongly associated with the cell surface expression of CD161 on CD4 T cells, as well as CD4 T cells that are CD161+PD1+CCR4+. (E) CD8 T cells express low levels of CD32 depending on genotype as shown by flow cytometry. (F) The fraction of CD8 T cells that express CD32 is strongly associated with the rs10800309:rs1801274 diplotype (see Figure 4).

References

    1. Ahmadi KR, Hall MA, Norman P, Vaughan RW, Snieder H, Spector TD, Lanchbury JS. Genetic determinism in the relationship between human CD4+ and CD8+ T lymphocyte populations? Genes Immun. 2001;2:381–387. - PubMed
    1. Amadori A, Zamarchi R, De Silvestro G, Forza G, Cavatton G, Danieli GA, Clementi M, Chieco-Bianchi L. Genetic control of the CD4/CD8 T-cell ratio in humans. Nat Med. 1995;1:1279–1283. - PubMed
    1. Antonioli L, Pacher P, Vizi ES, Hasko G. CD39 and CD73 in immunity and inflammation. Trends in molecular medicine. 2013;19:355–367. - PMC - PubMed
    1. Aulchenko YS, Ripke S, Isaacs A, van Duijn CM. GenABEL: an R library for genome-wide association analysis. Bioinformatics. 2007;23:1294–1296. - PubMed
    1. Bastid J, Cottalorda-Regairaz A, Alberici G, Bonnefoy N, Eliaou JF, Bensussan A. ENTPD1/CD39 is a promising therapeutic target in oncology. Oncogene. 2013;32:1743–1751. - PubMed

Publication types