. 2015 Jan 1;10(1):49-65.
doi: 10.2217/fnl.14.60.

Anatomical, functional and molecular biomarker applications of magnetic resonance neuroimaging

Affiliations

Anatomical, functional and molecular biomarker applications of magnetic resonance neuroimaging

Christina H Liu. Future Neurol. .

Abstract

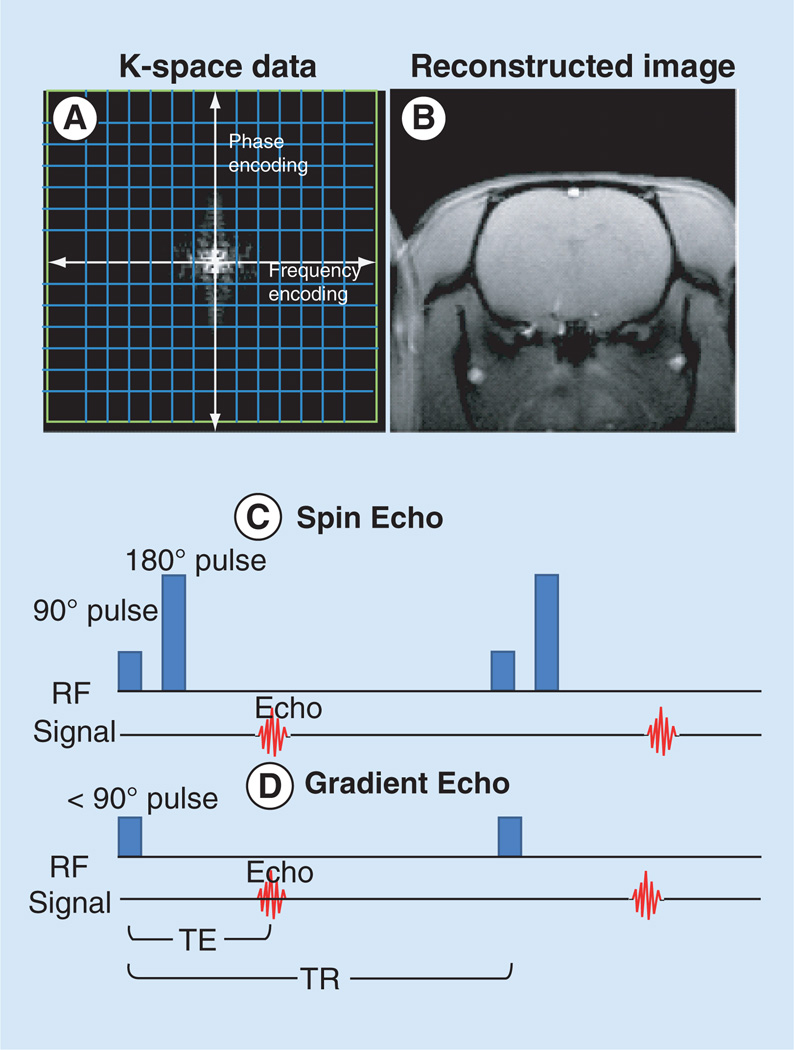
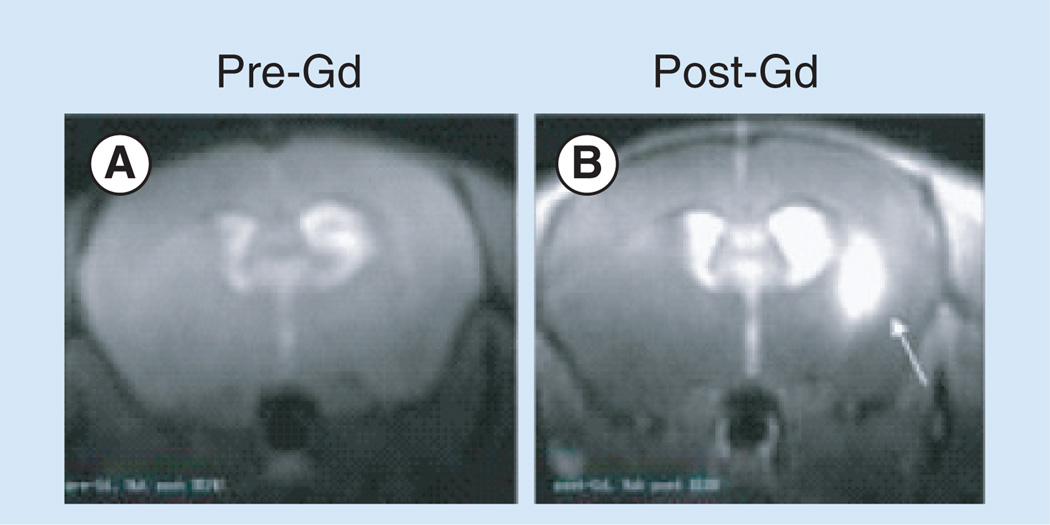
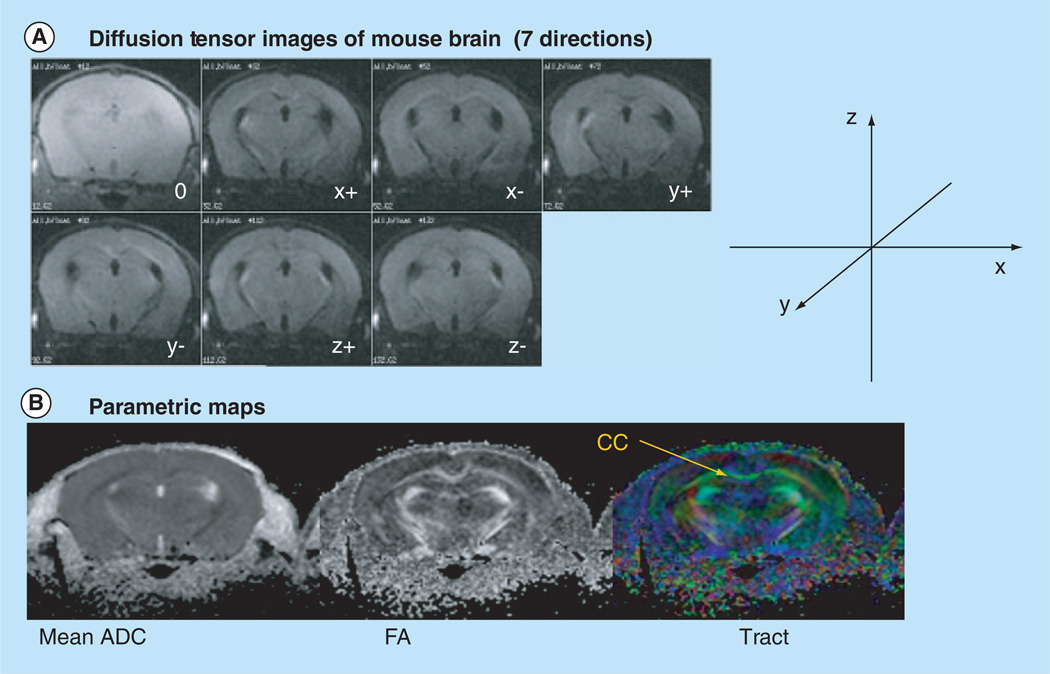
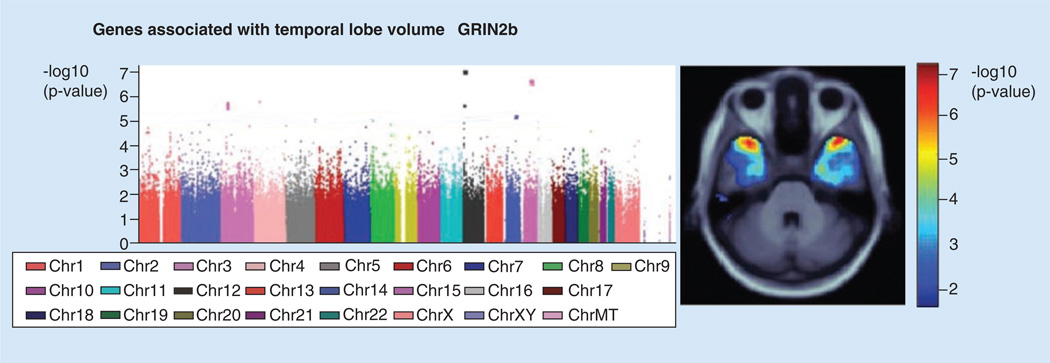
MRI and magnetic resonance spectroscopy (MRS) along with computed tomography and PET are the most common imaging modalities used in the clinics to detect structural abnormalities and pathological conditions in the brain. MRI generates superb image resolution/contrast without radiation exposure that is associated with computed tomography and PET; MRS and spectroscopic imaging technologies allow us to measure changes in brain biochemistry. Increasingly, neurobiologists and MRI scientists are collaborating to solve neuroscience problems across sub-cellular through anatomical levels. To achieve successful cross-disciplinary collaborations, neurobiologists must have sufficient knowledge of magnetic resonance principles and applications in order to effectively communicate with their MRI colleagues. This review provides an overview of magnetic resonance techniques and how they can be used to gain insight into the active brain at the anatomical, functional and molecular levels with the goal of encouraging neurobiologists to include MRI/MRS as a research tool in their endeavors.

Keywords: MRI; MRS; anatomical MRI; brain biomarkers; functional MRI; molecular MRI; neuroimaging.


Conflict of interest statement

Financial & competing interests disclosure

The author has no relevant affiliations or financial involvement with any organization or entity with a financial interest in or financial conflict with the subject matter or materials discussed in the manuscript. This includes employment, consultancies, honoraria, stock ownership or options, expert testimony, grants or patents received or pending, or royalties.

No writing assistance was utilized in the production of this manuscript.

Figures

Figure 1
Figure 1. An example of raw data acquired from an MRI scanner, its corresponding magnetic resonance image and diagrams of standard magnetic resonance image sequences
(A) A raw data matrix obtained from magnetic resonance scanner vs (B) magnetic resonance image (C) spin echo and (D) gradient echo imaging pulse sequences. (A & B) Courtesy of Dr Philip Zhe Sun at Massachusetts General Hospital (MA, USA).
Figure 2
Figure 2. MR image contrast can be manipulated by varing the acqusition parameters such as the time between two consecutive excitation pulses and the time between the excitation pulse and the echo and/or acquisiton schemes such as spin echo or gradient echo imaging
Comparison between T1- and T2-weighted SE images of (A) mouse brain at 9.4 T, acquisition TR and TE are displayed in corresponding images of (B) human brain at 1.5 T. Panel (C) shows artifacts that are further exaggerated in GRE images at 9.4 T (with flip angle of 30°, top panel), most noticeably in the air–tissue interface, compared with the SE images acquired using the same TE and image resolution. GRE: Gradient echo imaging; SE: Spin echo; T1W: T1-weighted; T2W: T2-weighted; TE: Time between the excitation pulse and the echo; TR: Time between two consecutive excitation pulses. (B) Adapted with permission from from [6].
Figure 3
Figure 3. Diffusion-weighted images of human brain and a mouse brain
(A) A series of diffusion weighted images of a human brain with increasing b values. (B) Hyperintensive signals in DWI of a mouse brain reveal areas of metabolic disturbance in one side of the brain immediately after cerebral ischemia (arrows). DWI: Diffusion-weighted imaging. (A) Courtesy of Dr Kamil Ugurbil at University of Minnesota (MN, USA).
Figure 4
Figure 4. Typical 1H-magnetic resonance spectroscopy of a normal brain reveals several prominent brain metabolites located at different chemical shift locations
Levels of any or multiple of these metabolites deviated from the normal range are indicative of disease progression. Cr: Creatine; Myo: Myo-inosotol; Cho: Choline; Glx: Glutamine and glutamate; MRS: Magnetic resonance spectroscopy; NAA: N-acetylaspartate. Adapted with permission from [18].
Figure 5
Figure 5. Gadolinium injection during MRI scans can reveal areas of compromised blood–brain barrier after a stroke
While ordinary SE image appears (A) normal (pre-Gd), Gd-enhanced MRI reveals areas of blood–brain barrier leakage due to (B) the retention of Gd-DTPA (post-Gd) after intravenous injection of Magnevist. Adapted with permission from [23]. BBB: Blood–brain barrier; Gd: Gadolinium; SE: Spin echo.
Figure 6
Figure 6. Series of images used to computer T1 or T2 maps
(A & B) T1 and T2 maps are computed from a series of spin-echo images with incremental inversion time for T1 map (inversion times ranging from 500 to 2500 ms) and (C & D) with incremental echo time for T2 map (TE of 20, 40, 60 and 80 ms). (A & B) Courtesy of Dr Phillip Zhe Sun at Massachusetts General Hospital (MA, USA).
Figure 7
Figure 7. Magnetic resonance images used to compute the diffusion tensor parametric maps
(A) A series of diffusion-weighted images are acquired at different gradient directions (no diffusion weighting, positive x, negative x, positive y, negative y, positive z and negative z, referring to the coordinate to the right). (B) Maps of apparent diffusion coefficients, fractional anisotropy and tractography (tract) are generated. ADC: Apparent diffusion coefficient; FA: Fractional anisotropy.
Figure 8
Figure 8. Schematic image of manganese-enhanced MRI
(A) Manganese ions act as calcium iron analog and enter neurons through calcium channel upon neuronal activation. (B) Retention of manganese ions in neurons clearly delineate neuronal formation in the hippocampus. Adapted with permission from [41]. MEMRI: Manganese-enhanced MRI.
Figure 9
Figure 9. Genome-wide association study identified a common glutamate receptor variant (GRIN2b) with suggestive evidence of association with temporal lobe volume and increased risk for Alzheimer’s disease in 740 brain MRI scans
Adapted with permission from [55].
Figure 10
Figure 10. Arterial spin-labeling MRI of human brains
ASL images of patients diagnosed to have PTSD show increased perfusion in the cortex (B) compared with non-PTSD subjects in (A). ASL: Arterial spin-labeling; PTSD: Post-traumatic stress disorders. Adapted with permission from [67].

References

    1. Moratal D, Valles-Luch A, Marti-Bonmati L, Brummer M. k-Space tutorial: an MRI educational tool for a better understanding of k-space. Biomed Imaging Interv. J. 2008;4(1):e15. - PMC - PubMed
    1. Pohmann R, Shajan G, Balla DZ. Contrast at high field: relaxation times, magnetization transfer and phase in the rat brain at 16.4 T. Magn. Reson. Med. 2011;66(6):1572–1581. - PubMed
    1. The Basics of MRI, Chapter 4 NMR Spectroscopy. www.cis.rit.edu

    1. The Basics of MRI, Chapter 8 Basic ImagingTechniques. www.cis.rit.edu

    1. Introduction to MR image contrast: a power point presentation by Brent K Stewart PhD, DABMP at the University of Washington. www.rad.washington.edu

LinkOut - more resources