. 2015 Apr;125(4):1533-44.
doi: 10.1172/JCI73137. Epub 2015 Mar 16.

Resetting the transcription factor network reverses terminal chronic hepatic failure

Resetting the transcription factor network reverses terminal chronic hepatic failure

Taichiro Nishikawa et al. J Clin Invest. 2015 Apr.

Abstract

The cause of organ failure is enigmatic for many degenerative diseases, including end-stage liver disease. Here, using a CCl4-induced rat model of irreversible and fatal hepatic failure, which also exhibits terminal changes in the extracellular matrix, we demonstrated that chronic injury stably reprograms the critical balance of transcription factors and that diseased and dedifferentiated cells can be returned to normal function by re-expression of critical transcription factors, a process similar to the type of reprogramming that induces somatic cells to become pluripotent or to change their cell lineage. Forced re-expression of the transcription factor HNF4α induced expression of the other hepatocyte-expressed transcription factors; restored functionality in terminally diseased hepatocytes isolated from CCl4-treated rats; and rapidly reversed fatal liver failure in CCl4-treated animals by restoring diseased hepatocytes rather than replacing them with new hepatocytes or stem cells. Together, the results of our study indicate that disruption of the transcription factor network and cellular dedifferentiation likely mediate terminal liver failure and suggest reinstatement of this network has therapeutic potential for correcting organ failure without cell replacement.


Figures

Figure 6
Figure 6. Improvement in liver function after treatment with HNF4α re-expression is not mediated by expansion of new cells.
(A) Fluorescence staining for Ki-67, a proliferation marker in AAV-HNF4α-GFP–treated decompensated cirrhotic hepatocytes; original magnification, ×200. Images are representative of four images per biologic group. (B) qPCR analyses of hepatic progenitor marker genes (Afp, Cd44, and Epcam) and mature hepatic-specific genes (Alb, Asgpr1, and Ck18) from animals with liver disease. (C) HNF4α-treated end-stage hepatocytes were transplanted into the livers of Nagase analbuminemic rats, which were treated with retrorsine and underwent partial hepatectomy. (D) qPCR analysis for Tert expression and telomere length by genomic DNA analysis. qPCR and other studies were performed using three technical replicates from hepatocytes isolated from one animal representing each biological group. Each transplant group represents five animals infused with hepatocytes isolated from one animal that underwent each of the various interventions. Each value represents the mean ± SD (AD). Statistical analyses were performed using the Tukey-Kramer multiple comparisons procedure among isolated hepatocytes from normal livers, compensated and decompensated cirrhotic livers, and decompensated cirrhotic livers 14 weeks after AAV-HNF4α/GFP treatment. Statistical results are shown among three groups (normal hepatocytes and functionally compensated and decompensated hepatocytes from cirrhotic livers) and between untreated decompensated cirrhotic hepatocytes and decompensated cirrhotic hepatocytes 14 weeks after in vivo HNF4α re-expression (A and B, *P < 0.05, **P < 0.01); and among isolated hepatocytes from normal livers, compensated and decompensated cirrhotic livers, and decompensated cirrhotic livers 14 weeks after AAV-HNF4α/GFP treatment (D, *P < 0.05, **P < 0.01).
Figure 5
Figure 5. Hepatocytes recovered from treated rats with terminally decompensated function and cirrhosis after HNF4α re-expression show normalization of function and gene expression profile.
(A) Albumin synthesis and cytochrome P450 (CYP3A4) activity in decompensated hepatocytes recovered 14 weeks after AAV-HNF4α/GFP treatment. Hepatocytes recovered from normal livers and cirrhotic livers with normal liver function were used as controls. (B) qPCR analysis of hepatocyte transcription factor network and hepatocyte-specific gene expression in age-matched control hepatocytes and hepatocytes recovered from functionally decompensated livers and decompensated cirrhotic livers 14 weeks after AAV-HNF4α/GFP treatment. Studies were performed using three technical replicates from hepatocytes isolated from one animal representing each biological group. Each value represents the mean ± SD. Statistical analyses were performed using the Tukey-Kramer multiple comparisons procedure among isolated hepatocytes from normal livers and compensated and decompensated cirrhotic livers and decompensated cirrhotic livers 14 weeks after AAV-HNF4α/GFP treatment. Significant differences are shown between cells from decompensated cirrhotic livers and decompensated cirrhotic livers 14 weeks after AAV-HNF4α/GFP treatment (A and B, **P < 0.01).
Figure 4
Figure 4. HNF4α re-expression in the hepatocytes of rats with terminal decompensated liver function and cirrhosis immediately reverses hepatic failure.
Cirrhotic rats with severe terminal liver failure, 4 weeks after the last dose of CCl4, were given a recombinant AAV vector expressing either HNF4α and GFP or GFP only. (A) Fluorescence staining for GFP and costaining for hepatocyte (albumin) or non-parenchymal liver cell (α-SMA and EPCAM) markers; original magnification, ×200. (B) Fluorescence staining for GFP, HNF4α, and albumin at each time point, demonstrating the level of transduction and gene expression following intervention; original magnification, ×100. Nuclear DAPI staining is shown in blue. (C) Survival and clinical parameters of liver failure in control and AAV-GFP– and AAV-HNF4α-GFP–treated animals with decompensated cirrhosis. Immunofluorescence was performed on specimens from one animal per group and is representative of four images per biologic group. Five cirrhotic animals were untreated, four animals were treated with an AAV vector encoding the gene for GFP, and five animals were treated with an AAV vector encoding the genes for both HNF4α and GFP. Each value represents the mean ± SD, and survival was statistically evaluated by log-rank test between groups without treatment versus with treatment with the AAV vector encoding the genes for both HNF4α and GFP (C, *P < 0.01).
Figure 3
Figure 3. HNF4α re-expression in isolated hepatocytes from functionally decompensated livers with terminal cirrhosis shows immediate improvement in gene expression and function in vitro.
(A) qPCR analysis of hepatocyte transcription factor network and hepatocyte-specific genes. (B) Albumin synthesis and cytochrome P450 (CYP3A4) activity. Studies were carried out on culture day 2 and compare hepatocytes from normal liver and decompensated cirrhotic livers, the latter also treated with AAV-HNF4α-GFP or AAV-GFP. Re-expression of HNF4α led to improvement in vitro within 48 hours. qPCR and albumin ELISA were performed using three technical replicates, and CYP activity was done using five technical replicates from hepatocytes isolated from one normal control and one decompensated cirrhotic animal. Each value represents the mean ± SD (A and B). Statistical analyses were performed using the Tukey-Kramer multiple comparisons procedure among normal hepatocytes and decompensated cirrhotic hepatocytes without and with AAV-HNF4α-GFP or AAV-GFP treatment. The statistical results are shown among decompensated cirrhotic hepatocytes without and with AAV-HNF4α-GFP or AAV-GFP treatment (A) and between decompensated cirrhotic hepatocytes without and with AAV-HNF4α-GFP (B) (*P < 0.05, **P < 0.01).
Figure 2
Figure 2. Hepatocyte-enriched transcription factor network genes and liver-specific genes are severely downregulated in decompensated hepatocytes from end-stage livers.
(A) Expression changes by qPCR in the hepatocyte transcription factor network genes Foxa2, Hnf1a, Cebpa, and Ppara with progression from degenerative liver disease to chronic and terminal hepatic failure. (B) Expression of liver-specific genes and genes affected downstream of HNF4α. A1at, α1-antitrypsin; Otc, ornithine transcarbamylase; F7, coagulation factor VII; Apoe, Apoa2, and Apoc3, apolipoproteins E, A2, and C3; Cyp3a23/3a1, cytochrome P450 3a23; Tdo2, tryptophan 2,3-dioxygenase; Tf, transferrin; Ttr, transthyretin; and Tat, tyrosine aminotransferase. qPCR was performed using three technical replicates and cDNA pooled from 4–5 animals per biological group. Each value represents the mean ± SD (A and B). Statistical analyses were performed using the Tukey-Kramer multiple comparisons procedure among normal hepatocytes or compensated or decompensated cirrhotic hepatocytes (A and B, *P < 0.05, **P < 0.01).
Figure 1
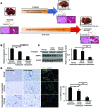
Figure 1. Schematic diagram for the induction of irreversible degenerative liver disease and terminal hepatic failure in rats and changes in HNF4α expression with disease progression.
(A) Schematic diagram of the phenobarbital and CCl4 treatment protocol. Scale bar: 100 µm. (BD) Changes in HNF4α expression with disease progression. (B) qPCR and (C) Western blot for HNF4α expression in isolated hepatocytes from livers with degenerative disease and compensated (Comp) or decompensated (Decomp) function. (D) Immunohistochemistry of liver tissue and isolated hepatocytes; original magnification, ×100 and (cytospins) ×200. Normal age-matched livers or hepatocytes were used as controls. β-Actin was used as the PCR and Western blot control. qPCR and Western blot analysis were performed using three technical replicates and cDNA pooled from 4–5 animals per biological group. Immunohistochemistry is representative of four images per biologic group. Each value represents the mean ± SD (BD). Statistical analyses were performed using the Tukey-Kramer multiple comparisons procedure among normal hepatocytes or compensated or decompensated cirrhotic hepatocytes (BD, *P < 0.05, **P < 0.01).

Comment in

References

    1. Durand F, Valla D. Assessment of the prognosis of cirrhosis: Child-Pugh versus MELD. J Hepatol. 2005;42(suppl 1):S100–S107. - PubMed
    1. Gines P, Cardenas A, Arroyo V, Rodes J. Management of cirrhosis and ascites. N Engl J Med. 2004;350(16):1646–1654. doi: 10.1056/NEJMra035021. - DOI - PubMed
    1. Schuppan D, Afdhal NH. Liver cirrhosis. Lancet. 2008;371(9615):838–851. doi: 10.1016/S0140-6736(08)60383-9. - DOI - PMC - PubMed
    1. Friedman SL. Liver fibrosis — from bench to bedside. J Hepatol. 2003;38(suppl 1):S38–S53. - PubMed
    1. Martinez-Hernandez A, Martinez J. The role of capillarization in hepatic failure: studies in carbon tetrachloride-induced cirrhosis. Hepatology. 1991;14(5):864–874. doi: 10.1002/hep.1840140519. - DOI - PubMed

Publication types

MeSH terms