. 2015 May;47(5):523-527.
doi: 10.1038/ng.3248. Epub 2015 Mar 16.

Susceptibility to tuberculosis is associated with variants in the ASAP1 gene encoding a regulator of dendritic cell migration

Affiliations

Susceptibility to tuberculosis is associated with variants in the ASAP1 gene encoding a regulator of dendritic cell migration

James Curtis et al. Nat Genet. 2015 May.

Abstract

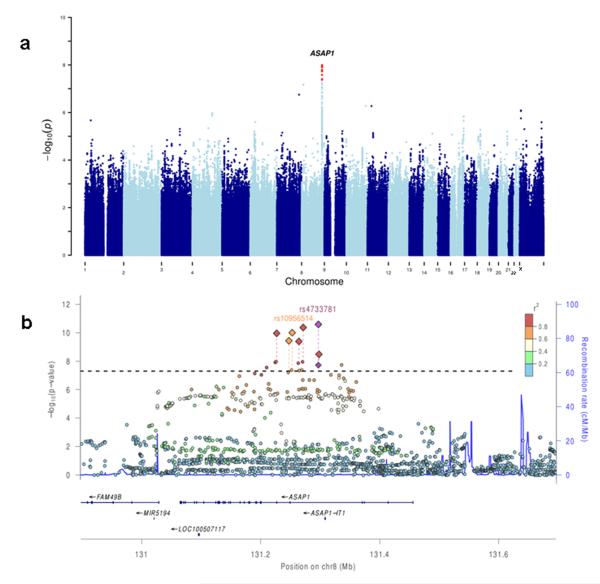
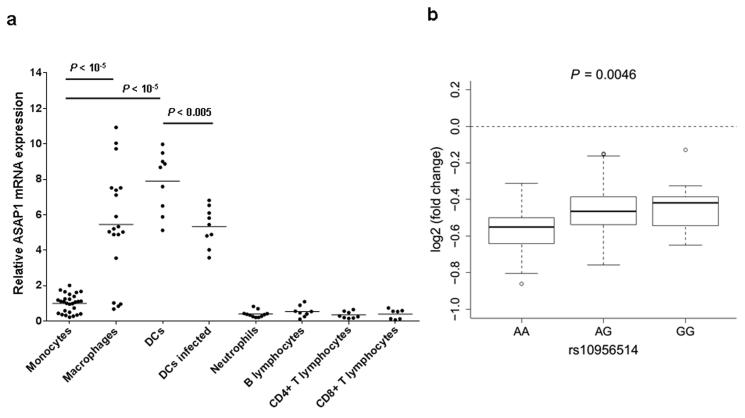
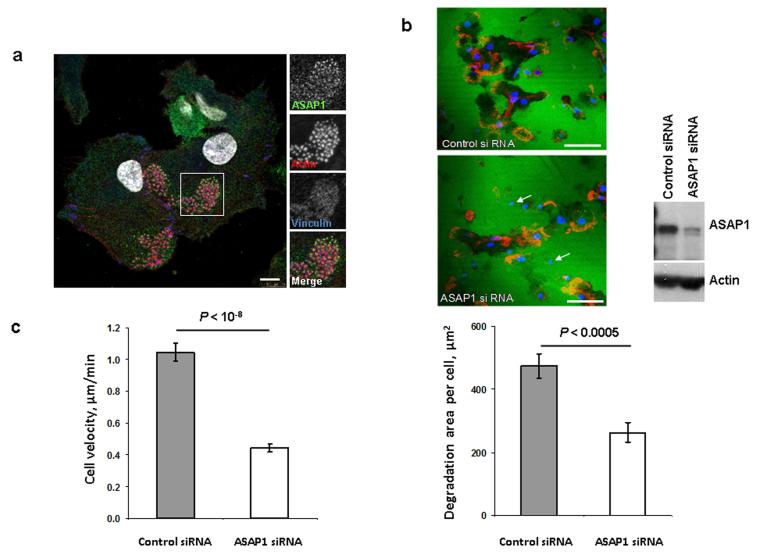
Human genetic factors predispose to tuberculosis (TB). We studied 7.6 million genetic variants in 5,530 people with pulmonary TB and in 5,607 healthy controls. In the combined analysis of these subjects and the follow-up cohort (15,087 TB patients and controls altogether), we found an association between TB and variants located in introns of the ASAP1 gene on chromosome 8q24 (P = 2.6 × 10(-11) for rs4733781; P = 1.0 × 10(-10) for rs10956514). Dendritic cells (DCs) showed high ASAP1 expression that was reduced after Mycobacterium tuberculosis infection, and rs10956514 was associated with the level of reduction of ASAP1 expression. The ASAP1 protein is involved in actin and membrane remodeling and has been associated with podosomes. The ASAP1-depleted DCs showed impaired matrix degradation and migration. Therefore, genetically determined excessive reduction of ASAP1 expression in M. tuberculosis-infected DCs may lead to their impaired migration, suggesting a potential mechanism of predisposition to TB.


Figures

Figure 1
Figure 1. Genome-wide association study of susceptibility to TB
(a) Manhattan plot showing TB association of genotyped and imputed SNPs across the genome. SNPs with P < 5 × 10⁻⁸ are shown in red. (b) Regional plot showing SNPs in the ASAP1 gene region. Circles show P-values obtained in GWAS in Set 1; diamonds show P-values obtained in the follow-up study of 7 SNPs in Sets 1 and 2 combined. Horizontal line corresponds to P < 5 × 10⁻⁸. Colors indicate linkage disequilibrium (r2) between the most-associated SNP rs4733781 and other SNPs.
Figure 2
Figure 2. ASAP1 expression in peripheral blood leukocytes and monocyte-derived macrophages and dendritic cells (DCs)
(a) Levels of the ASAP1 mRNA expression in primary leukocytes of healthy volunteers each measured in triplicate by quantitative reverse transcriptase PCR and shown relative to the level of expression in monocytes. CD14+ monocytes were isolated from peripheral blood of healthy volunteers and cultured either with M-CSF for 5 days to derive macrophages or with GM-CSF and IL-4 for 6 days to derive DCs. DCs were infected with live M. bovis BCG at multiplicity of infection 3:1 for 24 hours. Horizontal bars show mean levels. P-values were calculated using two-tailed Student T test. Unadjusted P-values are shown. (b) Box plot showing the level of reduction of ASAP1 mRNA expression in DCs after M. tuberculosis infection for 65 subjects with different rs10956514 genotypes, 23 (AA), 30 (AG) and 12 (GG). The bold line in the boxplot is the median; the whiskers are 1.5 IQR away from the first and third quartiles. Data are from ref after adjustment for 5 and 8 principle components in non-infected and infected DCs, respectively (see Methods).
Figure 3
Figure 3. In DCs, the ASAP1 protein is partly associated with podosomes and its depletion leads to impaired matrix degradation and migration
(a) Confocal microscopy showing ASAP1 (green), actin (red), vinculin (blue) and nuclei (white) in DCs derived from monocytes of a healthy volunteer. Podosomes are structures characterized by the actin core (visible as red dots) surrounded by other proteins. Boxed area is shown in grayscale enlarged on the right. Scale bar represents 7.5μm. (b) Representative confocal microscopy images (left panel) showing monocyte-derived DCs treated with either ASAP1 or control siRNA and seeded on FITC-conjugated gelatine (green) for 4 hours. The cells were stained to visualize actin (phalloidin-red) and nuclei (DAPI-blue). White arrows show examples of the DAPI-stained nuclei of cells that do not degrade matrix. Scale bar represents 50μm. In the same experiment cell lysates were collected for western blotting and probed with anti-ASAP1 and anti-actin antibodies (right panel) to assess knockdown efficiency. Area of degradation of the FITC-conjugated gelatine matrix by DCs (lower panel). In total 394 and 317 DCs treated with either ASAP1 or control siRNA, respectively, were counted in 4 independent experiments. (c) Migration velocity of DCs in a Dunn chamber. In total 162 and 186 DCs treated with either ASAP1 or control siRNA, respectively, were tracked in 5 independent experiments. Graphs show mean values ± SEM. P-values were calculated using two-tailed Student T test. Unadjusted P-values are shown.

Comment in

References

    1. Zumla A, Raviglione M, Hafner R, von Reyn CF. Tuberculosis. N Engl J Med. 2013;368:745–755. - PubMed
    1. Moller M, Hoal EG. Current findings, challenges and novel approaches in human genetic susceptibility to tuberculosis. Tuberculosis (Edinb) 2010;90:71–83. - PubMed
    1. Apt A, Kramnik I. Man and mouse TB: contradictions and solutions. Tuberculosis (Edinb) 2009;89:195–198. - PMC - PubMed
    1. Thye T, et al. Genome-wide association analyses identifies a susceptibility locus for tuberculosis on chromosome 18q11.2. Nat Genet. 2010;42:739–741. - PMC - PubMed
    1. Thye T, et al. Common variants at 11p13 are associated with susceptibility to tuberculosis. Nat Genet. 2012;44:257–259. - PMC - PubMed

Additional References

    1. Szeszko JS, et al. Resequencing and association analysis of the SP110 gene in adult pulmonary tuberculosis. Hum Genet. 2007;121:155–160. - PubMed
    1. Korn JM, et al. Integrated genotype calling and association analysis of SNPs, common copy number polymorphisms and rare CNVs. Nat Genet. 2008;40:1253–1260. - PMC - PubMed
    1. Howie BN, Donnelly P, Marchini J. A flexible and accurate genotype imputation method for the next generation of genome-wide association studies. PLoS Genet. 2009;5:e1000529. - PMC - PubMed
    1. Howie B, Marchini J, Stephens M. Genotype imputation with thousands of genomes. G3 (Bethesda) 2012;1:457–470. - PMC - PubMed
    1. Marchini J, Howie B. Genotype imputation for genome-wide association studies. Nat Rev Genet. 11:499–511. - PubMed

Publication types

Substances