

Paradoxical effects of all-trans-retinoic acid on lupus-like disease in the MRL/lpr mouse model
- PMID: 25775135
- PMCID: PMC4361690
- DOI: 10.1371/journal.pone.0118176
Paradoxical effects of all-trans-retinoic acid on lupus-like disease in the MRL/lpr mouse model
Abstract
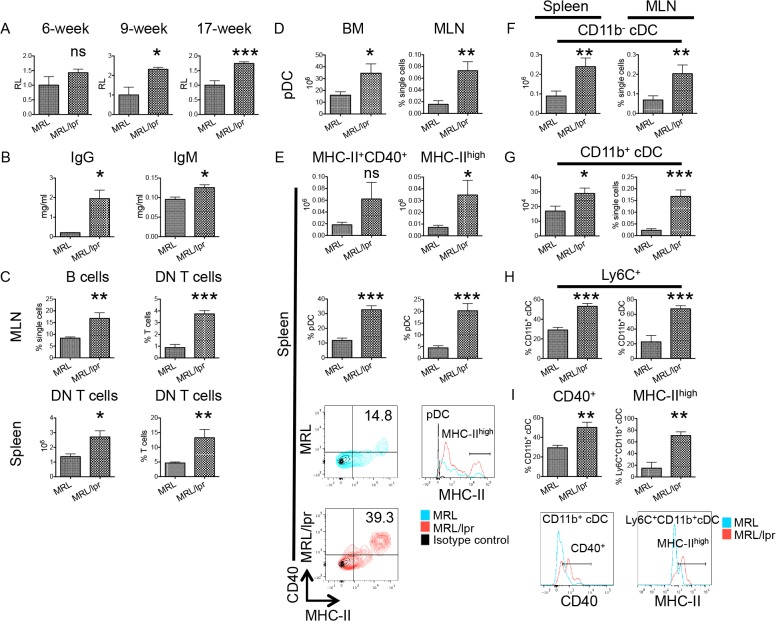
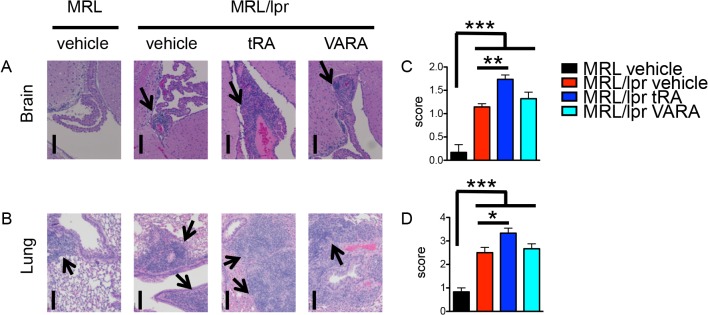
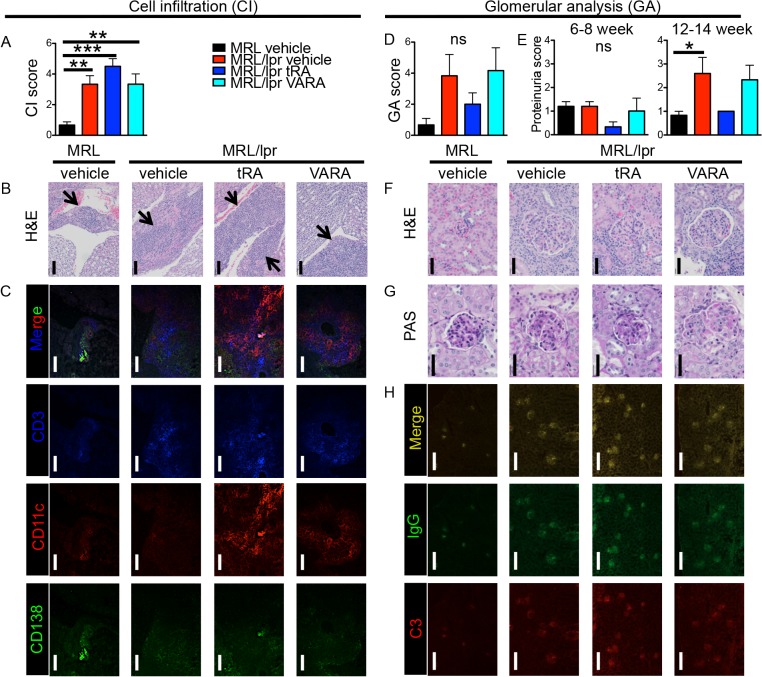
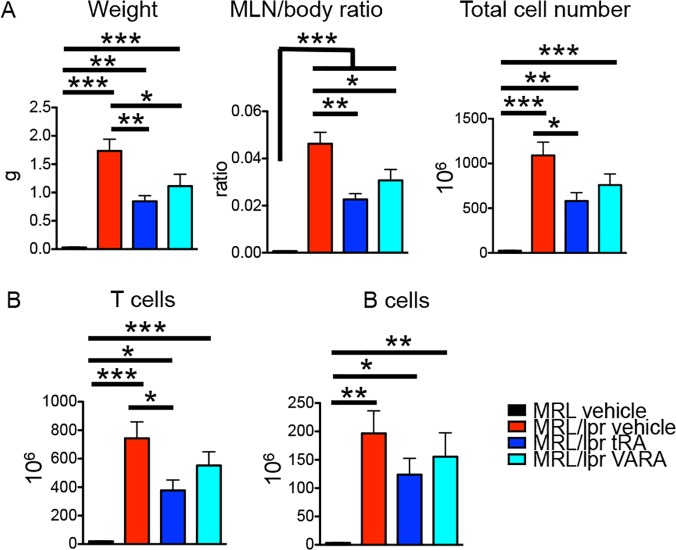
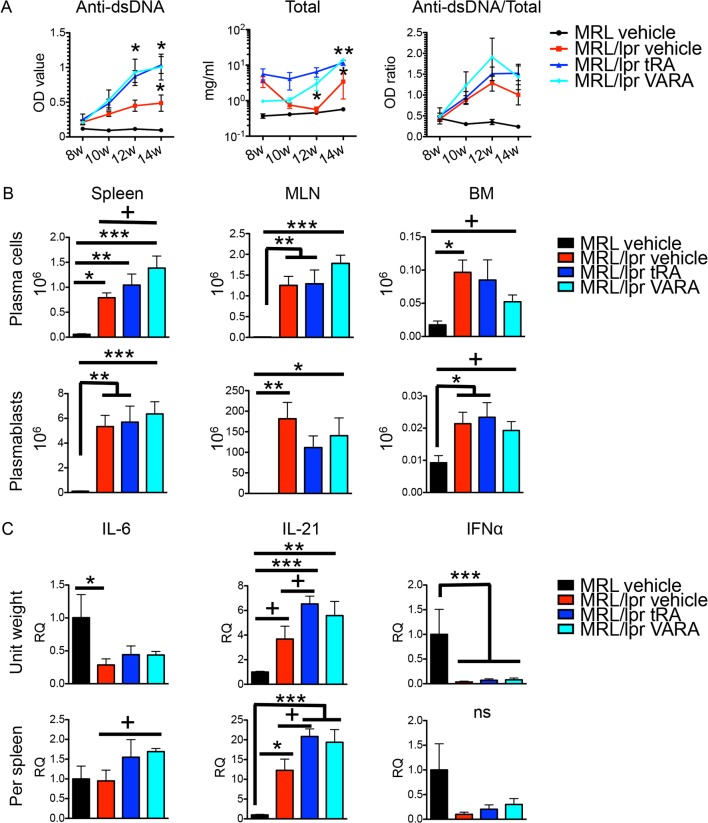
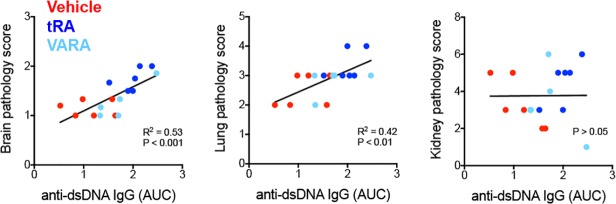
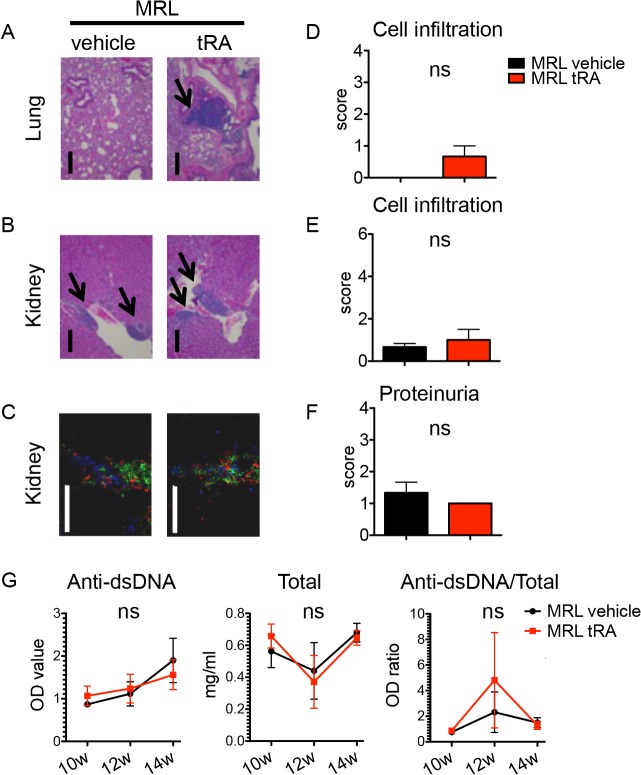
Roles of all-trans-retinoic acid (tRA), a metabolite of vitamin A (VA), in both tolerogenic and immunogenic responses are documented. However, how tRA affects the development of systemic autoimmunity is poorly understood. Here we demonstrate that tRA have paradoxical effects on the development of autoimmune lupus in the MRL/lpr mouse model. We administered, orally, tRA or VA mixed with 10% of tRA (referred to as VARA) to female mice starting from 6 weeks of age. At this age, the mice do not exhibit overt clinical signs of lupus. However, the immunogenic environment preceding disease onset has been established as evidenced by an increase of total IgM/IgG in the plasma and expansion of lymphocytes and dendritic cells in secondary lymphoid organs. After 8 weeks of tRA, but not VARA treatment, significantly higher pathological scores in the skin, brain and lung were observed. These were accompanied by a marked increase in B-cell responses that included autoantibody production and enhanced expression of plasma cell-promoting cytokines. Paradoxically, the number of lymphocytes in the mesenteric lymph node decreased with tRA that led to significantly reduced lymphadenopathy. In addition, tRA differentially affected renal pathology, increasing leukocyte infiltration of renal tubulointerstitium while restoring the size of glomeruli in the kidney cortex. In contrast, minimal induction of inflammation with tRA in the absence of an immunogenic environment in the control mice was observed. Altogether, our results suggest that under a predisposed immunogenic environment in autoimmune lupus, tRA may decrease inflammation in some organs while generating more severe disease in others.
Conflict of interest statement
Figures
Similar articles
-
All- Trans-Retinoic Acid Augments the Histopathological Outcome of Neuroinflammation and Neurodegeneration in Lupus-Prone MRL/lpr Mice.J Histochem Cytochem. 2017 Feb;65(2):69-81. doi: 10.1369/0022155416679638. Epub 2016 Nov 18. J Histochem Cytochem. 2017. PMID: 27856824 Free PMC article.
-
Retinoic acid treatment protects MRL/lpr lupus mice from the development of glomerular disease.Kidney Int. 2004 Sep;66(3):1018-28. doi: 10.1111/j.1523-1755.2004.00850.x. Kidney Int. 2004. PMID: 15327395
-
A benzenediamine derivative fc-99 attenuates lupus-like syndrome in MRL/lpr mice related to suppression of pDC activation.Immunol Lett. 2015 Dec;168(2):355-65. doi: 10.1016/j.imlet.2015.10.017. Epub 2015 Nov 3. Immunol Lett. 2015. PMID: 26545567
-
Alterations in leucocyte trafficking in lupus-prone mice: an examination of the MRL/faslpr mouse.Immunol Cell Biol. 2003 Oct;81(5):390-6. doi: 10.1046/j.1440-1711.2003.01186.x. Immunol Cell Biol. 2003. PMID: 12969327 Review.
-
The MRL Model: A Valuable Tool in Studies of Autoimmunity-Brain Interactions.Methods Mol Biol. 2018;1781:259-285. doi: 10.1007/978-1-4939-7828-1_14. Methods Mol Biol. 2018. PMID: 29705852 Review.
Cited by
-
Tlr5 deficiency exacerbates lupus-like disease in the MRL/lpr mouse model.Front Immunol. 2024 Jan 30;15:1359534. doi: 10.3389/fimmu.2024.1359534. eCollection 2024. Front Immunol. 2024. Retraction in: Front Immunol. 2024 Jul 03;15:1455372. doi: 10.3389/fimmu.2024.1455372. PMID: 38352866 Free PMC article. Retracted.
-
Renal-infiltrating CD11c+ cells are pathogenic in murine lupus nephritis through promoting CD4+ T cell responses.Clin Exp Immunol. 2017 Nov;190(2):187-200. doi: 10.1111/cei.13017. Epub 2017 Aug 18. Clin Exp Immunol. 2017. PMID: 28722110 Free PMC article.
-
Pin1-Targeted Therapy for Systemic Lupus Erythematosus.Arthritis Rheumatol. 2016 Oct;68(10):2503-13. doi: 10.1002/art.39741. Arthritis Rheumatol. 2016. PMID: 27159270 Free PMC article.
-
Retinoic Acid, Leaky Gut, and Autoimmune Diseases.Nutrients. 2018 Aug 3;10(8):1016. doi: 10.3390/nu10081016. Nutrients. 2018. PMID: 30081517 Free PMC article. Review.
-
Control of lupus nephritis by changes of gut microbiota.Microbiome. 2017 Jul 11;5(1):73. doi: 10.1186/s40168-017-0300-8. Microbiome. 2017. PMID: 28697806 Free PMC article.
References
-
- Mic FA, Molotkov A, Benbrook DM, Duester G. Retinoid activation of retinoic acid receptor but not retinoid X receptor is sufficient to rescue lethal defect in retinoic acid synthesis. Proceedings of the National Academy of Sciences of the United States of America. 2003. Jun 10;100(12):7135–40. - PMC - PubMed
-
- Mucida D, Park Y, Kim G, Turovskaya O, Scott I, Kronenberg M, et al. Reciprocal TH17 and regulatory T cell differentiation mediated by retinoic acid. Science. 2007. Jul 13;317(5835):256–60. - PubMed
MeSH terms
Substances
Grants and funding
LinkOut - more resources
Full Text Sources
Other Literature Sources
Medical
Molecular Biology Databases
