

The CENP-T C-terminus is exclusively proximal to H3.1 and not to H3.2 or H3.3
- PMID: 25775162
- PMCID: PMC4394509
- DOI: 10.3390/ijms16035839
The CENP-T C-terminus is exclusively proximal to H3.1 and not to H3.2 or H3.3
Abstract
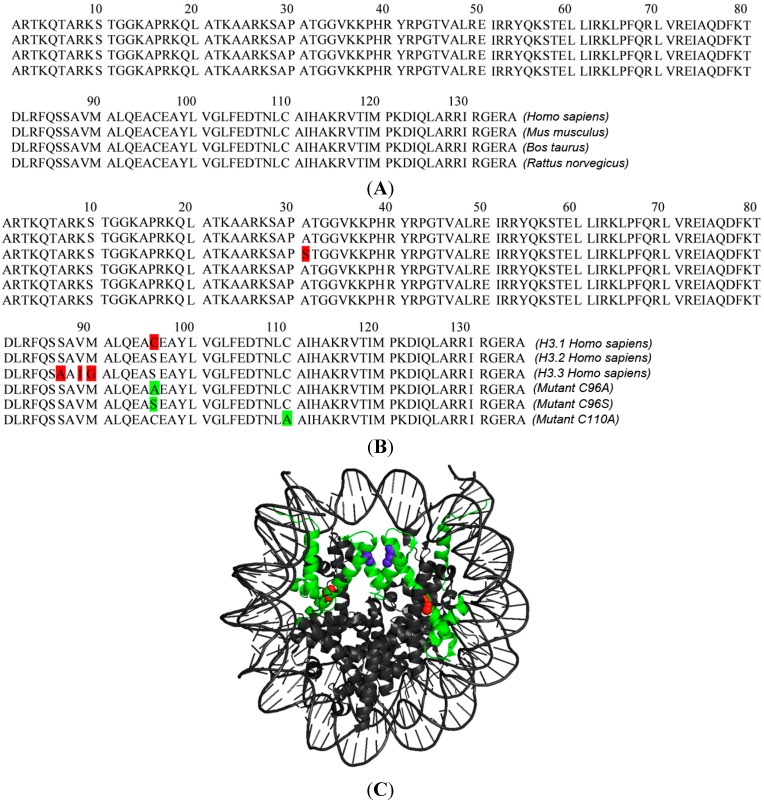
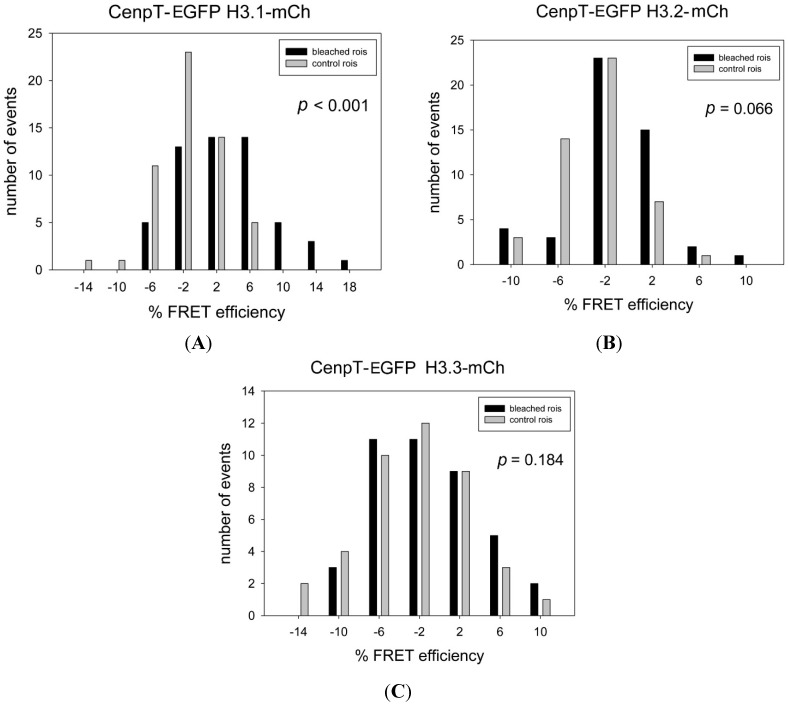
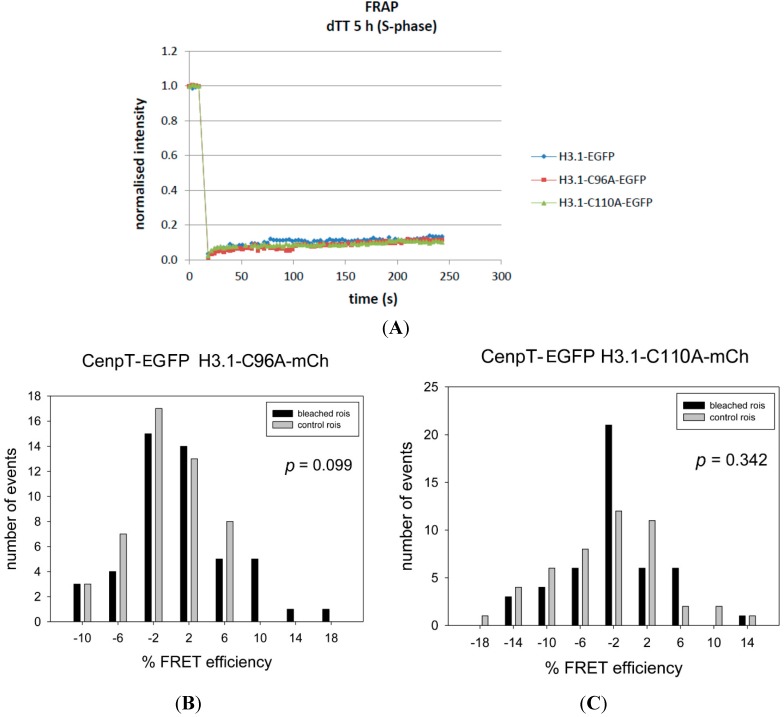
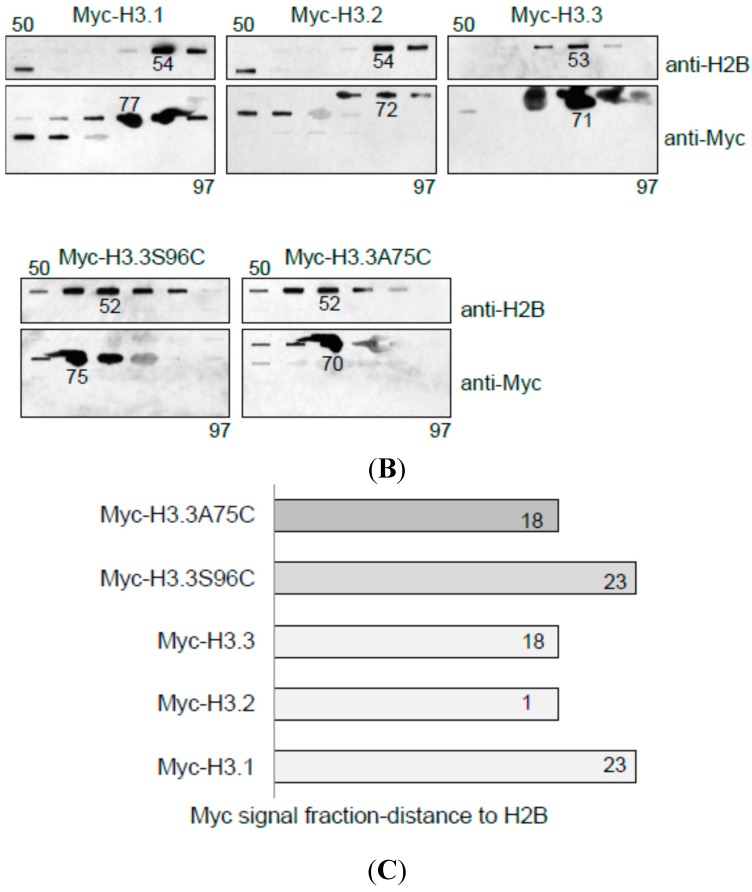
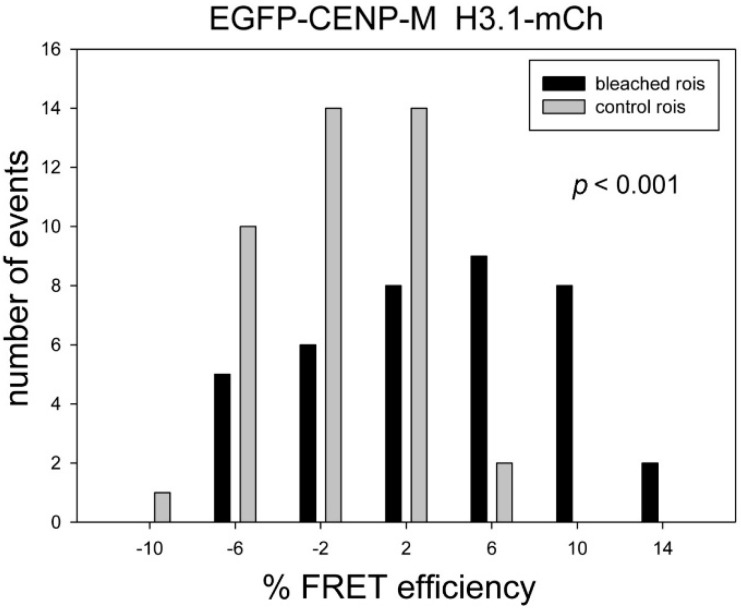
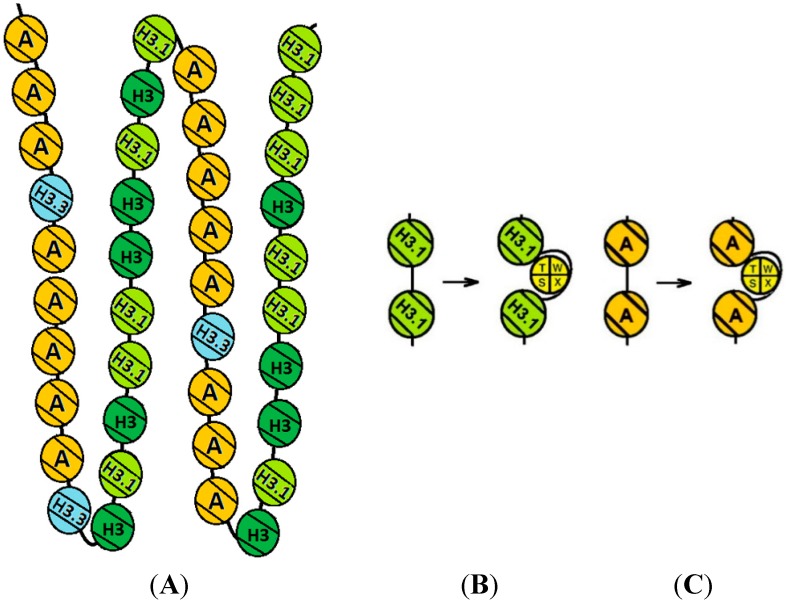
The kinetochore proteins assemble onto centromeric chromatin and regulate DNA segregation during cell division. The inner kinetochore proteins bind centromeres while most outer kinetochore proteins assemble at centromeres during mitosis, connecting the complex to microtubules. The centromere-kinetochore complex contains specific nucleosomes and nucleosomal particles. CENP-A replaces canonical H3 in centromeric nucleosomes, defining centromeric chromatin. Next to CENP-A, the CCAN multi-protein complex settles which contains CENP-T/W/S/X. These four proteins are described to form a nucleosomal particle at centromeres. We had found the CENP-T C-terminus and the CENP-S termini next to histone H3.1 but not to CENP-A, suggesting that the Constitutive Centromere-Associated Network (CCAN) bridges a CENP-A- and a H3-containing nucleosome. Here, we show by in vivo FRET that this proximity between CENP-T and H3 is specific for H3.1 but neither for the H3.1 mutants H3.1(C96A) and H3.1(C110A) nor for H3.2 or H3.3. We also found CENP-M next to H3.1 but not to these H3.1 mutants. Consistently, we detected CENP-M next to CENP-S. These data elucidate the local molecular neighborhood of CCAN proteins next to a H3.1-containing centromeric nucleosome. They also indicate an exclusive position of H3.1 clearly distinct from H3.2, thus documenting a local, and potentially also functional, difference between H3.1 and H3.2.
Figures
Similar articles
-
CCAN makes multiple contacts with centromeric DNA to provide distinct pathways to the outer kinetochore.Cell. 2008 Dec 12;135(6):1039-52. doi: 10.1016/j.cell.2008.10.019. Cell. 2008. PMID: 19070575
-
Formation of a centromere-specific chromatin structure.Epigenetics. 2012 Jul;7(7):672-5. doi: 10.4161/epi.20389. Epub 2012 Jul 1. Epigenetics. 2012. PMID: 22617165
-
Centromere identity maintained by nucleosomes assembled with histone H3 containing the CENP-A targeting domain.Mol Cell. 2007 Jan 26;25(2):309-22. doi: 10.1016/j.molcel.2006.12.018. Mol Cell. 2007. PMID: 17244537
-
Conserved and divergent mechanisms of inner kinetochore assembly onto centromeric chromatin.Curr Opin Struct Biol. 2023 Aug;81:102638. doi: 10.1016/j.sbi.2023.102638. Epub 2023 Jun 20. Curr Opin Struct Biol. 2023. PMID: 37343495 Review.
-
The ABCs of CENPs.Chromosoma. 2011 Oct;120(5):425-46. doi: 10.1007/s00412-011-0330-0. Epub 2011 Jul 13. Chromosoma. 2011. PMID: 21751032 Review.
Cited by
-
Replication-dependent histone isoforms: a new source of complexity in chromatin structure and function.Nucleic Acids Res. 2018 Sep 28;46(17):8665-8678. doi: 10.1093/nar/gky768. Nucleic Acids Res. 2018. PMID: 30165676 Free PMC article. Review.
-
Chromatin dynamics during the cell cycle at centromeres.Nat Rev Genet. 2017 Mar;18(3):192-208. doi: 10.1038/nrg.2016.157. Epub 2017 Jan 31. Nat Rev Genet. 2017. PMID: 28138144 Review.
-
The CENP-T/-W complex is a binding partner of the histone chaperone FACT.Genes Dev. 2016 Jun 1;30(11):1313-26. doi: 10.1101/gad.275073.115. Epub 2016 Jun 9. Genes Dev. 2016. PMID: 27284163 Free PMC article.
References
Publication types
MeSH terms
Substances
LinkOut - more resources
Full Text Sources
Other Literature Sources
