. 2015 Mar 16;10(3):e0118750.
doi: 10.1371/journal.pone.0118750. eCollection 2015.

Differential distribution of Shank and GKAP at the postsynaptic density

Affiliations

Differential distribution of Shank and GKAP at the postsynaptic density

Jung-Hwa Tao-Cheng et al. PLoS One. .

Abstract

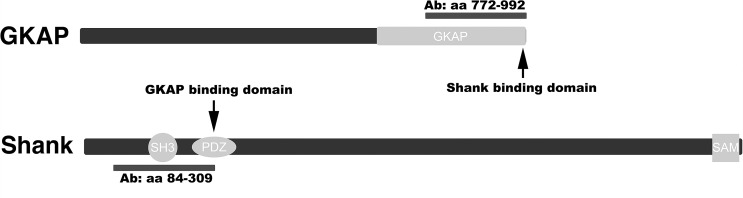
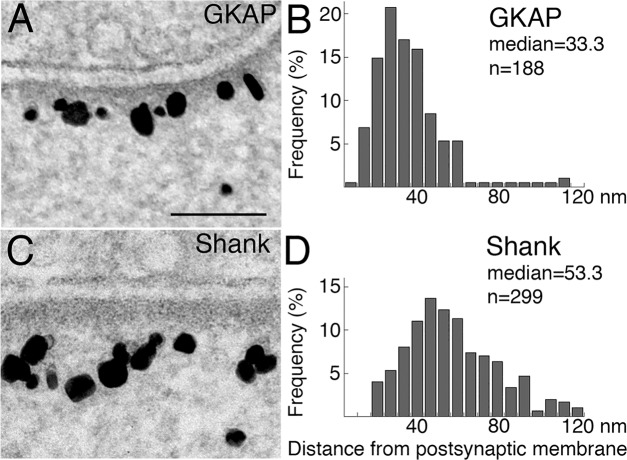
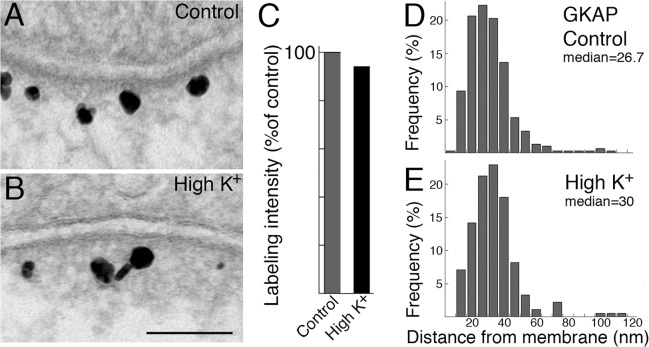
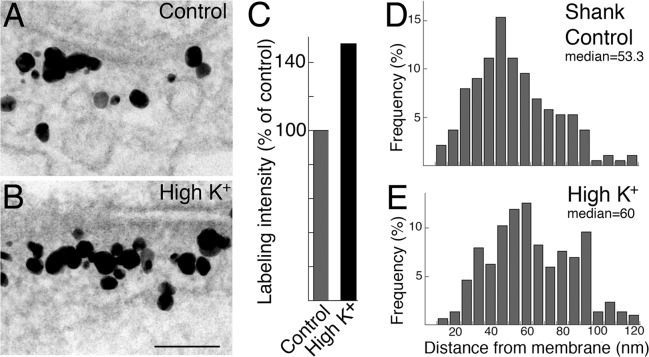
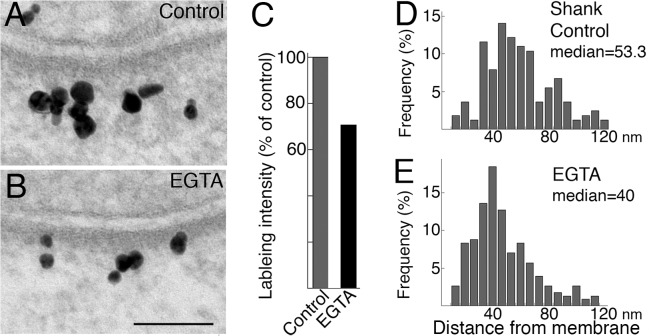
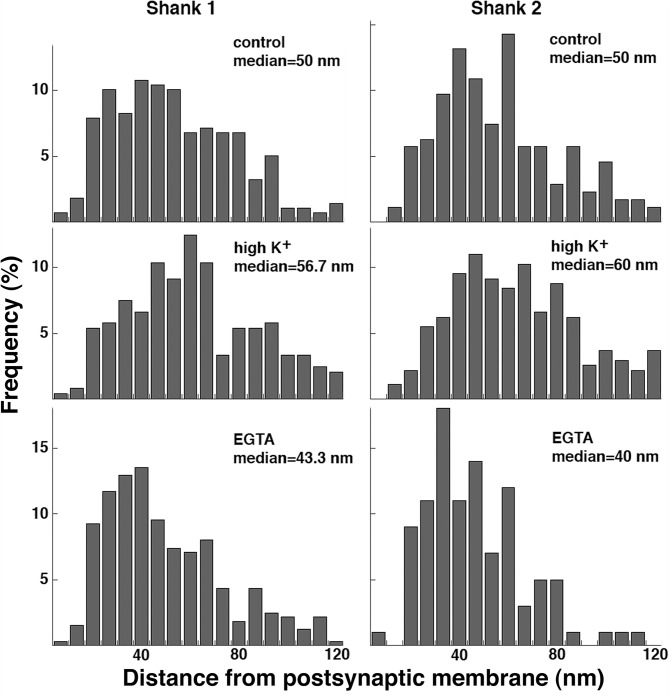
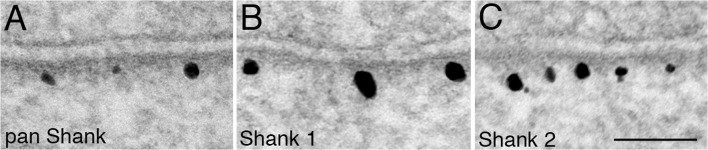
Shank and GKAP are scaffold proteins and binding partners at the postsynaptic density (PSD). The distribution and dynamics of Shank and GKAP were studied in dissociated hippocampal cultures by pre-embedding immunogold electron microscopy. Antibodies against epitopes containing their respective mutual binding sites were used to verify the expected juxtapositioning of Shank and GKAP. If all Shank and GKAP molecules at the PSD were bound to each other, the distribution of label for the two proteins should coincide. However, labels for the mutual binding sites showed significant differences in distribution, with a narrow distribution for GKAP located close to the postsynaptic membrane, and a wider distribution for Shank extending deeper into the cytoplasm. Upon depolarization with high K+, neither the intensity nor distribution of label for GKAP changed, but labeling intensity for Shank at the PSD increased to ~150% of controls while the median distance of label from postsynaptic membrane increased by 7.5 nm. These results indicate a preferential recruitment of Shank to more distal parts of the PSD complex. Conversely, upon incubation in Ca2+-free medium containing EGTA, the labeling intensity of Shank at the PSD decreased to ~70% of controls and the median distance of label from postsynaptic membrane decreased by 9 nm, indicating a preferential loss of Shank molecules in more distal parts of the PSD complex. These observations identify two pools of Shank at the PSD complex, one relatively stable pool, closer to the postsynaptic membrane that can bind to GKAP, and another more dynamic pool at a location too far away to bind to GKAP.


Conflict of interest statement

Competing Interests: The authors have declared that no competing interests exist.

Figures

Fig 1
Fig 1. Epitopes for GKAP and Shank antibodies.
The GKAP antibody used here was raised against a C-terminal peptide (aa 772–992) containing the sequence (last four residues) for its binding site to Shank. The pan Shank antibody was raised against a peptide (aa 84–309) that includes part of the sequence for its PDZ domain (aa 248–342), which is the binding site for GKAP.
Fig 2
Fig 2. Measurements of the intensity of immunogold labeling and distance of gold particles from the postsynaptic membrane.
Electron micrograph of an asymmetric synapse labeled for Shank under basal conditions. Black particles represent silver-enhanced gold particles conjugated to the secondary antibody. Areas of PSDs sampled were delineated by the postsynaptic membrane (membrane between the two black arrows), two parallel lines from the edge of the PSD extending 120 nm into the cytoplasm, and a dashed line marking the lower border at 120 nm. All labels within this area were counted and divided by the length of the PSD to yield the labeling intensity (number of label / μm PSD). Distances between gold particles and the postsynaptic membrane were measured from the center of the particle to the outer edge of the postsynaptic membrane (indicated by the white arrow). Scale bar = 100 nm.
Fig 3
Fig 3. PSDs in cultured hippocampal neurons labeled for GKAP and Shank.
Label for GKAP (A) is closely associated with the dense material at the core of the PSD complex (arrows), while label for Shank (B) is located in a wider area of the PSD complex (arrows) and many of the labels are distal to the dense material lining the postsynaptic membrane. Scale bar = 0.1 μm.
Fig 4
Fig 4. Distributions of label for GKAP and Shank are different at the PSD complex.
Higher magnification EM micrographs show that under basal conditions, label for GKAP is in a narrow band closer to the postsynaptic membrane (A), while label for Shank is located in a wider band in the PSD complex (C). Scale bar = 0.1 μm. Distance measurements of label are plotted in histograms (B for GKAP and D for Shank) showing significant difference in distribution (P< 0.0001, Wilcoxon rank-sum test) with a 20 nm difference in median values.
Fig 5
Fig 5. Distribution of label for GKAP is unchanged upon depolarization with high K+.
Label for GKAP showed similar intensity under control (A) and high K+ (B, 90 mM K+, 2 min) conditions, and label remained located within a narrow band ~20–50 nm from the postsynaptic membrane. Scale bar = 0.1 μm. Labeling intensity in the PSD complex was normalized to control values and graphed in C showing no significant difference after depolarization with high K+. Distance measurements of label were plotted in histograms. The distributions of label for GKAP were similar under control (D) or high K+ (E) conditions.
Fig 6
Fig 6. Label for Shank increased in the distal area of the PSD complex after depolarization with high K+.
Upon depolarization with high K+, labeling intensity with the pan Shank antibody at the PSD increased (B vs. A, Scale bar = 0.1 μm.) to ~150% of control values (C, data from [12]; three experiments, P<0.001, paired t-test). Histograms of distance measurement of label for Shank showed a shift to the right (E vs. D) with an increase in the median distance after high K+ (P<0.005, Wilcoxon rank-sum test).
Fig 7
Fig 7. Label for Shank decreased in the distal area of the PSD complex after EGTA treatment.
After EGTA treatment (5 min), labeling intensity with the pan shank antibody at the PSD decreased (B vs. A, scale bar = 0.1 μm) to ~70% of control values (C, four experiments, P<0.01). Histograms of distance measurements showed a shift to the left with a decrease in median distance after EGTA treatment (E vs. D, P<0.0001, Wilcoxon rank-sum test).
Fig 8
Fig 8. Histograms of distance measurements of labels for Shank 1 and Shank 2 under different experimental conditions.
Sister cultures were labeled with antibodies against either Shank 1 (left) or Shank 2 (right) after identical experimental manipulations and processed in parallel. For each Shank isoform, the differences between control and high K+ or control and EGTA are statistically significant (Wilcoxon ran-sum test; same data set as exp 3 in Table 4).
Fig 9
Fig 9. Under low calcium conditions, a subpopulation of synapses show an atypical labeling pattern for Shank resembling that for GKAP.
In EGTA-treated samples, approximately one in six synapses showed an atypical labeling pattern for Shank, showing a narrow band close to the postsynaptic membrane. This pattern was seen with the three antibodies used here: pan Shank (A), Shank 1 (B), and Shank 2 (C), upon application of EGTA either in the presence (B) or absence of high K+ (A and C). Scale bar = 0.1 μm.

References

    1. Boeckers TM (2006) The postsynaptic density. Cell Tissue Res. 326:409–422. - PubMed
    1. Sheng M, Hoogenraad CC (2007) The postsynaptic architecture of excitatory synapses: a more quantitative view. Annu Rev Biochem. 76:823–847. - PubMed
    1. Sheng M, Kim E (2011) The postsynaptic organization of synapses. Cold Spring Harb Perspect Biol. 3: a005678 10.1101/cshperspect.a005678 - DOI - PMC - PubMed
    1. Verpelli C, Schmeisser MJ, Sala C, Boeckers TM (2012) Scaffold proteins at the postsynaptic density. Adv Exp Med Biol.970:29–61. 10.1007/978-3-7091-0932-8_2 - DOI - PubMed
    1. Naisbitt S, Kim E, Weinberg RJ, Rao A, Yang FC, Craig AM et al. (1997) Characterization of guanylate kinase-associated protein, a postsynaptic density protein at excitatory synapses that interacts directly with postsynaptic density-95/synapse-associated protein 90. J Neurosci. 17:5687–5696. - PMC - PubMed

Publication types