

Two transcription factors, Pou4f2 and Isl1, are sufficient to specify the retinal ganglion cell fate
- PMID: 25775587
- PMCID: PMC4386335
- DOI: 10.1073/pnas.1421535112
Two transcription factors, Pou4f2 and Isl1, are sufficient to specify the retinal ganglion cell fate
Abstract
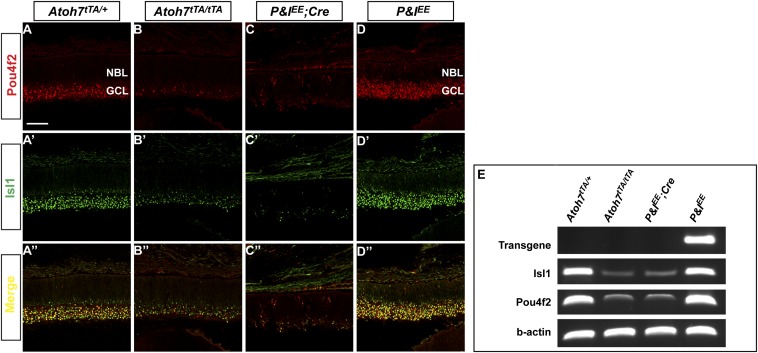
As with other retinal cell types, retinal ganglion cells (RGCs) arise from multipotent retinal progenitor cells (RPCs), and their formation is regulated by a hierarchical gene-regulatory network (GRN). Within this GRN, three transcription factors--atonal homolog 7 (Atoh7), POU domain, class 4, transcription factor 2 (Pou4f2), and insulin gene enhancer protein 1 (Isl1)--occupy key node positions at two different stages of RGC development. Atoh7 is upstream and is required for RPCs to gain competence for an RGC fate, whereas Pou4f2 and Isl1 are downstream and regulate RGC differentiation. However, the genetic and molecular basis for the specification of the RGC fate, a key step in RGC development, remains unclear. Here we report that ectopic expression of Pou4f2 and Isl1 in the Atoh7-null retina using a binary knockin-transgenic system is sufficient for the specification of the RGC fate. The RGCs thus formed are largely normal in gene expression, survive to postnatal stages, and are physiologically functional. Our results indicate that Pou4f2 and Isl1 compose a minimally sufficient regulatory core for the RGC fate. We further conclude that during development a core group of limited transcription factors, including Pou4f2 and Isl1, function downstream of Atoh7 to determine the RGC fate and initiate RGC differentiation.
Keywords: cell fate specification; gene regulation; neural development; retinal development; transcription factors.
Conflict of interest statement
The authors declare no conflict of interest.
Figures


Similar articles
-
Gene regulation logic in retinal ganglion cell development: Isl1 defines a critical branch distinct from but overlapping with Pou4f2.Proc Natl Acad Sci U S A. 2008 May 13;105(19):6942-7. doi: 10.1073/pnas.0802627105. Epub 2008 May 6. Proc Natl Acad Sci U S A. 2008. PMID: 18460603 Free PMC article.
-
Two new genetically modified mouse alleles labeling distinct phases of retinal ganglion cell development by fluorescent proteins.Dev Dyn. 2020 Dec;249(12):1514-1528. doi: 10.1002/dvdy.233. Epub 2020 Aug 28. Dev Dyn. 2020. PMID: 32741043 Free PMC article.
-
Single cell transcriptomics reveals lineage trajectory of retinal ganglion cells in wild-type and Atoh7-null retinas.Nat Commun. 2021 Mar 5;12(1):1465. doi: 10.1038/s41467-021-21704-4. Nat Commun. 2021. PMID: 33674582 Free PMC article.
-
A gene regulatory hierarchy for retinal ganglion cell specification and differentiation.Semin Cell Dev Biol. 2004 Feb;15(1):115-23. doi: 10.1016/j.semcdb.2003.09.009. Semin Cell Dev Biol. 2004. PMID: 15036214 Review.
-
Genetic control of retinal ganglion cell genesis.Cell Mol Life Sci. 2021 May;78(9):4417-4433. doi: 10.1007/s00018-021-03814-w. Epub 2021 Mar 29. Cell Mol Life Sci. 2021. PMID: 33782712 Free PMC article. Review.
Cited by
-
Transitional Progenitors during Vertebrate Retinogenesis.Mol Neurobiol. 2017 Jul;54(5):3565-3576. doi: 10.1007/s12035-016-9899-x. Epub 2016 May 18. Mol Neurobiol. 2017. PMID: 27194297 Review.
-
New Neuronal Subtypes With a "Pre-Pancreatic" Signature in the Sea Urchin Stongylocentrotus purpuratus.Front Endocrinol (Lausanne). 2018 Nov 2;9:650. doi: 10.3389/fendo.2018.00650. eCollection 2018. Front Endocrinol (Lausanne). 2018. PMID: 30450080 Free PMC article.
-
Differentiation of retinal ganglion cells from induced pluripotent stem cells: a review.Int J Ophthalmol. 2019 Jan 18;12(1):152-160. doi: 10.18240/ijo.2019.01.22. eCollection 2019. Int J Ophthalmol. 2019. PMID: 30662854 Free PMC article. Review.
-
SoxC Transcription Factors Promote Contralateral Retinal Ganglion Cell Differentiation and Axon Guidance in the Mouse Visual System.Neuron. 2017 Mar 8;93(5):1110-1125.e5. doi: 10.1016/j.neuron.2017.01.029. Epub 2017 Feb 16. Neuron. 2017. PMID: 28215559 Free PMC article.
-
Pou4f1-Tbr1 transcriptional cascade controls the formation of Jam2-expressing retinal ganglion cells.Front Ophthalmol (Lausanne). 2023;3:1175568. doi: 10.3389/fopht.2023.1175568. Epub 2023 May 18. Front Ophthalmol (Lausanne). 2023. PMID: 38469155 Free PMC article.
References
-
- Wässle H, Boycott BB. Functional architecture of the mammalian retina. Physiol Rev. 1991;71(2):447–480. - PubMed
-
- Young RW. Cell differentiation in the retina of the mouse. Anat Rec. 1985;212(2):199–205. - PubMed
-
- Cepko C. Intrinsically different retinal progenitor cells produce specific types of progeny. Nat Rev Neurosci. 2014;15(9):615–627. - PubMed
Publication types
MeSH terms
Substances
Grants and funding
LinkOut - more resources
Full Text Sources
Other Literature Sources
Molecular Biology Databases
Research Materials
Miscellaneous
