. 2015 Jun 1;35(11):1898-914.
doi: 10.1128/MCB.01398-14. Epub 2015 Mar 16.

H-ras distribution and signaling in plasma membrane microdomains are regulated by acylation and deacylation events

Affiliations

H-ras distribution and signaling in plasma membrane microdomains are regulated by acylation and deacylation events

Lorena Agudo-Ibáñez et al. Mol Cell Biol. .

Erratum in

Abstract

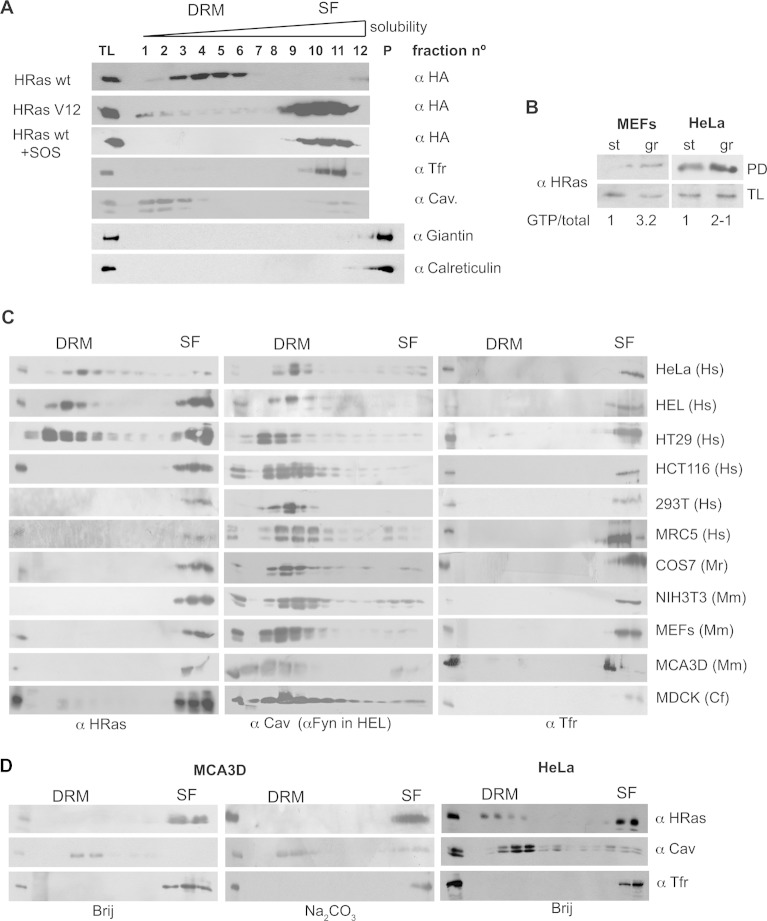
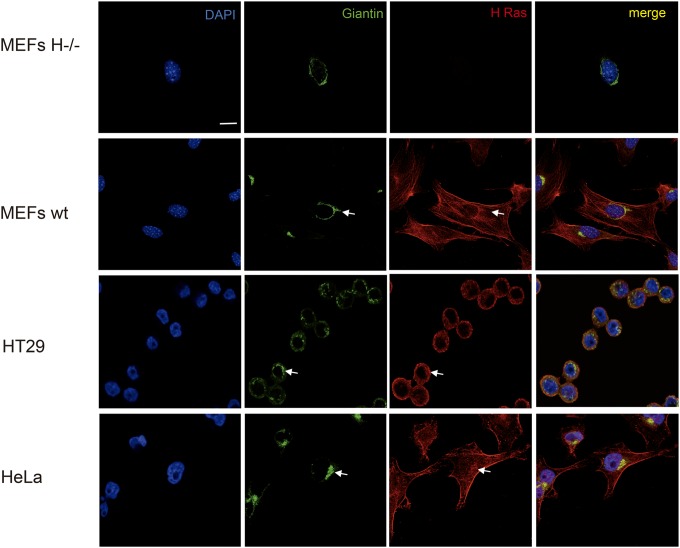
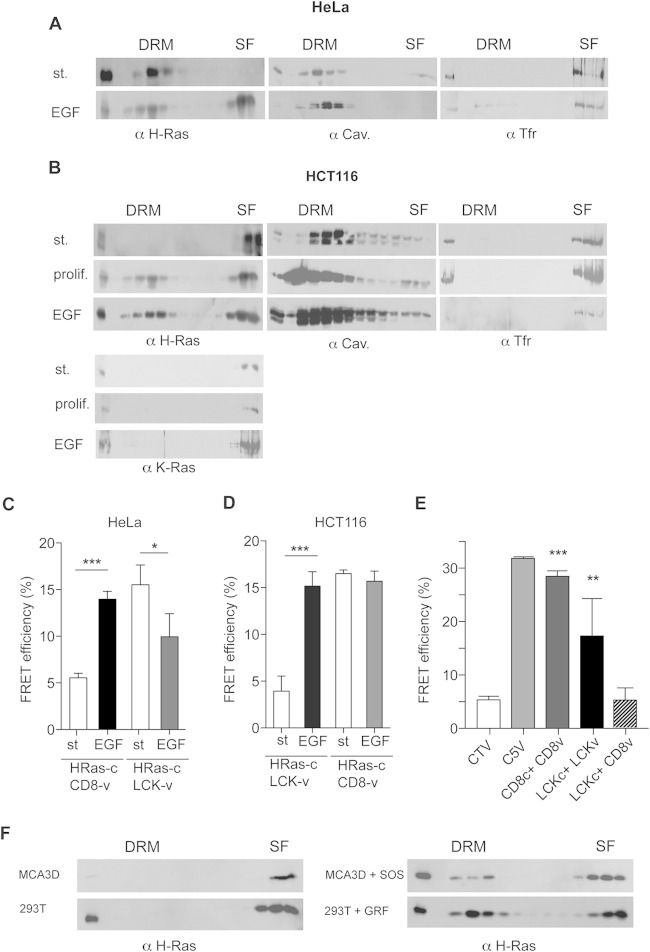
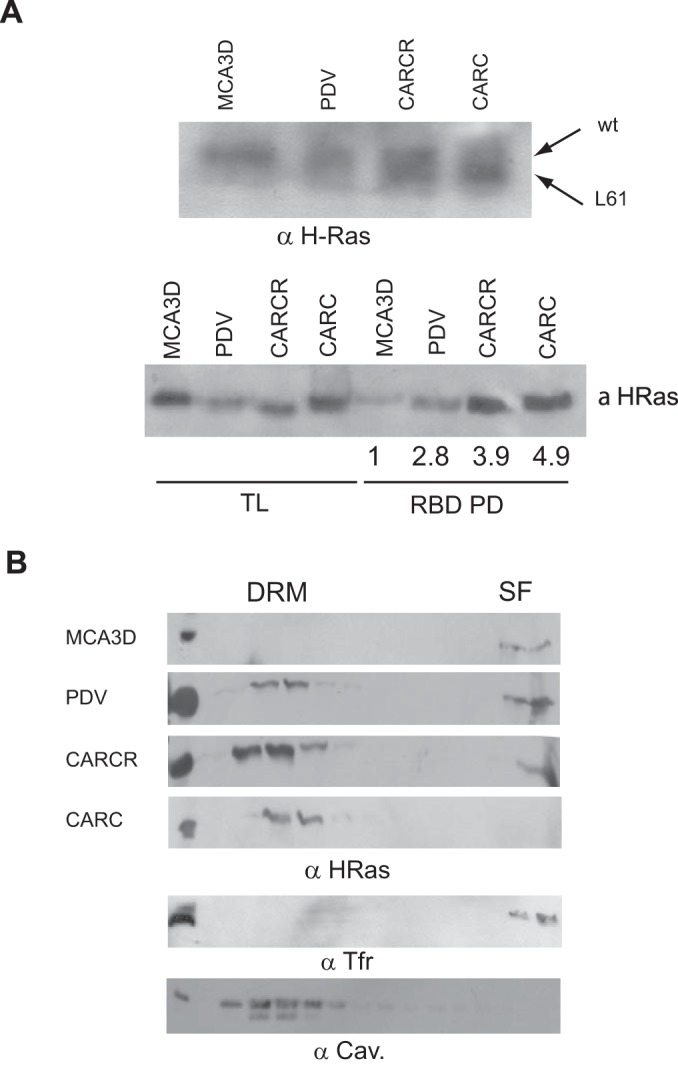
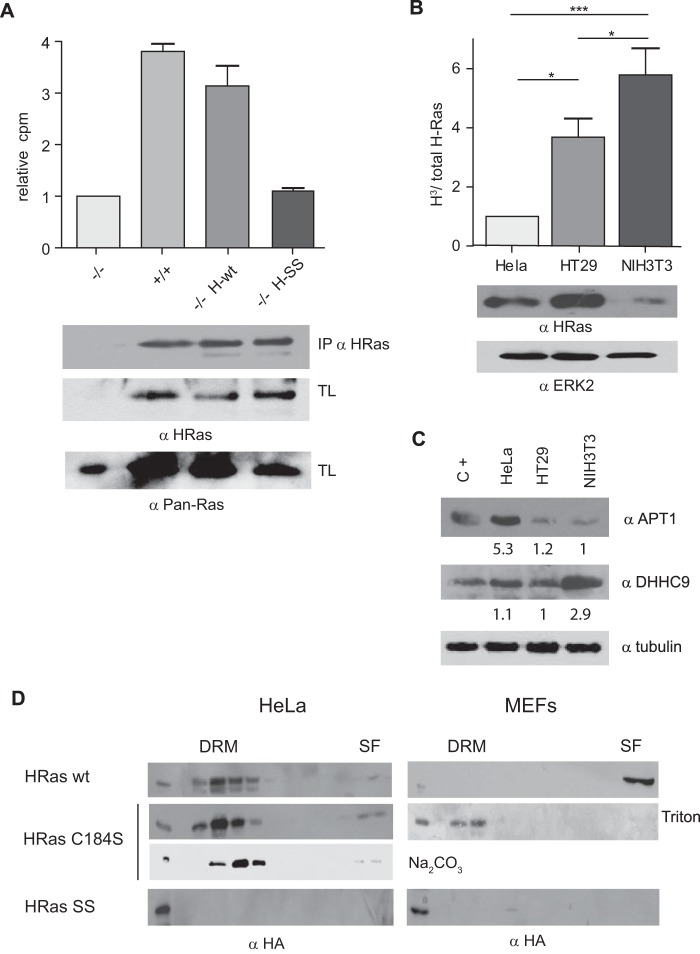
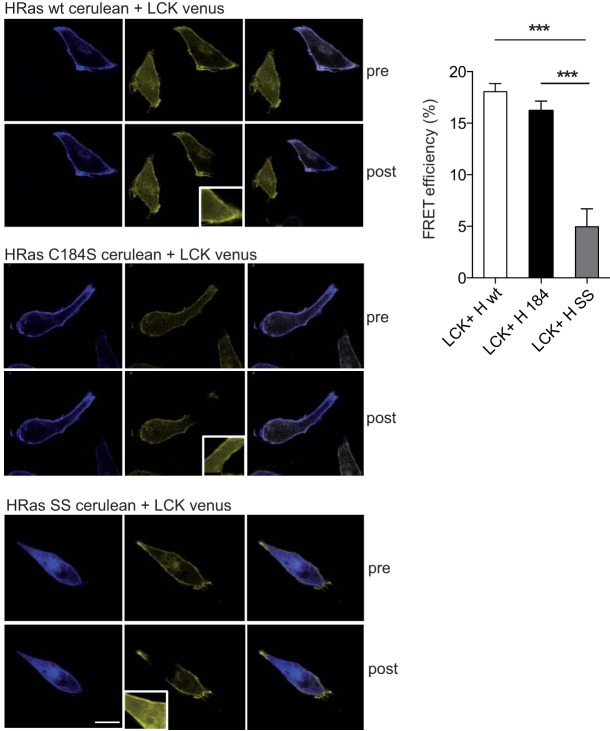
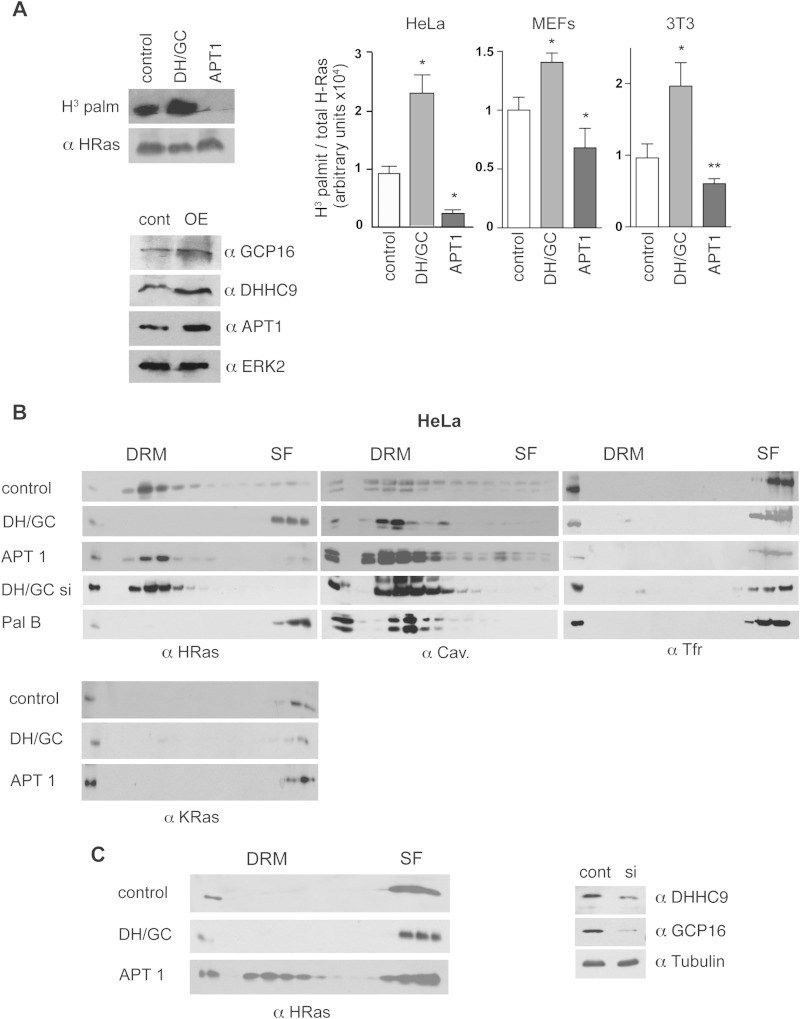
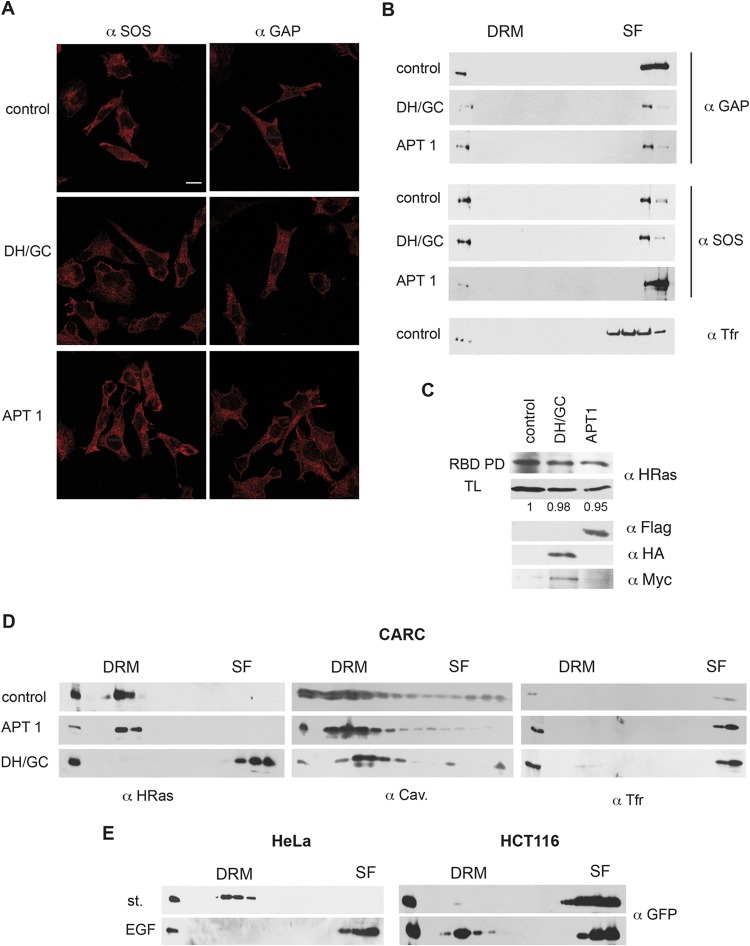
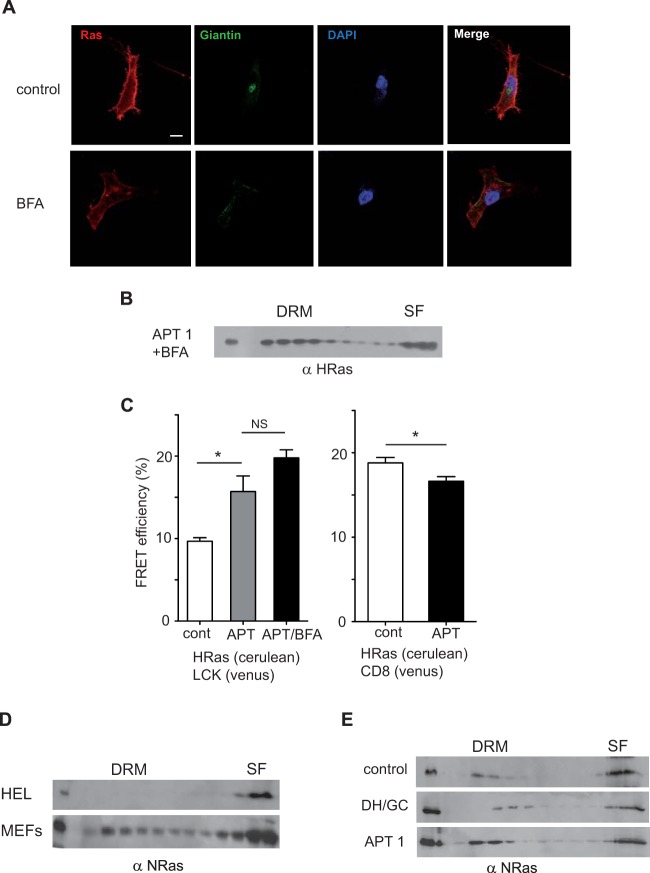
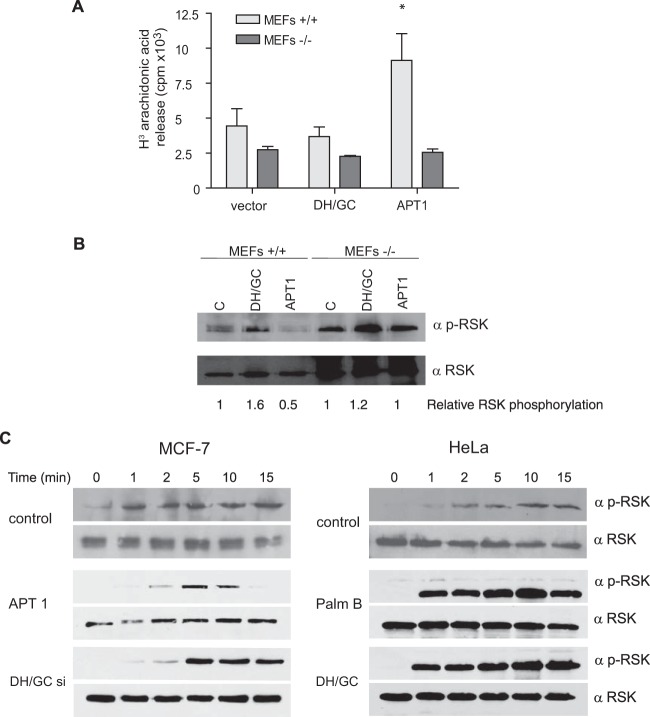
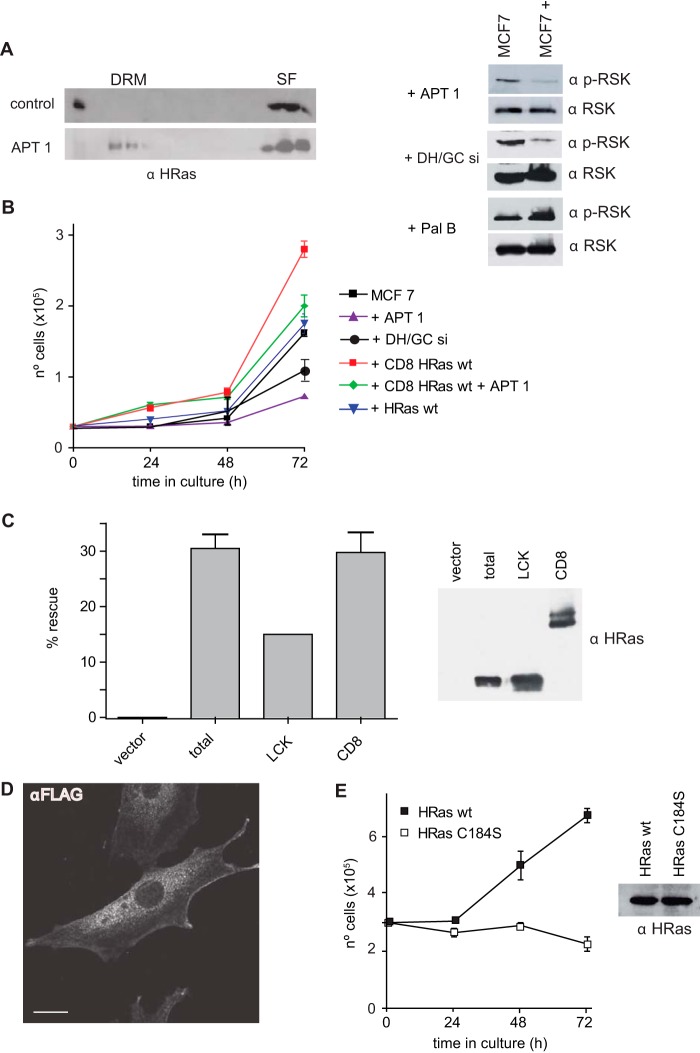
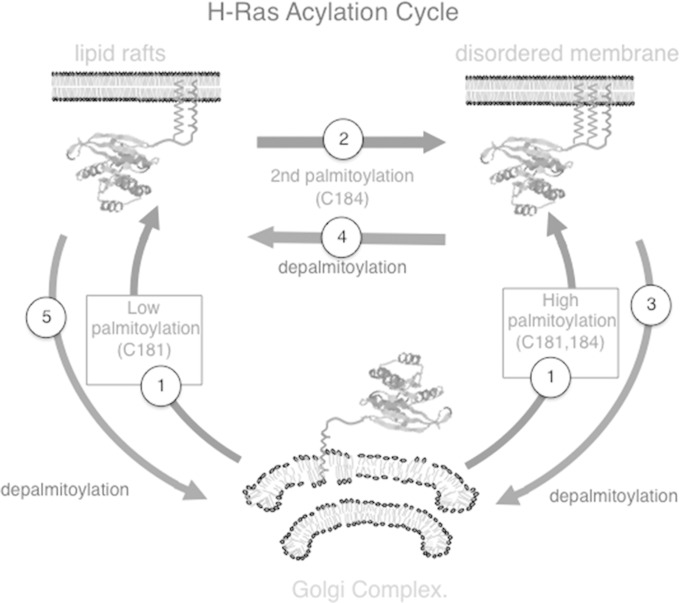
H-Ras must adhere to the plasma membrane to be functional. This is accomplished by posttranslational modifications, including palmitoylation, a reversible process whereby H-Ras traffics between the plasma membrane and the Golgi complex. At the plasma membrane, H-Ras has been proposed to occupy distinct sublocations, depending on its activation status: lipid rafts/detergent-resistant membrane fractions when bound to GDP, diffusing to disordered membrane/soluble fractions in response to GTP loading. Herein, we demonstrate that H-Ras sublocalization is dictated by its degree of palmitoylation in a cell type-specific manner. Whereas H-Ras localizes to detergent-resistant membrane fractions in cells with low palmitoylation activity, it locates to soluble membrane fractions in lineages where it is highly palmitoylated. Interestingly, in both cases GTP loading results in H-Ras diffusing away from its original sublocalization. Moreover, tilting the equilibrium between palmitoylation and depalmitoylation processes can substantially alter H-Ras segregation and, subsequently, its biochemical and biological functions. Thus, the palmitoylation/depalmitoylation balance not only regulates H-Ras cycling between endomembranes and the plasma membrane but also serves as a key orchestrator of H-Ras lateral diffusion between different types of plasma membrane and thereby of H-Ras signaling.


Figures

FIG 1
FIG 1
H-Ras segregation in PM microdomains is cell type specific. (A) PM sublocalization of ectopic forms of H-Ras in BHK cells. Cells were transfected with the indicated HA-tagged Ras constructs (1 μg). Membranes from serum-starved cells were solubilized and fractionated as described in Materials and Methods. Immunoblotting with anti-caveolin-1 (α Cav.) identifies DRMs, and immunoblotting with anti-TFR identifies SFs. Immunoblotting for the GC marker giantin and the ER marker calreticulin ascertained the absence of contamination by endomembranes. A total lysate (TL) was run alongside the fractions. P, pellet. (B) Levels of H-Ras GTP loading under starvation and growing conditions, determined by Raf RBD pulldown (PD). The ratios of H-Ras–GTP/total H-Ras relative to the levels found in starved cells are shown. (C) PM distribution of endogenous H-Ras in different cell lines. Hs, Homo sapiens; Mr, rhesus macaque (Macaca mulatta) Mm, Mus musculus; Cf, Canis familiaris. (D) The H-Ras PM distribution is not affected by alternative processing methods: by solubilization at 37°C using Brij or by the detergent-free Na2CO3 method.
FIG 2
FIG 2
Endogenous H-Ras subcellular localization. Immunofluorescence shows endogenous H-Ras subcellular localization in the indicated cell lines. DAPI (4′,6-diamidino-2-phenylindole) staining shows nuclei, and GC is revealed using antigiantin antibodies. Confocal sections at the level of the nuclei are shown. Arrows show the presence of H-Ras at the GC. Bar, 10 μm.
FIG 3
FIG 3
H-Ras–GDP and H-Ras–GTP occupy different PM microdomains. (A) Endogenous H-Ras localization at DRMs and SFs in serum-starved or EGF-stimulated (st.; 100 ng/ml, 10 min) HeLa cells. (B) As described in the legend to panel A, the distribution of endogenous H-Ras and K-Ras was analyzed in HCT116 cells, including proliferating cells (prolif.). (C and D) Effects of EGF on H-Ras sublocalization in HeLa (C) and HCT116 (D) cells analyzed by FRET. H-Ras–Cerulean was tested against the probes specific for DRMs (LCK-Venus [LCK-v]) and SFs (Venus-CD8 [CD8-v]). (E) Controls for the site-specific FRET probes CD8 and LCK. Cells transfected with control plasmids show minimum (CTV) and maximum (C5V) FRET efficiencies. Results show the mean ± SEM from at least five experiments. **, P < 0.01 with 95% confidence intervals; ***, P < 0.001 with 95% confidence intervals. LCKc, LCK-Cerulean. (F) Endogenous H-Ras distribution in MCA3D and HEK293T cells stably expressing the exchange factors SOS1 (SOS) and RasGRF1 (GRF). Cells were serum starved overnight before processing.
FIG 4
FIG 4
Differential PM segregation of H-Ras oncogenic forms. (A) Presence of oncogenic and wt H-Ras forms in epithelial cells. (Top) The presence of wt H-Ras and H-RasL61 is distinguished by differential mobility in high-concentration SDS-polyacrylamide gels; (bottom) the presence of H-Ras–GTP was analyzed by Raf-RBD pulldown. H-Ras–GTP/total H-Ras levels relative to those in MCA3D cells are presented beneath the gel. (B) H-Ras distribution in epithelial cells displaying different H-Ras genotypes.
FIG 5
FIG 5
Variability in H-Ras acylation levels in different cell types. (A) (Top) Validation of the method used to measure endogenous H-Ras palmitoylation by analysis of the levels of H-Ras palmitoylation in wild-type MEFs (+/+), H-Ras knockout MEFs (−/−), or H-Ras knockout MEFs reconstituted with ectopic H-Ras wt (−/− H-wt) or the unpalmitoylatable H-Ras C181/184S mutant (−/− H-SS). Palmitate incorporation was measured in anti-H-Ras immunoprecipitates from cells incubated with [3H]palmitic acid by scintillation counting. (Bottom) H-Ras expression in immunoprecipitates (IPs). (B) (Top) Determination of H-Ras palmitoylation levels in the indicated cell lines. Results show the levels of H-Ras into which [3H]palmitate was incorporated (H3)/total H-Ras levels relative to the values in HeLa cells. (Bottom) H-Ras protein expression. Protein levels were equalized by the Bradford assay. (A and B) Results show the average ± SEM from at least five experiments. *, P < 0.05 with 95% confidence intervals; ***, P < 0.001 with 95% confidence intervals. (C) APT-1 and DHHC9 expression in lysates from the indicated cells line determined by immunoblotting. Protein levels were equalized by the Bradford assay. C+, positive control consisting of HEK293T cells overexpressing the corresponding proteins. The corresponding protein levels relative to the lowest level are indicated. (D) Partitioning of monopalmitoylated H-Ras in HeLa cells and MEFs. Cells were transfected with HA-tagged wt, C181S mutant, and C181/184S mutant (SS) H-Ras (1 μg). Triton X-100-solubilized membranes were fractionated in sucrose gradients. Where indicated, HeLa cells were fractionated using the detergent-free Na2CO3 method.
FIG 6
FIG 6
PM sublocalization of palmitoylation-defective Ras proteins. (Left) Representative FRET micrographs prebleaching (pre) and postbleaching (post) of HeLa cells transfected with wild-type (H wt), monopalmitoylated C184S mutant (H 184), and unpalmitoylated C181/184S (H SS) H-Ras–Cerulean constructs, in addition to the DRM-specific FRET probe LCK-Venus. (Insets) Bleached area. Bar, 10 μm. (Right) Quantitation of FRET efficiencies. Results show the mean ± SEM from at least five experiments. ***, P < 0.001 with 95% confidence intervals.
FIG 7
FIG 7
Acylation/deacylation balance determines H-Ras PM distribution. (A) (Left, top) Effects of the overexpression of APT-1 and DHHC9/GCP16 (1 μg) on H-Ras palmitoylation levels in NIH 3T3 cells. The blots show the levels of H-Ras into which [3H]palmitate (H3 palm and H3 palmit) was incorporated and total H-Ras in anti-H-Ras immunoprecipitates. (Left, bottom) Levels of AT and PAT expression in control and H-Ras-overexpressing (OE) NIH 3T3 cells. (Right) Quantification of H-Ras palmitoylation levels in the indicated cell lines. Bars show the average ± SEM from three independent experiments. *, P < 0.05 with 95% confidence intervals; **, P < 0.005 with 95% confidence intervals. (B) Distribution of endogenous H-Ras and K-Ras analyzed in serum-starved HeLa cells transfected with APT-1 and DHHC9/GCP16. (C) (Left) The distribution of endogenous H-Ras analyzed in MEFs was determined as described in the legend to panel B. (Right) Levels of AT and PAT expression in control and siRNA-transfected HeLa cells. DH/GC, DHHC9/GCP16; cont, control; DH/GC si, siRNA against DHHC9/GCP16; Pal B, palmostatin B, si, siRNA.
FIG 8
FIG 8
Acylation/deacylation-dependent translocation is unaffected by H-Ras activation status. (A) Immunofluorescence showing SOS1 and p120 GAP subcellular localization in HeLa cells transfected with APT-1 or DHHC9/GCP16 (1 μg). Confocal sections at the level of the nuclei are shown. Bar, 10 μm. (B) SOS1 and p120 GAP distribution in PM sublocations in HeLa cells. (C) H-Ras GTP levels are unaltered in HeLa cells overexpressing APT-1 and DHHC9/GCP16. H-Ras–GTP/total H-Ras levels relative to those in control cells in a representative experiment are shown. (D) Acylation/deacylation-dependent translocation of activated H-Ras. Migration of endogenous H-RasL61 was monitored in CARC cells transfected with APT-1 or DHHC9/GCP16. (E) The H-Ras C terminus regulates translocation between microdomains. GFP–H-RasCT was transfected (1 μg) into the indicated cell lines, and translocation was monitored upon EGF stimulation (100 ng/ml, 10 min).
FIG 9
FIG 9
The H-Ras shift between PM microdomains does not require a functional GC. (A) Effects of BFA on the GC and on H-Ras sublocalization. The immunofluorescence of endogenous H-Ras subcellular localization in control MEFs and MEFs treated with BFA (100 μM, 1 h) is shown. DAPI staining shows nuclei, and GC is revealed using antigiantin antibodies. Confocal sections at the level of the nuclei are shown. Bar, 10 μm. (B) BFA treatment does not impede the H-Ras shift induced by APT-1 overexpression. Figure 7C shows the results for the control not treated with BFA. (C) FRET analyses of the effects of BFA on APT-1-induced H-Ras PM sublocalization in MEFs. Results show the mean ± SEM from at least five experiments. *, P < 0.05; NS, not significant. (D) Distribution of N-Ras in serum-starved cells. (E) The distribution of N-Ras in MEFs is unaffected by the overexpression of APT-1 and DHHC9/GCP16.
FIG 10
FIG 10
H-Ras effector usage is affected by alterations in the acylation/deacylation balance. (A) Effects of the overexpression of ATs and PATs (1 μg) on the activation of cPLA2 by H-Ras. 3H-labeled arachidonic acid release was measured in wild-type MEFs (MEFs +/+) or H-Ras knockout MEFs (MEFs −/−). Bars show the average ± SEM from three independent experiments. *, P < 0.05 with 95% confidence intervals. (B) Effects on H-Ras-mediated activation of RSK-1. RSK-1 phosphorylation levels relative to those in control cells are shown. C, control. (C) Time course of RSK-1 activation in HeLa and MCF-7 cells stimulated with EGF (100 ng/ml) for the indicated times. Where shown, H-Ras acylation/deacylation was altered by overexpression or downregulation (with siRNA) of the indicated proteins or by treatment with palmostatin B (1 μM, 80 min).
FIG 11
FIG 11
H-Ras biological outputs are affected by alterations in its sublocalization. (A) The overexpression of APT-1 in MCF-7 cells alters H-Ras microlocalization and effector usage. (Left) Distribution of endogenous H-Ras; (right) effects on the phosphorylation of RSK-1 of H-Ras acylation/deacylation altered by overexpression or downregulation (with siRNA) of the indicated proteins or by treatment with palmostatin B (1 μM, 80 min). (B) Proliferation rate of MCF-7 cell lines expressing the indicated constructs. Data show the average ± SEM from three independent experiments. (C) (Left) Divergence in ability of H-Ras at DRMs and SFs to rescue the viability of Ras-less MEFs. Cells were transfected with the indicated constructs. At 10 days after addition of 4-OHT (600 nM) to delete endogenous K-Ras, the colonies were scored. Results show the proportion of colonies in 4-OHT-treated cells relative to that in untreated cells, expressed as a percentage (average ± SEM from five independent experiments). (Right) Expression of the different H-Ras constructs. (D) FLAG–H-Ras C184S localizes at the PM in serum-starved Ras-less MEFs. A confocal section at the level of the nucleus is shown. Bar, 10 μm. (E) H-Ras C184S cannot rescue the viability of Ras-less MEFs. Cells stably expressing H-Ras wt or the H-Ras C184S mutant were treated for 10 days with 4-OHT, trypsinized, and replated, and proliferation was scored every 24 h. Data show the average ± SEM from three independent experiments.
FIG 12
FIG 12
A new model for the H-Ras acylation cycle. A detailed explanation of each of the steps depicted in this new model can be found in the Discussion.

References

    1. Malumbres M, Barbacid M. 2003. RAS oncogenes: the first 30 years. Nat Rev Cancer 3:459–465. doi:10.1038/nrc1097. - DOI - PubMed
    1. Arozarena I, Calvo F, Crespo P. 2011. Ras, an actor on many stages: posttranslational modifications, localization, and site-specified events. Genes Cancer 2:182–194. doi:10.1177/1947601911409213. - DOI - PMC - PubMed
    1. Ahearn IM, Haigis K, Bar-Sagi D, Philips MR. 2012. Regulating the regulator: post-translational modification of RAS. Nat Rev Mol Cell Biol 13:39–51. doi:10.1038/nrm3255. - DOI - PMC - PubMed
    1. Swarthout JT, Lobo S, Farh L, Croke MR, Greentree WK, Deschenes RJ, Linder ME. 2005. DHHC9 and GCP16 constitute a human protein fatty acyltransferase with specificity for H- and N-Ras. J Biol Chem 280:31141–31148. doi:10.1074/jbc.M504113200. - DOI - PubMed
    1. Mitchell DA, Vasudevan A, Linder ME, Deschenes RJ. 2006. Protein palmitoylation by a family of DHHC protein S-acyltransferases. J Lipid Res 47:1118–1127. doi:10.1194/jlr.R600007-JLR200. - DOI - PubMed

Publication types

Substances

LinkOut - more resources