

Comparing methods of measuring geographic patterns in temporal trends: an application to county-level heart disease mortality in the United States, 1973 to 2010
- PMID: 25776848
- PMCID: PMC4397179
- DOI: 10.1016/j.annepidem.2015.02.007
Comparing methods of measuring geographic patterns in temporal trends: an application to county-level heart disease mortality in the United States, 1973 to 2010
Abstract
Purpose: To demonstrate the implications of choosing analytical methods for quantifying spatiotemporal trends, we compare the assumptions, implementation, and outcomes of popular methods using county-level heart disease mortality in the United States between 1973 and 2010.
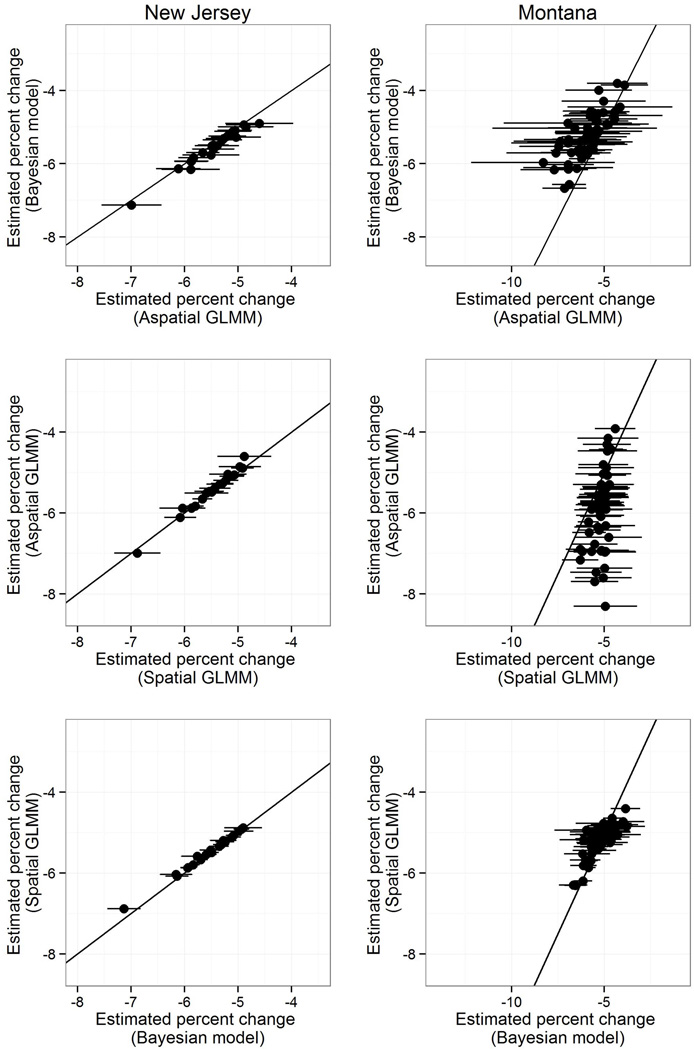
Methods: We applied four regression-based approaches (joinpoint regression, both aspatial and spatial generalized linear mixed models, and Bayesian space-time model) and compared resulting inferences for geographic patterns of local estimates of annual percent change and associated uncertainty.
Results: The average local percent change in heart disease mortality from each method was -4.5%, with the Bayesian model having the smallest range of values. The associated uncertainty in percent change differed markedly across the methods, with the Bayesian space-time model producing the narrowest range of variance (0.0-0.8). The geographic pattern of percent change was consistent across methods with smaller declines in the South Central United States and larger declines in the Northeast and Midwest. However, the geographic patterns of uncertainty differed markedly between methods.
Conclusions: The similarity of results, including geographic patterns, for magnitude of percent change across these methods validates the underlying spatial pattern of declines in heart disease mortality. However, marked differences in degree of uncertainty indicate that Bayesian modeling offers substantially more precise estimates.
Keywords: Bayesian methods; Generalized linear mixed models; Geographic patterns; Heart disease mortality; Joinpoint regression; Spatial analysis; Spatiotemporal trends.
Copyright © 2015 Elsevier Inc. All rights reserved.
Figures


References
-
- Centers for Disease Control and Prevention. Achievements in Public Health, 1900–1999: Decline in Deaths from Heart Disease and Stroke - United States, 1900–1999. MMWR. 1999;48(30):649–656. - PubMed
-
- Miniño A. Death in the United States, 2009. NCHS Data Brief. 2011;64:1–8. - PubMed
-
- Ingram D, Gillum R. Regional and urbanization differentials in coronary heart disease mortality in the United States, 1968–1985. Journal of Clinical Epidemiology. 1989;42(9):857–868. - PubMed
-
- Kleinman J, DeGruttola V, Cohen B, Madans J. Regional and urban-suburban differentials in coronary heart disease mortality and risk factor prevalence. Journal of Chronic Diseases. 1981;34(1):11–19. - PubMed
Publication types
MeSH terms
Grants and funding
LinkOut - more resources
Full Text Sources
Other Literature Sources
Medical
