. 2015 Apr 24;290(17):11144-66.
doi: 10.1074/jbc.M115.638320. Epub 2015 Mar 16.

The Radical S-Adenosyl-L-methionine Enzyme QhpD Catalyzes Sequential Formation of Intra-protein Sulfur-to-Methylene Carbon Thioether Bonds

Affiliations

The Radical S-Adenosyl-L-methionine Enzyme QhpD Catalyzes Sequential Formation of Intra-protein Sulfur-to-Methylene Carbon Thioether Bonds

Tadashi Nakai et al. J Biol Chem. .

Abstract

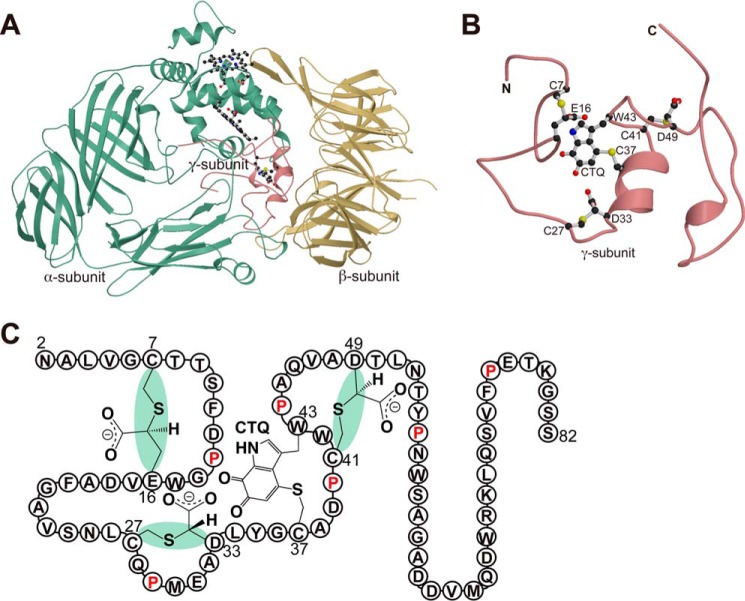
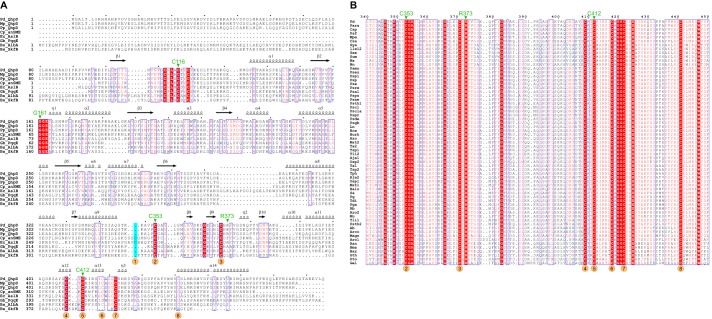
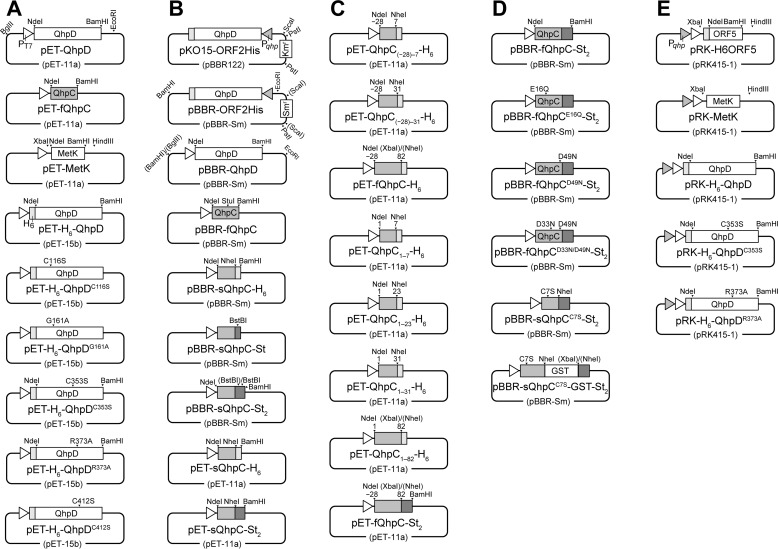
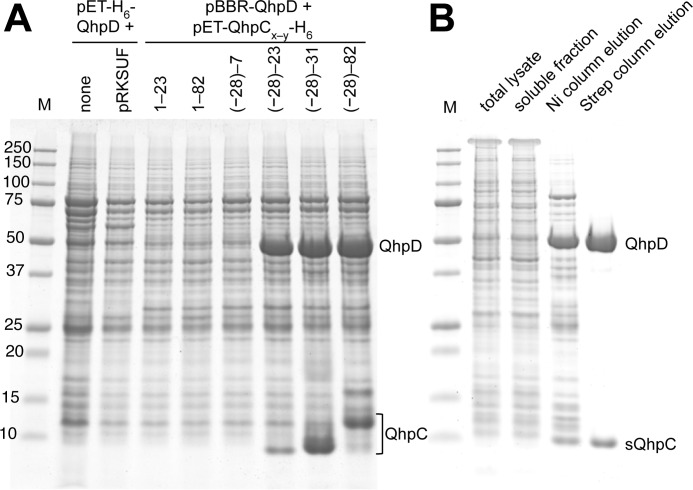
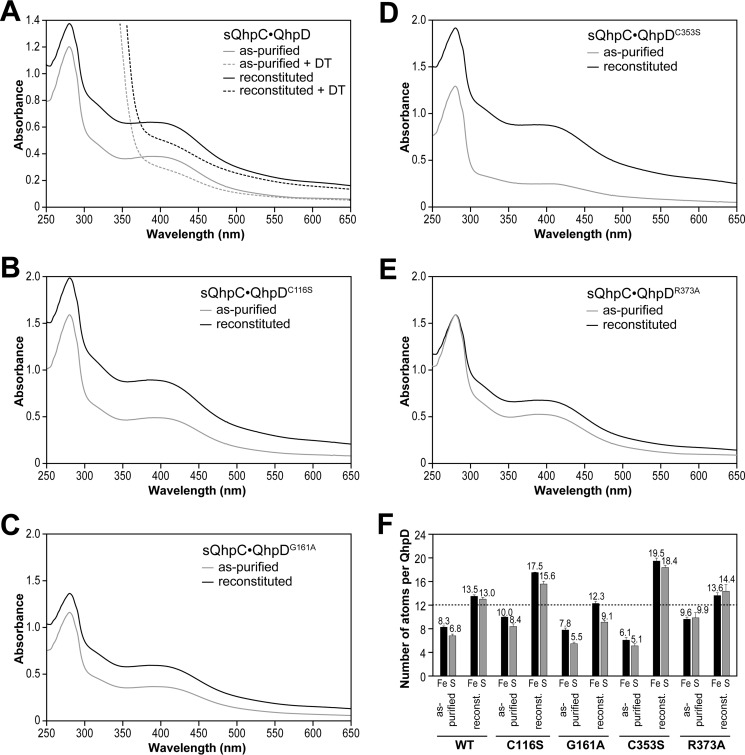
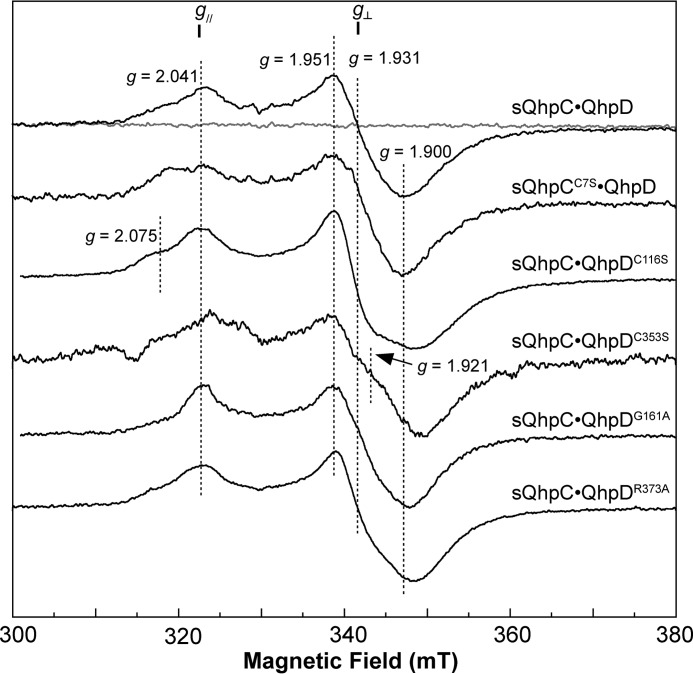
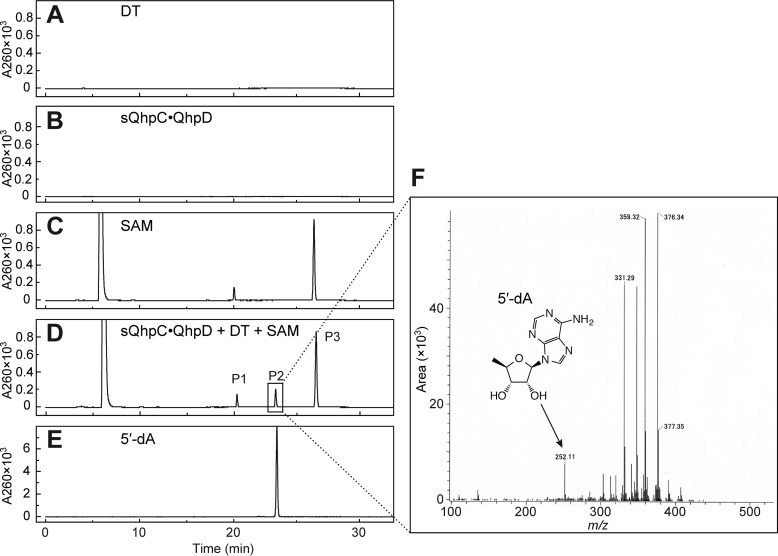
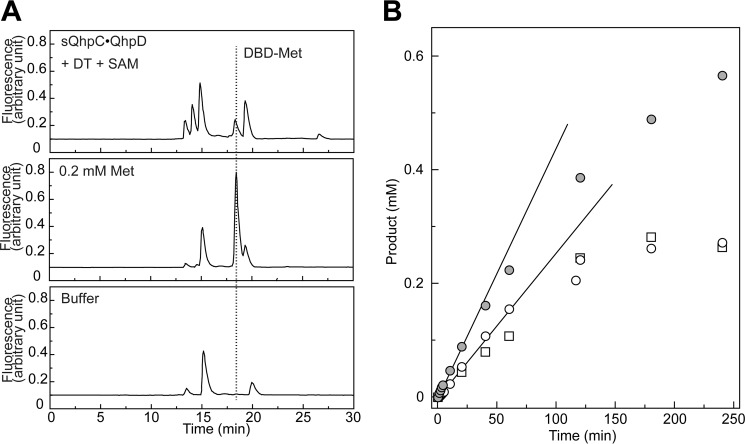
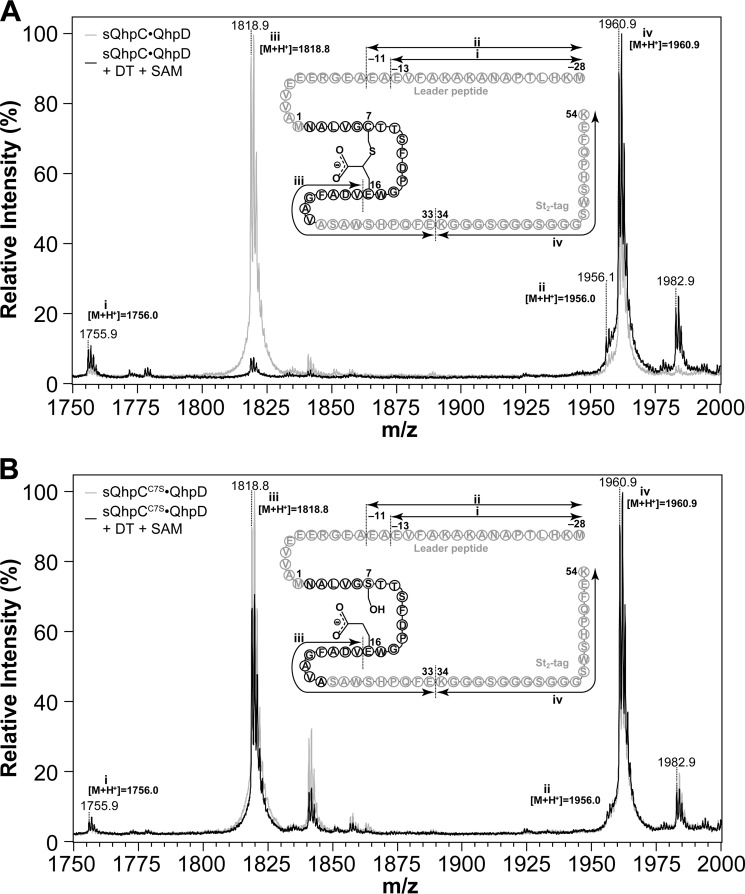
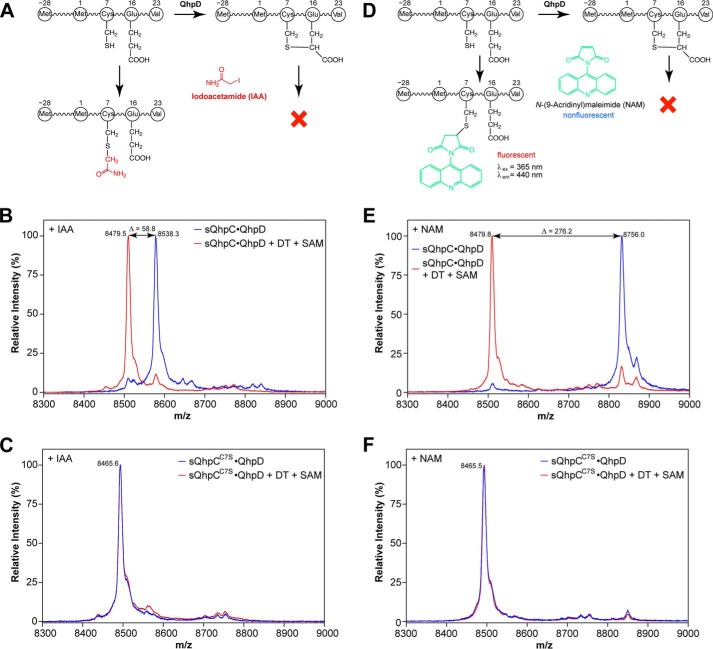
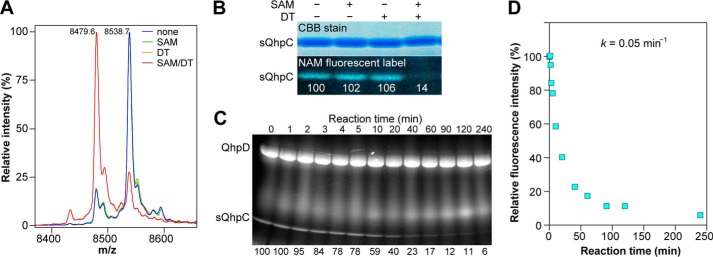
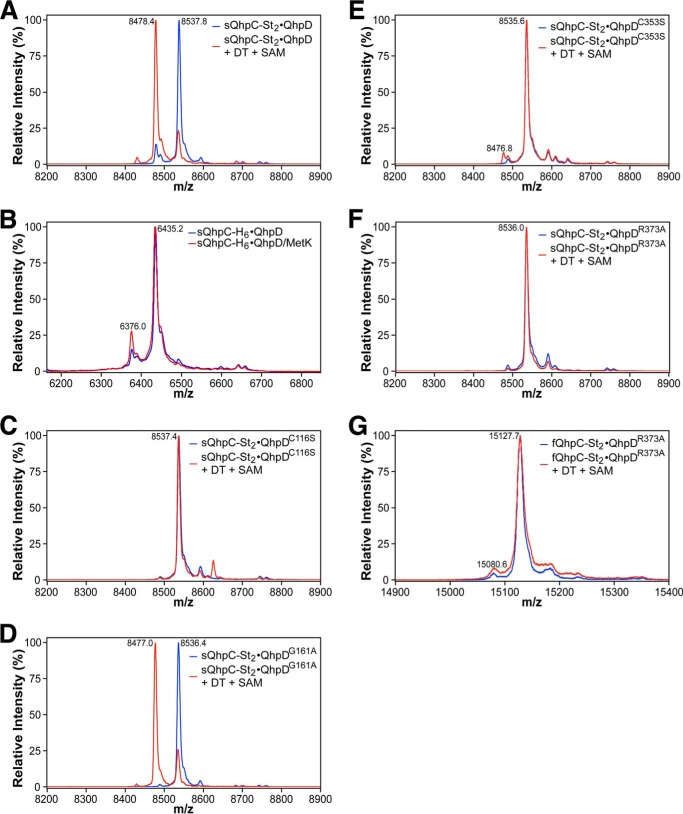
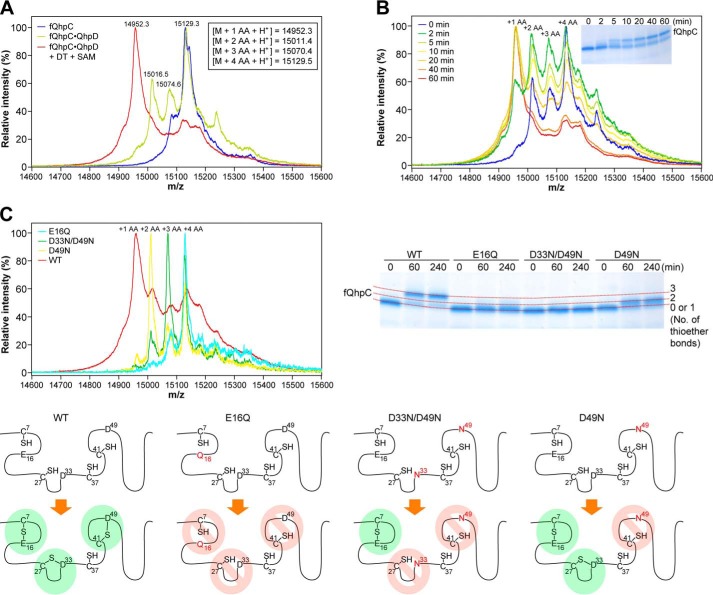
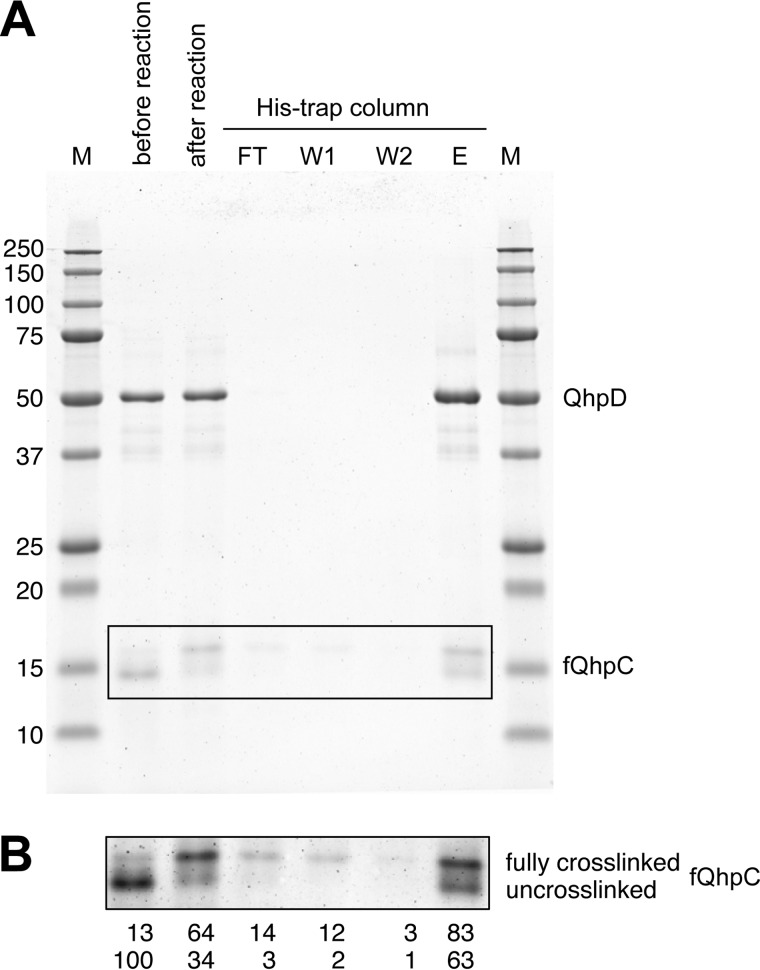
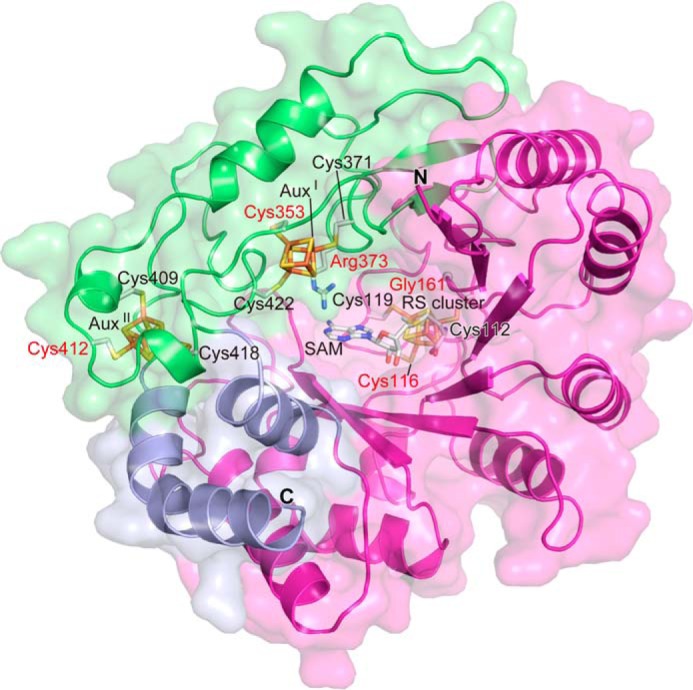
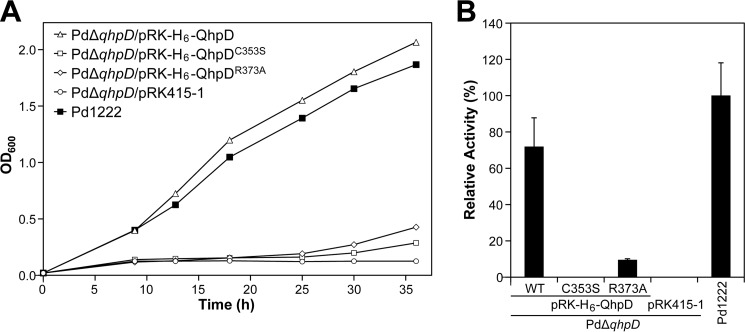
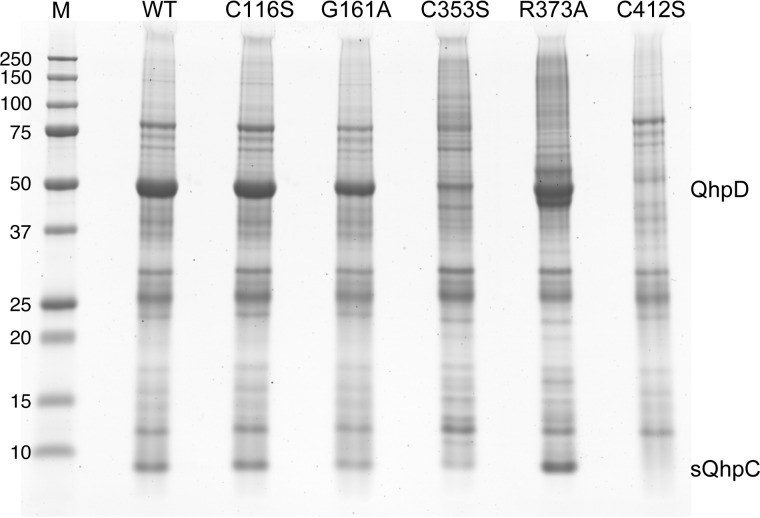
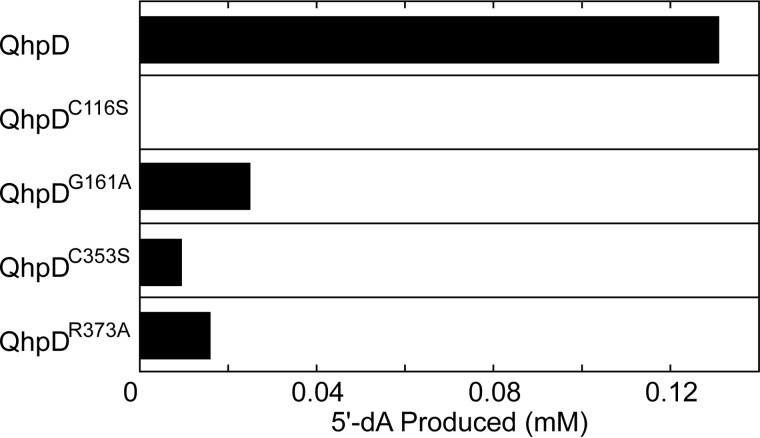
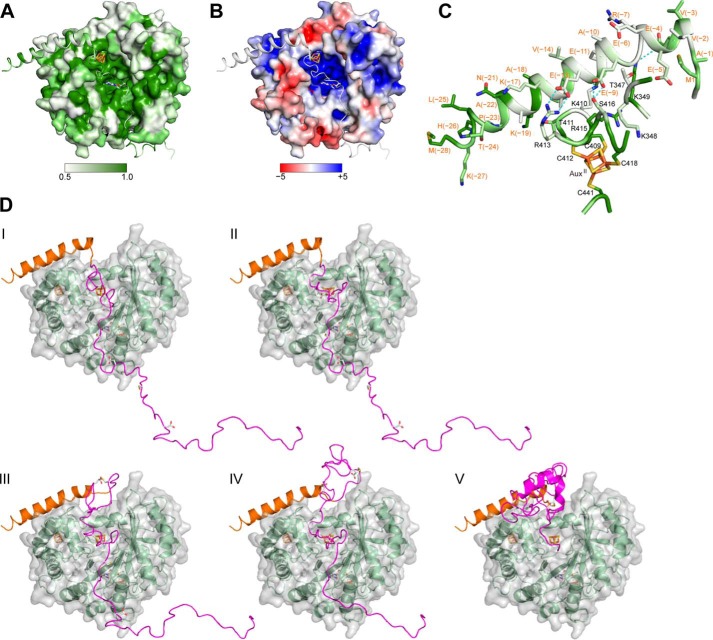
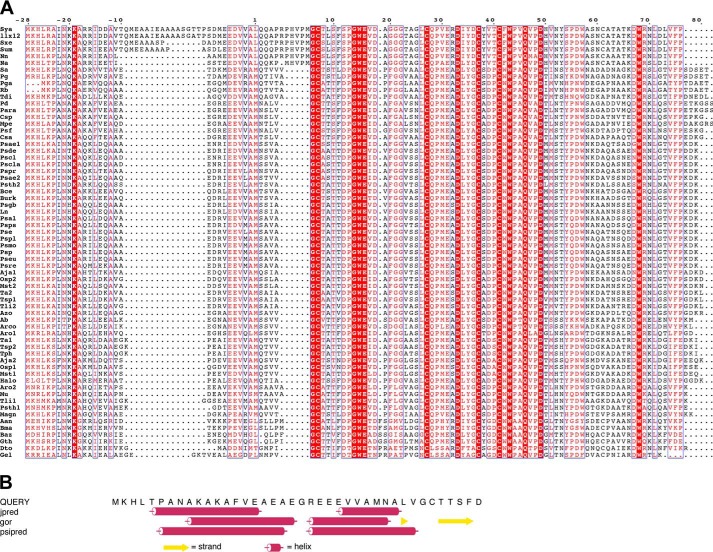
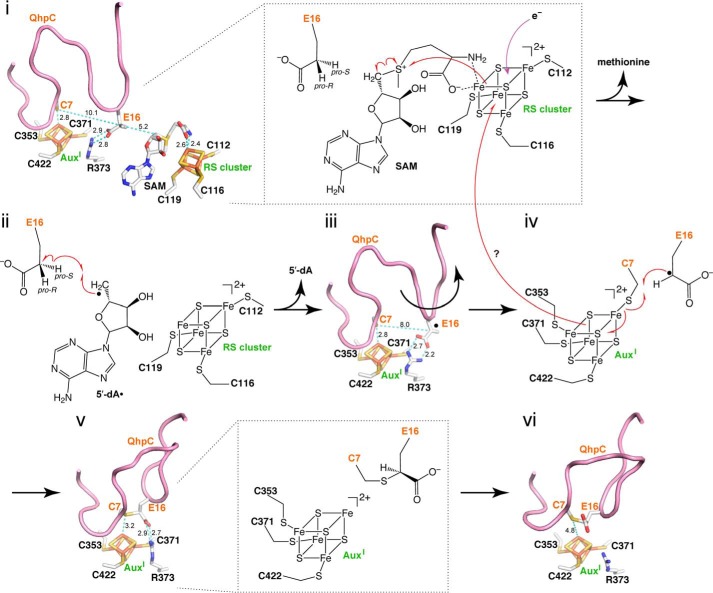
The bacterial enzyme designated QhpD belongs to the radical S-adenosyl-L-methionine (SAM) superfamily of enzymes and participates in the post-translational processing of quinohemoprotein amine dehydrogenase. QhpD is essential for the formation of intra-protein thioether bonds within the small subunit (maturated QhpC) of quinohemoprotein amine dehydrogenase. We overproduced QhpD from Paracoccus denitrificans as a stable complex with its substrate QhpC, carrying the 28-residue leader peptide that is essential for the complex formation. Absorption and electron paramagnetic resonance spectra together with the analyses of iron and sulfur contents suggested the presence of multiple (likely three) [4Fe-4S] clusters in the purified and reconstituted QhpD. In the presence of a reducing agent (sodium dithionite), QhpD catalyzed the multiple-turnover reaction of reductive cleavage of SAM into methionine and 5'-deoxyadenosine and also the single-turnover reaction of intra-protein sulfur-to-methylene carbon thioether bond formation in QhpC bound to QhpD, producing a multiknotted structure of the polypeptide chain. Homology modeling and mutagenic analysis revealed several conserved residues indispensable for both in vivo and in vitro activities of QhpD. Our findings uncover another challenging reaction catalyzed by a radical SAM enzyme acting on a ribosomally translated protein substrate.

Keywords: Enzyme Maturation; Iron-Sulfur Protein; Post-translational Modification; Protein Cross-linking; Radical; S-Adenosylmethionine (SAM).


Figures

FIGURE 1.
FIGURE 1.
Crystal structure of quinohemoprotein amine dehydrogenase. A, ribbon model of QHNDH from P. denitrificans (PDB code 1JJU) with α, β, and γ subunits colored green, yellow, and magenta, respectively. Hemes and CTQ are drawn as ball-and-stick models. B, enlarged view of the γ subunit in an orientation different from A. CTQ and thioether cross-links are shown as ball-and-stick models. This figure was prepared using MOLSCRIPT (49) and Raster3D (50). C, schematic structure of γ subunit is shown with the stereochemistry of the thioether bonds and the amino acid residues in a single-letter code.
FIGURE 2.
FIGURE 2.
Structure-based sequence alignment of QhpD homologs. Multiple sequence alignment was performed using the program ClustalW (51) for QhpD homologs and other radical SAM proteins belonging to the SPASM subgroup in A as follows: QhpD from P. denitrificans (Pd_QhpD, NCBI RefSeq, YP_915497); Meganema perideroedes (Mp_QhpD, WP_018634150); Ps. putida (Pp_QhpD, WP_010954326); anSME from C. perfringens (Cp_anSME (anSMEcpe), WP_011590280; PDB code 4K36); AslB from E. coli (Ec_AslB, YP_026259); PqqE from Granulibacter bethesdensis (Gb_PqqE, WP_011632626); AlbA from Bacillus subtilis (Bs_AlbA, WP_003242599); and SkfB from B. subtilis (Bs_SkfB, WP_003234902); and multiple sequence alignment was performed using the program ClustalW for SPASM domains of QhpD homologs in B as follows: Aneurinibacillus aneurinilyticus (Aan, GenBank gi:545381874); Arcobacter butzleri (Ab, gi:157736727); Amphritea japonica (Aja1, gi:518449972; Aja2, gi:518449964); Arcobacter sp. L (Arco, gi:384171423); Aromatoleum aromaticum (Aro1, gi:56478378; Aro2, gi:56476667); Azoarcus sp. BH72 (Azo, gi:119897531); Bacillus azotoformans (Baz, gi:489426247); Burkholderia cepacia (Bce, gi:402569817); Brevibacillus massiliensis (Bma, gi:517950086); Burkholderia sp. TJI49 (Burk, gi:325526527); Caenispirillum salinarum (Csa, gi:497227880); Citreicella sp. SE45 (Csp, gi:260425941); Desulfobacula toluolica (Dto, gi:408418101); Geopsychrobacter electrodiphilus (Gel, gi:522163448); Geobacillus thermoglucosidasius (Gth, gi:489342624); Halomonas sp. KM-1 (Halo, gi:498311926); Pseudogulbenkiania ferrooxidans (Ln, gi:224823976); Magnetospirillum sp. SO-1 (Magn, gi:495896650); M. perideroedes (Mpe, gi:517463417); Marinobacterium stanieri (Mst1, gi:498009607; Mst2, gi:498009580); Methyloversatilis universalis (Mu, gi:334132770); Novosphingobium aromaticivorans (Na, gi:87201041); Novosphingobium nitrogenifigens (Nn, gi:326387246); Neptuniibacter caesariensis (Osp1, gi:89094965; Osp2, gi:89093841); Paracoccus sp. TRP (Para, gi:498081303); P. denitrificans (Pd, gi:119384441); Polymorphum gilvum (Pg, gi:328544106); Phaeobacter gallaeciensis (Pga, gi:518127691); Pseudomonas aeruginosa (Psae, gi:544781831); Ps. alcaligenes (Psal, gi:544800897); Ps. chlororaphis (Pscla, gi:496335660); Ps. chlororaphis (Pscl, gi:496340839); Ps. denitrificans (Psde, gi:472325482); Ps. entomophila (Pse, gi:104782043); Ps. sp. FGI182 (Pseu, gi:568240125); Ps. fluorescens (Psf, gi:77459199); Pseudogulbenkiania sp. NH8B (Psgb, gi:347540000); Ps. putida (Psmo, gi:431802845); Ps. putida (Psp, gi:24985113); Ps. plecoglossicida (Pspl, gi:511761567); Ps. protegens (Pspr, gi:70731475); Ps. pseudoalcaligenes (Psps, gi:489543545); Ps. resinovorans (Psre, gi:512618903); Ps. thermotolerans (Psth1, gi:516562571; Psth2, gi:516563886); Rhodobacterales bacterium (Rb, gi:254467660); Stappia aggregata (Sa, gi:118588651); Sphingobium ummariense (Sum, gi:544909902); Sphingobium xenophagum (Sxe, gi:515748629); Sphingobium yanoikuyae (Sya, gi:490321472); Thauera aminoaromatica (Ta1, gi:479298785; Ta2, gi:479297321); Thiothrix disciformis (Tdi, gi:521061977); Thauera linaloolentis (Tli1, gi:490477633; Tli2, gi:490475214); Thauera phenylacetica (Tph, gi:490494489); Thauera sp. MZ1T (Tsp1, gi:217969195; Tsp2, gi:237653643); and α-proteobacterium LLX12A (llx12, gi:516070889). A, secondary structural elements found in the crystal structure of anSMEcpe (17) are shown above the alignment; the region including Gln-345–Leu-360 of Pd_QhpD was re-aligned manually so that Cys-353 of QhpD corresponds to Cys-261 of anSMEcpe to coincide with the QhpD structure model, described later (Fig. 15). Identical and highly conserved residues are shown by white letters on red background and red letters boxed in blue, respectively. Mutated residues of Pd_QhpD are indicated with green triangles above the alignment. Numbers in orange circles shown below the alignment represent Cys residues ligating the auxiliary clusters (Aux) in anSMEcpe (Aux I: 1, 2, 3, and 7; Aux II: 4, 5, 6, and 8) (17). The figure was produced using ESPRIPT (52).
FIGURE 3.
FIGURE 3.
Schematic structures of the plasmids used in this study. In all plasmids depicted, only the restriction sites used for plasmid construction are indicated. A, qhpD, qhpC, and metK genes were amplified by PCR using primers containing NdeI and BamHI (or BglII for metK) sites (Table 1) with Pd1222 or E. coli genomic DNA as a template. The NdeI/BamHI (or NdeI/BglII for metK) fragments excised from the PCR products were inserted into pET-11a to yield pET-QhpD, pET-fQhpC, and pET-metK. The NdeI/BamHI fragment excised from pET-QhpD was inserted into pET-15b to yield pET-H6-QhpD. Plasmids encoding pET-H6-QhpDC116S, pET-H6-QhpDG161A, pET-H6-QhpDC353S, pET-H6-QhpDR373A, and pET-H6-QhpDC412S were obtained by the PCR-based site-directed mutagenesis. B, to change antibiotic resistance of pBBR122-derived plasmids, the SmaI/HindIII fragment containing the Smr gene was excised from pGRPd1 (53), blunt-ended using Klenow fragment, and ligated into the ScaI site of pKO15-ORF2His (7). The resulting plasmid was digested at the PstI sites to remove the Kmr gene, and then self-ligated to yield pBBR-ORF2His. The BglII/EcoRI fragment containing qhpD with the T7 promoter was excised from pET-QhpD and inserted into pBBR-ORF2His (replacing qhpD and the qhp promoter) to yield pBBR-QhpD. The NdeI/BamHI fragments were excised from pET-fQhpC and inserted into pBBR-QhpD (replacing qhpD) to yield pBBR-fQhpC. Oligonucleotide encoding H6 tag and its complement were annealed and inserted into the StuI/BamHI sites in pBBR-fQhpC. The NdeI/NheI fragment was excised from the resulting plasmid and ligated to the NdeI/NheI fragment excised from the PCR product encoding sQhpC gene to yield pET-sQhpC-H6. Oligonucleotides encoding a single Strep tag (St-tag) and its complement were annealed and inserted into the NheI/BamHI sites in pBBR-sQhpC-H6 to yield pBBR-sQhpC-St. Oligonucleotides encoding a linker and the second St-tag and its complement were annealed and inserted into the BstBI site in pBBR-sQhpC-St to yield pBBR-sQhpC-St2. The NdeI/BamHI fragments were excised from pBBR-sQhpC-H6 and pBBR-sQhpC-St2 and inserted into pET-11a to yield pET-sQhpC-H6 and pET-sQhpC-St2, respectively. The restriction sites shown in parentheses were eliminated by ligation. C, genes encoding QhpC variants were amplified by PCR using primers containing NdeI and NheI (or XbaI for fQhpC and QhpC1–82) sites with pET-fQhpC as a template. The NdeI/NheI or NdeI/XbaI fragments were excised from the PCR products and inserted into pET-sQhpC-H6 to yield pET-QhpC(−28)−7-H6, pET-QhpC(−28)−31-H6, pET-fQhpC-H6, pET-QhpC1–7-H6, pET-QhpC1–23-H6, pET-QhpC1–31-H6, and pET-QhpC1–82-H6. The NdeI/XbaI fragment containing the fQhpC gene was also inserted into pET-sQhpC-St2 to yield pET-fQhpC-St2. D, NdeI/BamHI fragments were excised from pET-fQhpC-St2 and inserted into pBBR-QhpD (replacing qhpD) to yield pBBR-fQhpC-St2. Plasmids encoding pBBR-fQhpCE16Q-St2, pBBR-fQhpCD49N-St2, pBBR-fQhpCD33N/D49N-St2, and pBBR-sQhpCC7S-St2 were obtained by the PCR-based site-directed mutagenesis. The gene encoding GST was amplified by PCR using primers containing NheI and XbaI sites with pGEX-6P-3 (GE Healthcare) as a template. The NheI/XbaI fragment was excised from the PCR products and inserted into pBBR-sQhpCC7S-St2 to yield pBBR-sQhpCC7S-GST-St2. E, XbaI/HindIII fragment was excised from pET-MetK and inserted into pRK-H6ORF5 (8) (replacing H6ORF5) to yield pRK-MetK. The NdeI/BamHI fragments excised from pET-H6-QhpD, pET-H6-QhpDC353S. and pET-H6-QhpDR373A were inserted into pRK-H6ORF5 (replacing ORF5) to yield pRK-H6-QhpD, pRK-H6-QhpDC353S, and pRK-H6-QhpDR373A, respectively.
FIGURE 4.
FIGURE 4.
Interaction of QhpD with various forms of QhpC and affinity purification of the QhpC·QhpD complex. A, E. coli cells transformed with either pET-H6-QhpD alone, pET-H6-QhpD plus pRKSUF, or pBBR-QhpD plus one of the pET-QhpC-H6 plasmids (encoding various lengths of QhpC as indicated in the figure) were grown in 50 ml of LB medium containing appropriate antibiotics, 0.17 mg/ml of ammonium ferric citrate, and 0.1 mm isopropyl β-d-thiogalactopyranoside, and disrupted by sonication in 50 mm potassium phosphate buffer, pH 7.8, containing 300 mm NaCl. Cell extracts (2.4 ml) were applied to nickel-nitrilotriacetic acid spin columns (Qiagen) in four load-and-spin cycles, and eluted proteins were precipitated with 10% (w/v) TCA and dissolved in 50 μl of loading buffer for SDS-PAGE. A 10-μl aliquot of the resultant solution was loaded in each lane. B, E. coli cells harboring pET-H6-QhpD and pBBR-sQhpC-St2 were disrupted by sonication (total lysate). The cell extract obtained by centrifugation (soluble fraction) was purified first by a nickel chelate column (Ni column elution) and second by a Strep-Tactin column (Strep column elution). A total of 7 μg of protein was loaded in each lane. The protein bands were stained with colloidal Coomassie G-250 (54).
FIGURE 5.
FIGURE 5.
UV-visible absorption spectra and iron/sulfur contents of wild-type and mutant QhpD complexes with sQhpC. UV-visible absorption spectra of the as-purified (gray) and reconstituted (black) complexes of sQhpC·QhpD (A), sQhpC·QhpDC116S (B), sQhpC·QhpDG161A (C), sQhpC·QhpDC353S (D), and sQhpC·QhpDR373A (E) are shown after normalization to a protein concentration of 1 mg/ml. F, numbers of iron and sulfur atoms per each sQhpC·QhpD complex are represented by black and gray bars, respectively. Dashed line indicates the number of iron and sulfur atoms expected for the content in three [4Fe-4S] clusters.
FIGURE 6.
FIGURE 6.
EPR spectra of wild-type and mutant QhpD complexes with sQhpC or sQhpCC7S. The X-band EPR spectra of the reconstituted sQhpC·QhpD, sQhpCC7S·QhpD, sQhpC·QhpDC116S, sQhpC·QhpDC353S, sQhpC·QhpDG161A, and sQhpC·QhpDR373A complexes (80 μm) are shown with important g values including those for g and g signals. X-band (9.23 GHz) microwave frequency spectra before (gray) and after (black) the addition of 2 mm DT were recorded at 15 K with modulation frequency, 100 kHz; modulation amplitude, 1 millitesla (mT); and microwave power, 10 milliwatts.
FIGURE 7.
FIGURE 7.
Analysis of 5′-dA produced in the SAM cleavage reaction by QhpD. After TCA quenching and removal of the precipitated proteins, the reaction mixtures were analyzed by reversed-phase column chromatography using Cosmosil 5C18-PAQ column (Nacalai Tesque) equipped on an HPLC system: A, DT; B, sQhpC·QhpD; C, SAM; D, sQhpC·QhpD + DT + SAM; E, 5′-dA standard. The elution was monitored at absorbance at 260 nm. F, P2 peak of sQhpC·QhpD + DT + SAM (D) was collected and analyzed by TOF MS. The peaks with masses larger than that of 5′-dA are assumed to be derived from impurities contaminated during the procedure.
FIGURE 8.
FIGURE 8.
Identification of methionine and time course of the product formation in SAM cleavage reaction. A, SAM cleavage reaction was carried out with the sQhpC·QhpD complex (63 μm) in the presence of 1 mm DT and 1 mm SAM for 1 h. The DBD-F-treated samples (sQhpC·QhpD + DT + SAM, 0.2 mm Met, and buffer only) were analyzed by reversed-phase column chromatography using the Cosmosil 5C18-PAQ column equipped on an HPLC system. The elution was monitored by excitation at 450 nm and emission at 590 nm. The elution position of DBD-Met is indicated by a dotted line. B, time course of the SAM cleavage reaction was monitored with the concentrations of products formed (5′-dA and Met), which were calculated by integrating the peak area. Open circles and squares indicate 5′-dA and Met concentrations, respectively, in the reaction with 63 μm sQhpCC7S·QhpD, and gray circles indicate 5′-dA concentrations in the reaction with 63 μm sQhpC·QhpD. Lines represent initial increase of the concentrations of 5′-dA produced.
FIGURE 9.
FIGURE 9.
MALDI-TOF MS analysis of in-gel digested sQhpC. Mass spectra obtained from sQhpC·QhpD (A) and sQhpCC7S·QhpD (B) before (gray) and after (black) the reaction. Each complex (∼80 μm) was mixed with or without 1 mm DT and 1 mm SAM, and incubated for 1 h for cross-linking reaction. The sQhpC polypeptide was then separated by SDS-PAGE, digested in-gel with Glu-C (Roche Applied Science) and then analyzed with a Bruker Ultraflex III MALDI-TOF mass spectrometer. Schematic structure of sQhpC and sQhpCC7S with identified fragments are shown in the inset. Theoretical monoisotopic m/z values calculated for each fragment ([M + H+]) are also shown near each peak. In the case of the wild-type sQhpC shown in A, the peak height of fragment iii was significantly decreased after the cross-linking reaction, probably due to the inability of Glu-C to cleave the peptide bond next to the cross-linked Glu-16. In contrast in B, such effect was not observed after the reaction, indicating that the C7S mutant does not undergo the ether bond formation between Ser-7 and Glu-16 by QhpD.
FIGURE 10.
FIGURE 10.
Reaction scheme of thiol-modifying reagents used for detection of unreacted free –SH group and MALDI-TOF MS analysis of cross-link formation in sQhpC. Reaction schemes for IAA (A) and NAM (D) and mass spectra for the sQhpC·QhpD (B and E) and sQhpCC7S·QhpD (C and F) complexes modified with IAA (B and C) or NAM (E and F) are shown. Note that sQhpC after undergoing the thioether bond formation would not be modified by these reagents. The reconstituted complexes (∼80 μm) before (blue) and after (red) the reaction with 1 mm DT and 1 mm SAM for 1 h were concentrated by precipitation with TCA, dissolved in 6 m urea in 50 mm potassium phosphate, incubated with 50 mm IAA or 0.5 mm NAM for 1 h, desalted with a C18 ZipTip pipette tip, and subjected to MALDI-TOF MS analysis. Theoretical m/z values (including St2-tag) ([M + H+]) are as follows: IAA-modified (uncross-linked) sQhpC, 8538.42; NAM-modified (uncross-linked) sQhpC, 8755.65; cross-linked sQhpC, 8479.35; uncross-linked sQhpCC7S, 8465.30.
FIGURE 11.
FIGURE 11.
Thioether bond formation in sQhpC. A, MALDI-TOF MS analysis of the reaction product (sQhpC) modified with IAA. Predicted mass difference between the acetamidated sQhpC and that containing the Cys-7–Glu-16 thioether bond is 59.1. B, SDS-PAGE analysis of the reaction product modified with NAM. C, time course of the thioether bond formation as monitored by the disappearance of the fluorescent band. B and C, values below the fluorescent band show relative fluorescence intensities. D, plot of fluorescence intensities against reaction time. The method of sample preparation was the same as described in the legend to Fig. 10.
FIGURE 12.
FIGURE 12.
MALDI-TOF MS analysis of cross-link formation of QhpC co-expressed with QhpD mutants and MetK. Mass spectra obtained from the reaction mixtures with the sQhpC-St2·QhpD (A), sQhpC-H6·QhpD (B), sQhpC-St2·QhpDC116S (C), sQhpC-St2·QhpDG161A (D), sQhpC-St2·QhpDC353S (E), sQhpC-St2·QhpDR373A (F), and fQhpC-St2·QhpDR373A (G) complexes. B, the as-purified sQhpC-H6·QhpD (blue) and that co-expressed with MetK (red) were used without subjecting to the in vitro reaction. In other panels, the reconstituted complexes before (blue) and after (red) the reaction with 1 mm DT and 1 mm SAM for 1 h were used for analysis. Note that in the sQhpC-St2·QhpDG161A complex (D), the thioether bond formation in E. coli cells (before the in vitro reaction) was almost unobserved as compared with the wild-type sQhpC-St2·QhpD in A. The method of sample preparation was the same as described in the legend to Fig. 10. Theoretical m/z values (including St2-tag or H6-tag) ([M + H+]): IAA-modified (uncross-linked) sQhpC-St2, 8538.42; cross-linked sQhpC-St2, 8479.35; IAA-modified (uncross-linked) sQhpC-H6, 6435.18; cross-linked sQhpC-H6, 6376.11; IAA-modified (uncross-linked) fQhpC-St2, 15129.5.
FIGURE 13.
FIGURE 13.
Thioether bond formation in fQhpC. A, reconstituted fQhpC·QhpD complex before (yellow green) and after (red) the reaction with 1 mm DT and 1 mm SAM for 2 h and also the fQhpC purified from the fQhpC·QhpDC116S complex (blue) were modified with IAA and analyzed by MALDI-TOF MS. Calculated mass values for fQhpC with St2-tag (M) containing 1–4 acetamide (AA) groups with 3–0 thioether bonds are indicated in the inset. B, time course of thioether bond formation in the fQhpC·QhpD complex. The number of 1–4 acetamide groups incorporated is indicated at the top of each peak. Mass spectra of fQhpC at each reaction time are shown in different colors as follows: 0 (blue); 2 (green); 5 (yellow-green); 10 (yellow); 20 (yellow-orange); 40 (orange); and 60 min (red). SDS-PAGE analysis of the reaction product is shown in the inset. C, MS and SDS-PAGE analyses of the order of thioether bond formation using wild-type (WT) and mutants of fQhpC. Mass spectra of E16Q (cyan), D33N/D49N (green), D49N (yellow), and WT (red) fQhpC after the cross-linking reaction for 20 min are shown. Predicted patterns of the thioether bond formation are shown schematically for WT and each mutant. The method of sample preparation was the same as described in the legend to Fig. 10.
FIGURE 14.
FIGURE 14.
Analysis of the interaction between QhpD and fQhpC before and after the cross-linking reaction. A, reconstituted fQhpC·QhpD (60 μm) (before reaction) was reacted with 1 mm DT and 1 mm SAM for 8 h (after reaction). The reaction mixture (2 ml) was applied to a His trap column (2 ml) (QhpD contained N-terminal H6-tag), and the flow-through (FT, 2 ml), first and second wash (W1 and W2, each 2 ml), and eluted (E, 2 ml) fractions were collected and analyzed by SDS-PAGE (10 μl/lane). The protein bands were stained with colloidal Coomassie G-250 (54). B, enhanced image of the boxed area in A. Band intensities were quantified using the ImageJ program (National Institutes of Health) and are shown below each lane as a percentage relative to the band intensity of uncross-linked fQhpC before the reaction.
FIGURE 15.
FIGURE 15.
Homology alignment-based structure model of QhpD. The modeled QhpD structure is shown in ribbon representation with molecular surfaces; the radical SAM, SPASM, and other domains are colored magenta, green, and light blue, respectively. SAM, iron-sulfur clusters (RS, AuxI, and AuxII), and the side chains of Cys residues ligating the clusters and those substituted by site-directed mutagenesis (labeled in red) are shown by stick models.
FIGURE 16.
FIGURE 16.
Bacterial growth and QHNDH activity of the wild-type and qhpD-disrupted mutant of P. denitrificans Pd1222. A, wild-type Pd1222 (■) and qhpD-disrupted mutant PdΔqhpD cells transformed with pRK-H6-QhpD (▵), pRK-H6-QhpDC353S (□), pRK-H6-QhpDR373A (♢), or an empty vector pRK415–1 (○) were grown in minimal medium supplemented with n-butylamine. Cell densities measured by absorbance at 600 nm were plotted against culture time. B, wild-type Pd1222 and mutant PdΔqhpD cells transformed with a plasmid carrying the wild-type or mutant genes (as indicated) were cultured for 36 h in minimal medium containing n-butylamine. To support growth of the gene-disrupted mutant cells, 20 mm choline chloride was added to the culture medium. Preparation of periplasmic and cytoplasmic fractions of P. denitrificans Pd1222 cells and assay of QHNDH activity were performed as described previously (7). QHNDH activities in the periplasmic fraction are shown as relative values compared with that of wild-type Pd1222 cells (100%). Each bar represents the mean ± S.E. from two independent experiments.
FIGURE 17.
FIGURE 17.
Interaction of QhpD mutants with QhpC. E. coli was co-transformed with pET-sQhpC-H6 and one of the pBBR-QhpD plasmids (encoding wild-type, C116S, G161A, C353S, R373A, and C412S mutants of QhpD, as indicated). Protein expression and purification, sample preparation, and SDS-PAGE were performed as described in the legend to Fig. 4.
FIGURE 18.
FIGURE 18.
SAM cleavage activity of wild-type and mutant QhpD. The SAM cleavage reaction was carried out at room temperature for 8 h with 63 μm wild-type and mutant enzymes of QhpD in the presence of 1 mm SAM, and the 5′-dA produced was measured by HPLC as described in the legend to Fig. 7. The concentrations of the 5′-dA produced were calculated from the peak area in the HPLC profiles.
FIGURE 19.
FIGURE 19.
Structure modeling of the QhpC·QhpD complex. A, sequence conservation is mapped onto the molecular surfaces of the models of QhpD and QhpC, colored in gradation from white to green, corresponding to the score of 0.5 (nonconserved) and 1.0 (fully conserved), respectively. The conservation score was calculated using Scorecons (55) with all QhpD and QhpC homologs (∼270 sequences) identified by a BLAST search. B, electrostatic surface potential is mapped onto the modeled QhpD surface, colored in gradation from red (−5 kT) to blue (+5 kT), where k is Boltzmann's constant and T is the absolute temperature, based on the calculation by PyMOL (Schrödinger, LLC) and APBS (56). C, predicted interactions between the leader peptide of QhpC and surface residues of QhpD. Residue numbers of QhpC and QhpD are indicated in red and black, respectively. Sequence conservation is also shown as in A. D, modeled structures of the fQhpC·QhpD complexes during the processive reaction along the fQhpC polypeptide are shown in ribbon representation with molecular surfaces of QhpD (green ribbon). The leader and the core peptides of QhpC are colored orange and magenta, respectively. SAM, iron-sulfur clusters, thioether bonds, and their precursor residues are shown by stick models. Modeled structures of the cross-linked segments, Cys-7–Glu-16 in step II, Cys-7–Glu-16 and Cys-27–Asp-33 in step III, Cys-7–Asp-33 and Cys-41–Asp-49 in step IV, and the fully cross-linked core peptide in step V of fQhpC were adopted from the coordinate of γ subunit (maturated QhpC) in the QHNDH crystal structure with other regions built and refined using the regularize zone module in Coot (26) to improve model stereochemistry. All molecular drawings were generated using PyMOL.
FIGURE 20.
FIGURE 20.
Multiple sequence alignment of QhpC homologs and secondary structure prediction. A, multiple sequence alignment was conducted using the program ClustalW (51) for QhpC homologs from the following: A. aneurinilyticus (Aan, GenBank gi:545381876); A. butzleri (Ab, gi:157736728); A. japonica (Aja1, gi:518449973; Aja2, gi:518449965); Arcobacter sp. L (Arco, gi:384171424); A. aromaticum (Aro1, gi:56478379; Aro2, gi:56476666); Azoarcus sp. BH72 (Azo, gi:119897532); B. azotoformans (Baz, gi:489426249); B. cepacia (Bce, gi:402569816); B. massiliensis (Bma, gi:517950088); Burkholderia sp. TJI49(Burk, gi:325526528); C. salinarum (Csa, gi:497227881), Citreicella sp. SE45 (Csp, gi:260426667); D. toluolica (Dto, gi:408418099); G. electrodiphilus (Gel, gi:522163449); G. thermoglucosidasius (Gth, gi:617767740); Halomonas sp. KM-1 (Halo, gi:498311925); P. ferrooxidans (Ln, gi:224823977); Magnetospirillum sp. SO-1 (Magn, gi:452962999); M. perideroedes (Mpe, gi:517463416); M. stanieri (Mst1, gi:498009606; Mst2, gi:498009579); M. universalis (Mu, gi:334132771); N. aromaticivorans (Na, gi:87201042; N. nitrogenifigens (Nn, gi:326387245); N. caesariensis (Osp1, gi:89094964; Osp2, gi:89093840); Paracoccus sp. TRP (Para, gi:498081305); P. denitrificans (Pd, gi:119384442); P. gilvum (Pg, gi:328544105); P. gallaeciensis (Pga, gi:518127692); Ps. aeruginosa (Psae1, gi:544781830; Psae2, gi:544782759). Ps. alcaligenes (Psal, gi:544800896); Ps. chlororaphis (Pscl, gi:496335659; Pscla, gi:647806188); Ps. denitrificans (Psde, gi:472325483); Ps. entomophila (Pse, gi:104782042); Ps. sp. FGI182 (Pseu, gi:568240124); Ps. fluorescens (Psf, gi:77459198); Pseudogulbenkiania sp. NH8B (Psgb, gi:347540001); Ps. putida (Psmo, gi:431802844); Ps. putida (Psp, gi:24985112); Ps. plecoglossicida (Pspl, gi:511101188); Ps. protegens (Pspr, gi:346643116); Ps. pseudoalcaligenes (Psps, gi:489543546); Ps. resinovorans (Psre, gi:512618902); Ps. thermotolerans (Psth1, gi:516562569; Psth2, gi:648454818); R. bacterium (Rb, gi:254467679); S. aggregata (Sa, gi:118588650); S. ummariense (Sum, gi:544909903); S. xenophagum (Sxe, gi:515748628); S. yanoikuyae (Sya, gi:490321473); T. aminoaromatica (Ta1, gi:479298786; Ta2, gi:479297320); T. disciformis (Tdi, gi:521061978); T. linaloolentis (Tli1, gi:490477634; Tli2, gi:490475210); T. phenylacetica (Tph, gi:490494487); Thauera sp. MZ1T (Tsp1, gi:217969196; Tsp2, gi:237653642); and α-proteobacterium LLX12A (llx12, gi:516070888). Identical and highly conserved residues are shown by white letters on red background and red letters boxed in blue, respectively. The figure was produced using ESPRIPT (52). B, amino acid sequence of QhpC(−28)−12was used as a query for secondary structure predictions, and the results are graphically displayed with arrows and cylinders for β-strands and α-helices, respectively.
FIGURE 21.
FIGURE 21.
Possible reaction mechanism for the formation of thioether bond catalyzed by QhpD. The active site of QhpD is depicted by a stick model extracted from the modeled QhpD structure (Fig. 15) with the ribbon model of QhpC built by Coot (26) and shown in purple, except for the cross-linked loop structure containing Cys-7–Glu-16 in step vi, which was adopted from the coordinates of the γ subunit (maturated QhpC) in the QHNDH crystal structure. Distances between the two atoms connected by cyan dotted lines are indicated in angstroms (Å). Red and purple curves with an arrowhead show presumed routes of electron transfer. All molecular drawings were generated using PyMOL.

References

    1. Takagi K., Torimura M., Kawaguchi K., Kano K., Ikeda T. (1999) Biochemical and electrochemical characterization of quinohemoprotein amine dehydrogenase from Paracoccus denitrificans. Biochemistry 38, 6935–6942 - PubMed
    1. Takagi K., Yamamoto K., Kano K., Ikeda T. (2001) New pathway of amine oxidation respiratory chain of Paracoccus denitrificans IFO 12442. Eur. J. Biochem. 268, 470–476 - PubMed
    1. Adachi O., Kubota T., Hacisalihoglu A., Toyama H., Shinagawa E., Duine J. A., Matsushita K. (1998) Characterization of quinohemoprotein amine dehydrogenase from Pseudomonas putida. Biosci. Biotechnol. Biochem. 62, 469–478 - PubMed
    1. Nakai T., Deguchi T., Frébort I., Tanizawa K., Okajima T. (2014) Identification of genes essential for the biogenesis of quinohemoprotein amine dehydrogenase. Biochemistry 53, 895–907 - PubMed
    1. Datta S., Mori Y., Takagi K., Kawaguchi K., Chen Z. W., Okajima T., Kuroda S., Ikeda T., Kano K., Tanizawa K., Mathews F. S. (2001) Structure of a quinohemoprotein amine dehydrogenase with an uncommon redox cofactor and highly unusual cross-linking. Proc. Natl. Acad. Sci. U.S.A. 98, 14268–14273 - PMC - PubMed

Publication types

MeSH terms

LinkOut - more resources