. 2015 Mar 17:5:9156.
doi: 10.1038/srep09156.

Quo vadis? Microbial profiling revealed strong effects of cleanroom maintenance and routes of contamination in indoor environments

Affiliations

Quo vadis? Microbial profiling revealed strong effects of cleanroom maintenance and routes of contamination in indoor environments

Christine Moissl-Eichinger et al. Sci Rep. .

Abstract

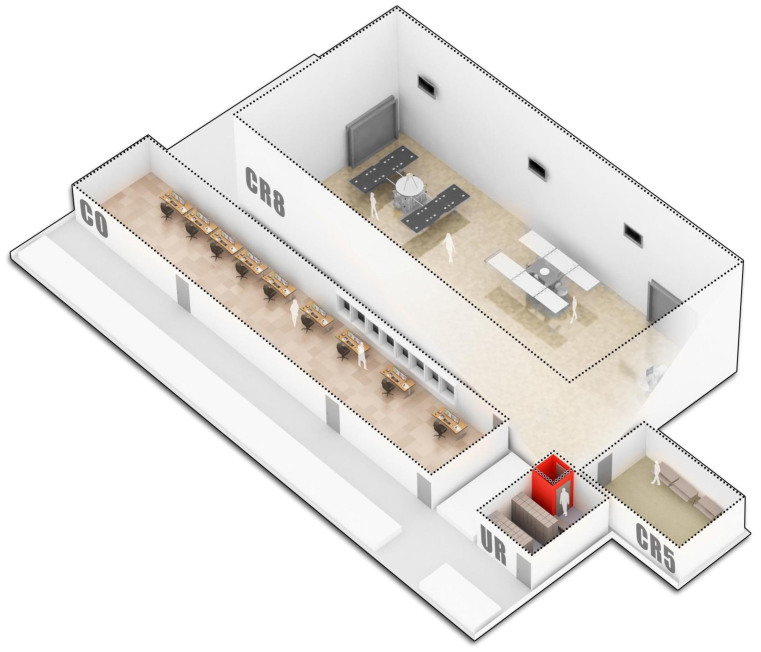
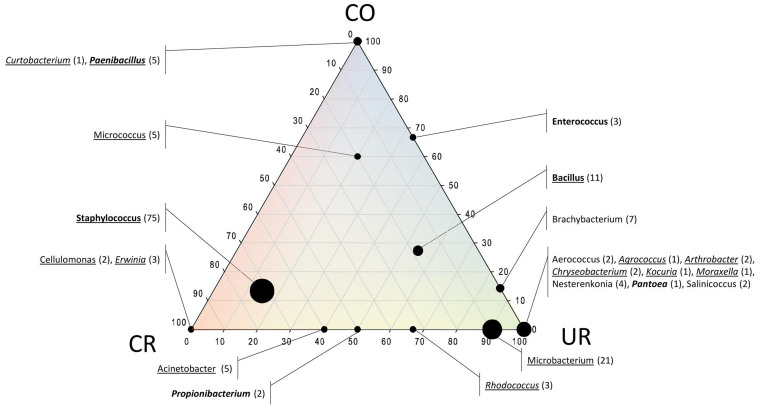
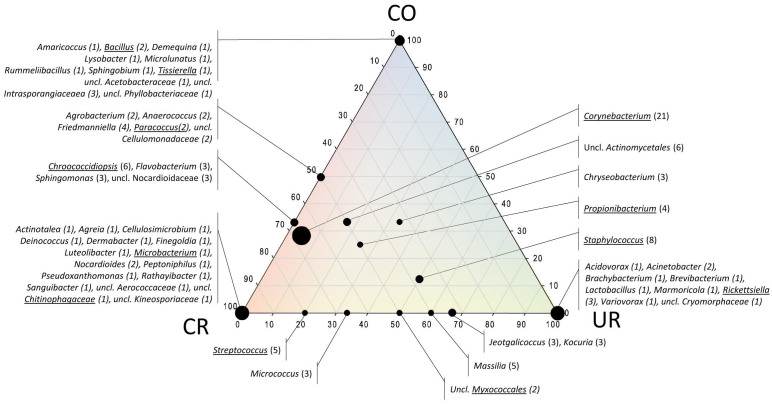
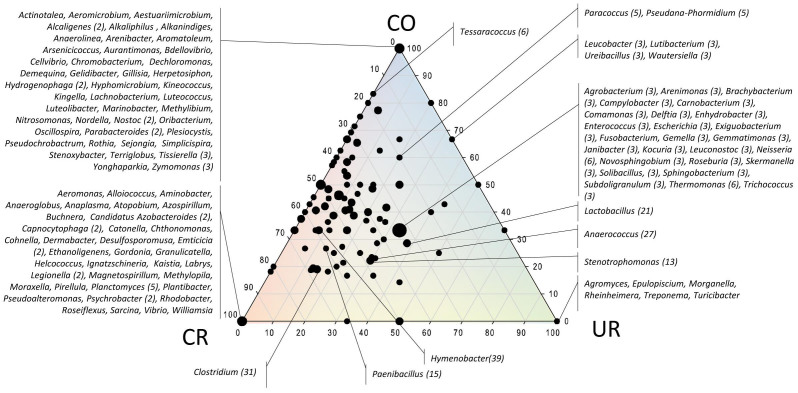
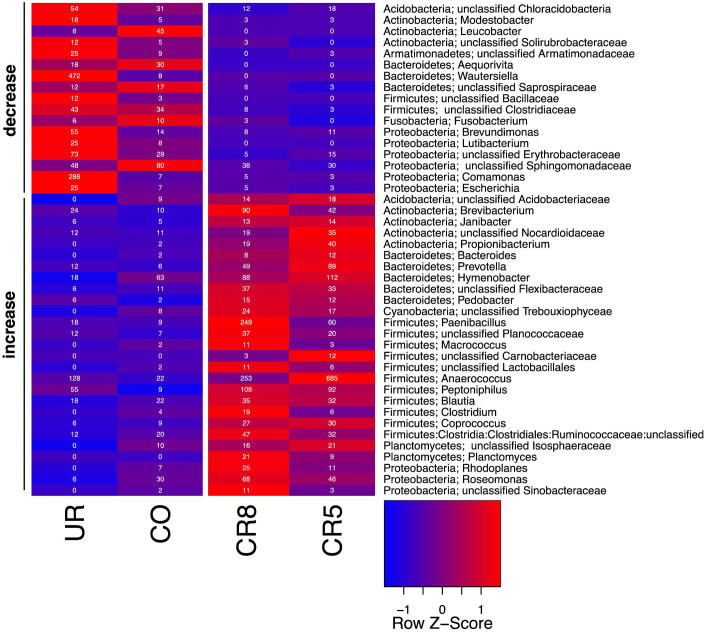
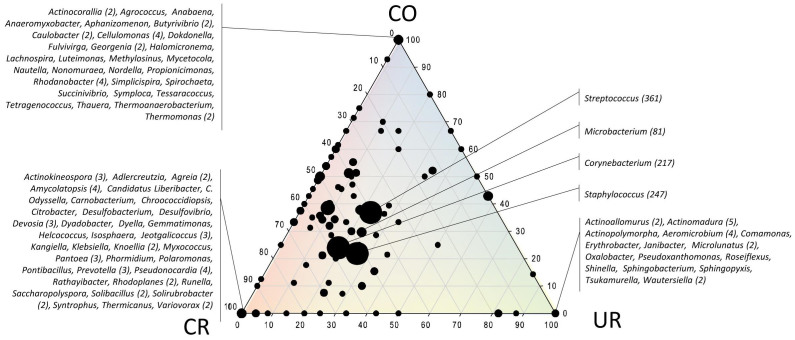
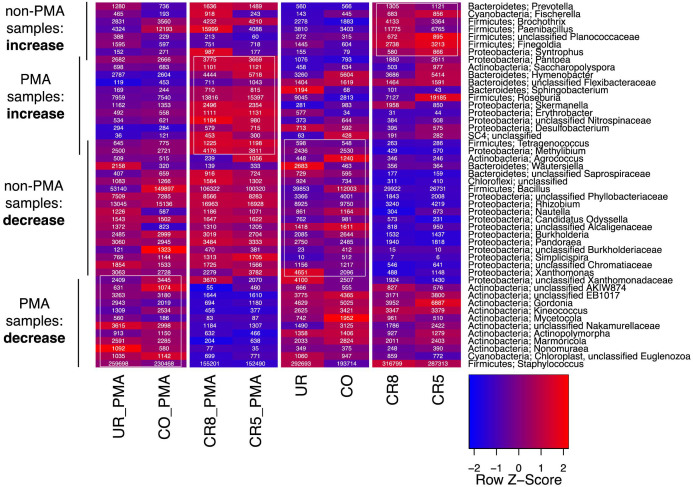
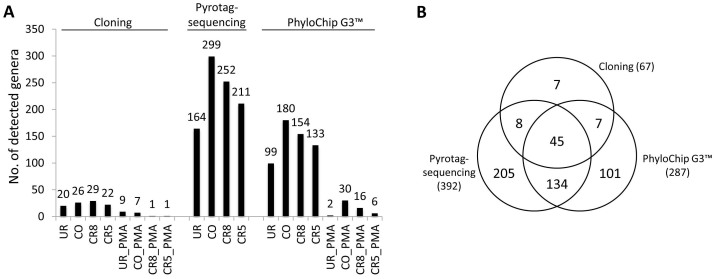
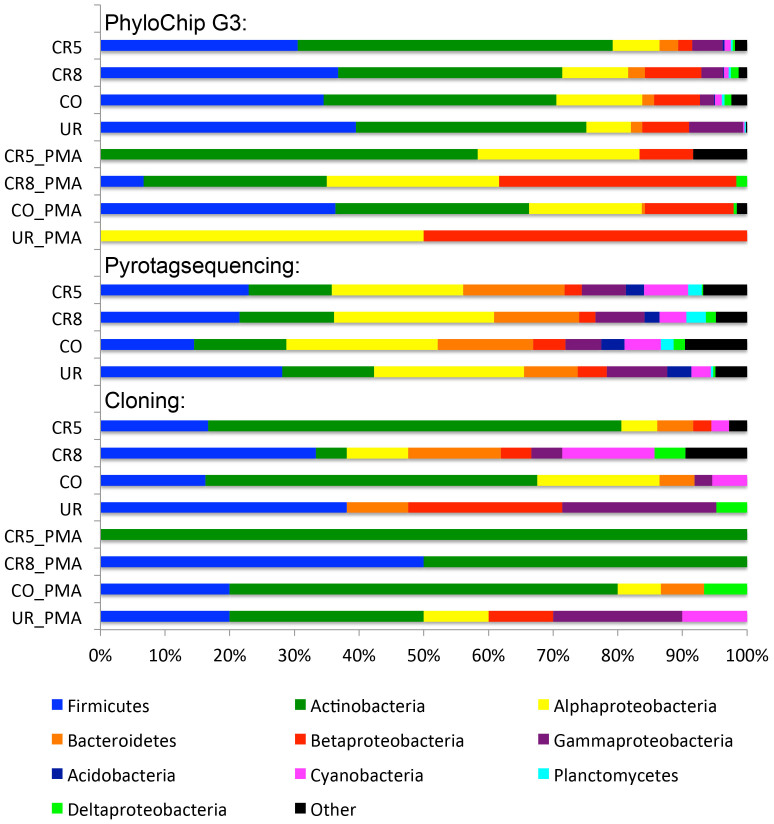
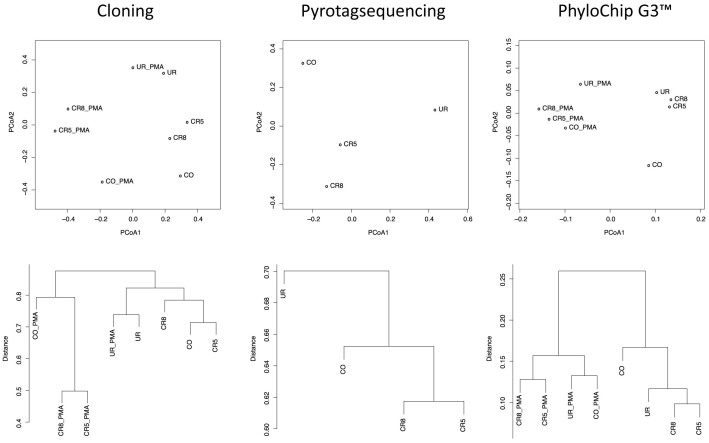
Space agencies maintain highly controlled cleanrooms to ensure the demands of planetary protection. To study potential effects of microbiome control, we analyzed microbial communities in two particulate-controlled cleanrooms (ISO 5 and ISO 8) and two vicinal uncontrolled areas (office, changing room) by cultivation and 16S rRNA gene amplicon analysis (cloning, pyrotagsequencing, and PhyloChip G3 analysis). Maintenance procedures affected the microbiome on total abundance and microbial community structure concerning richness, diversity and relative abundance of certain taxa. Cleanroom areas were found to be mainly predominated by potentially human-associated bacteria; archaeal signatures were detected in every area. Results indicate that microorganisms were mainly spread from the changing room (68%) into the cleanrooms, potentially carried along with human activity. The numbers of colony forming units were reduced by up to ~400 fold from the uncontrolled areas towards the ISO 5 cleanroom, accompanied with a reduction of the living portion of microorganisms from 45% (changing area) to 1% of total 16S rRNA gene signatures as revealed via propidium monoazide treatment of the samples. Our results demonstrate the strong effects of cleanroom maintenance on microbial communities in indoor environments and can be used to improve the design and operation of biologically controlled cleanrooms.


Figures

Figure 1
Figure 1. Illustration of the integration center at Airbus Defence and Space GmbH in Friedrichshafen, Germany.
Sampled rooms were designated as follows: UR – changing room, CO – checkout room, CR8 – ISO 8 cleanroom, CR5 – ISO 5 cleanroom. Proportions reflect actual dimensions. Interieur decorations were abstracted and do not mirror real arrangement.
Figure 2
Figure 2. Ternary plot of isolates (genera) with respect to the sample origin (the two cleanrooms CR5 and CR8 were summarized: CR).
Axes reflect the percentage of isolates detected in each location. Isolates obtained under oligotrophic conditions are underlined, isolates obtained under anaerobic conditions are printed bold, isolates obtained under alkaline conditions are printed non-italics. In brackets: number of retrieved colonies.
Figure 3
Figure 3. Ternary plot of detected cOTUs (bacterial 16S rRNA gene cloning) with respect to the sample origin (the two cleanrooms CR5 and CR8 were summarized: CR).
Axes reflect the percentage of OTUs detected in each location; OTUs that could not be attributed to an order, family or genus were not considered. Size of dots reflects no. of detected OTUs summarized in one dot. Underlined genera were also detected when samples were treated with PMA ( = intact cells). Uncl.: unclassified.
Figure 4
Figure 4. Ternary plots of detected pOTUs (454 pyrotag sequencing) with respect to the sample origin (the two cleanrooms CR5 and CR8 were summarized: CR).
Axes reflect the percentage of OTUs detected in each location; OTUs that could not be attributed to a order, family or genus were not considered. Size of dots reflects no. of detected OTUs summarized in one dot (no. given in brackets if different from 1).
Figure 5
Figure 5. Heatmap based on 454 pyrotagsequencing data of aggregated read counts at genus level (reads were sum-normalized prior to aggregation).
Displayed are genera that showed an at least 25% increase or decrease in both cleanroom samples compared to non-cleanroom samples and had a minimum number of reads of at least 10. Numbers in the cells give number of reads. For the color gradient, read scores were normalized for each genus and are presented as Z-scores.
Figure 6
Figure 6. Ternary plots of detected rOTUs (PhyloChip, non-PMA treated sample) with respect to the sample origin (the two cleanrooms CR5 and CR8 were summarized: CR).
Axes reflect the percentage of OTUs detected in each location; OTUs that could not be attributed to a order, family or genus were not considered for calculation. Size of dots reflects no. of detected OTUs summarized in one dot (no. given in brackets if different from 1).
Figure 7
Figure 7. Heatmap based on summarized OTU trajectories (genus level) derived from PhyloChip G3™ data (after rank normalization of rOTUs).
Displayed are genera that showed at least 25% increase or decrease in both cleanroom samples compared to non-cleanroom samples. White boxes indicate taxa that showed a 25% increase over other corresponding samples. Numbers in the cells give the summarized rank for each genus. For the color gradient, rank scores were normalized for each genus and are presented as Z-scores. Non-PMA and PMA treated samples are displayed individually.
Figure 8
Figure 8. Comparison of molecular methods.
All sequences were classified using the same method (Bayesian method in mothur, GreenGenes taxonomy) as indicated in Materials and Methods. (A): Richness comparison of genera detected in each sample via cloning, pyrotagsequencing, and PhyloChip G3. While no significant correlation was detected between cloning and pyrotagsequencing/PhyloChip richness, pyrosequencing and PhyloChip derived genus richness correlated highly significantly between samples (p-value = 0.003, Pearson's R = 0.997). No significant correlation was found for OTU based richness (data not shown). (B): Venn-Diagramm displaying the shared genera between the three techniques used in this study.
Figure 9
Figure 9. Barchart displaying the percent richness of c/p/rOTUs classified at higher taxa (phylum level, for Proteobacteria class level, incidence values of OTUs), for each sample and analysis method.
All sequences were classified using the same method (Bayesian method in mothur, GreenGenes taxonomy) as indicated in the Methods section. The top ten most prominent higher taxa are shown ascending while the remaining taxa are grouped into category “other”.
Figure 10
Figure 10. Ordination analysis and hierarchical clustering (average neighbour) of cloning, pyrosequencing and PhyloChip G3™ derived bacterial microbiomes.
Analyses are based on Bray-Curtis indices of rank-normalized abundance scores of OTUs. Explained variances of PCoA axes were 29% (PCoA1) and 19% (PCoA2) for cloning, 40% (PCoA1) and 33% (PCoA1) for pyrosequencing, and 66% (PCoA1) and 13% (PCoA2) for PhyloChip data.

References

    1. Gilbert J. A. & Dupont C. L. Microbial metagenomics: beyond the genome. Ann Rev Mar Sci 3, 347–371 (2011). - PubMed
    1. Nocker A., Cheung C.-Y. & Camper A. K. Comparison of propidium monoazide with ethidium monoazide for differentiation of live vs. dead bacteria by selective removal of DNA from dead cells. J Microbiol Methods 67, 310–320 (2006). - PubMed
    1. Huber T., Faulkner G. & Hugenholtz P. Bellerophon: a program to detect chimeric sequences in multiple sequence alignments. Bioinformatics 20, 2317–2319 (2004). - PubMed
    1. Gilbert J. A., O'Dor R., King N. & Vogel T. M. The importance of metagenomic surveys to microbial ecology: or why Darwin would have been a metagenomic scientist. Microb Inform Exp 1, 5 (2011). - PMC - PubMed
    1. Human Microbiome Project Consortium. A framework for human microbiome research. Nature 486, 215–221 (2012). - PMC - PubMed

Publication types

Substances

LinkOut - more resources