Comparative Study
. 2016 Feb;21(2):169-77.
doi: 10.1038/mp.2015.20. Epub 2015 Mar 17.

Pathogenic mechanism of an autism-associated neuroligin mutation involves altered AMPA-receptor trafficking

Affiliations
Comparative Study

Pathogenic mechanism of an autism-associated neuroligin mutation involves altered AMPA-receptor trafficking

S Chanda et al. Mol Psychiatry. 2016 Feb.

Abstract

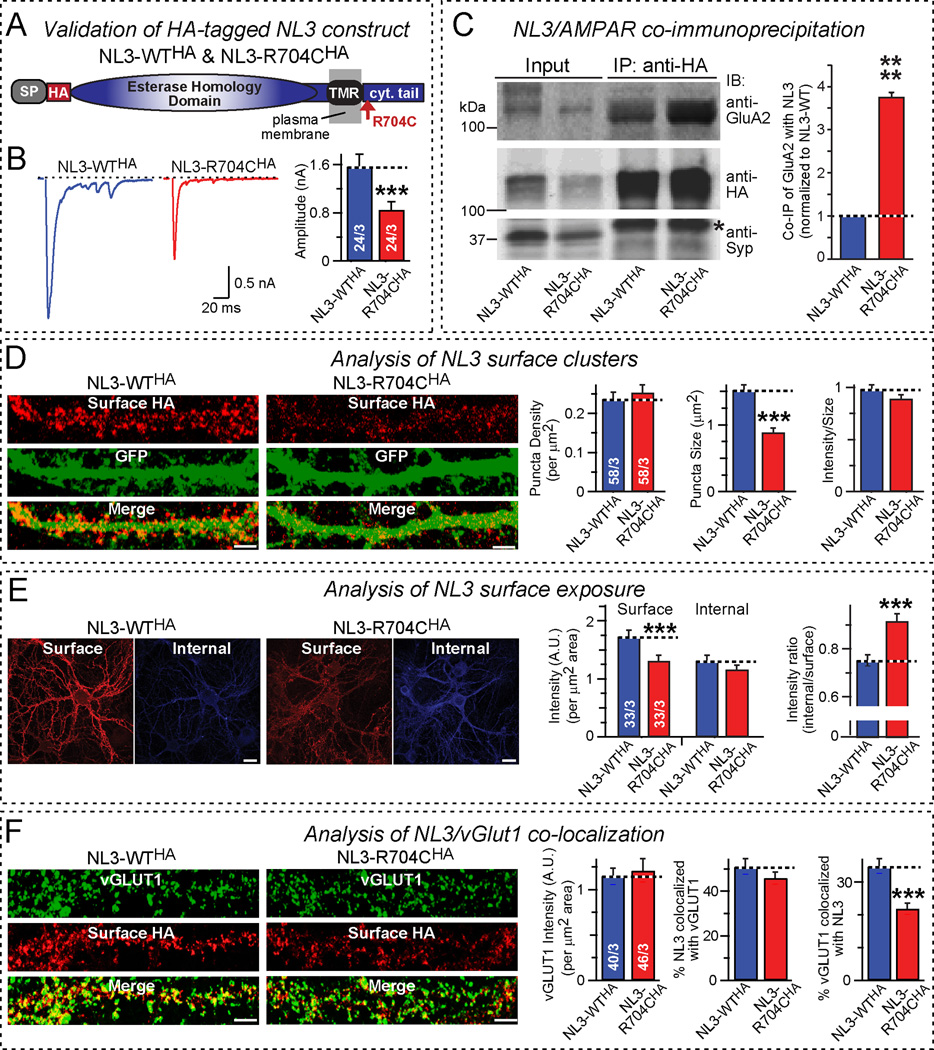
Neuroligins are postsynaptic cell-adhesion molecules that bind to presynaptic neurexins. Although the general synaptic role of neuroligins is undisputed, their specific functions at a synapse remain unclear, even controversial. Moreover, many neuroligin gene mutations were associated with autism, but the pathophysiological relevance of these mutations is often unknown, and their mechanisms of action uninvestigated. Here, we examine the synaptic effects of an autism-associated neuroligin-4 substitution (called R704C), which mutates a cytoplasmic arginine residue that is conserved in all neuroligins. We show that the R704C mutation, when introduced into neuroligin-3, enhances the interaction between neuroligin-3 and AMPA receptors, increases AMPA-receptor internalization and decreases postsynaptic AMPA-receptor levels. When introduced into neuroligin-4, conversely, the R704C mutation unexpectedly elevated AMPA-receptor-mediated synaptic responses. These results suggest a general functional link between neuroligins and AMPA receptors, indicate that both neuroligin-3 and -4 act at excitatory synapses but perform surprisingly distinct functions, and demonstrate that the R704C mutation significantly impairs the normal function of neuroligin-4, thereby validating its pathogenicity.


Conflict of interest statement

CONFLICT OF INTEREST

The authors declare no conflict of interest.

Figures

Figure 1
Figure 1. NL3 R704C-knockin selectively impairs AMPAR-mediated synaptic responses in cultured hippocampal neurons
A-C, R704C-knockin impairs AMPAR-mediated excitatory postsynaptic currents (EPSCs; A) but not NMDAR-mediated EPSCs (B) or GABAAR-mediated inhibitory postsynaptic currents (IPSCs; C). Analyses were performed in hippocampal neurons cultured from newborn littermate WT and NL3 R704C-knockin mice (left, representative traces; right, summary graphs). D & E, R704C-knockin decreases the frequency and amplitude of excitatory (D; mEPSCs) but not of inhibitory (E; mIPSCs) spontaneous postsynaptic currents. Recordings were performed in hippocampal neurons cultured from newborn littermate WT and NL3 R704C-knockin mice in the presence of tetrodotoxin (1 µM; left, representative traces; right, summary graphs of the mini amplitude [top] and frequency [bottom]). Data shown are means ± SEM; statistical significance was assessed by Student’s t-test (**, p<0.01; ***, p<0.001). Numbers of neurons/independent cultures analyzed are shown in the bars. For additional data, see Fig. S2.
Figure 2
Figure 2. NL3 R704C-knockin decreases surface AMPARs and increases AMPAR endocytosis
A, R704C mutation decreases the size but not the density of surface GluA1-receptor puncta, as visualized by immunocytochemistry in non-permeabilized hippocampal neurons cultured from littermate WT and NL3 R704C-knockin mice (left, representative images; right, summary graphs of the GluA1 puncta density and size). B, R704C knockin mutation decreases the size of AMPA-induced EPSCs in cultured hippocampal neurons (left, representative traces; middle, cumulative probability plots and summary graph of the AMPA-induced EPSC charge; right, same for the EPSC amplitude). C, Measurements of GluA1-receptor internalization by a two-stage labeling protocol that separately visualizes surface (green) and internalized GluA1-receptors (red). Representative images are shown on the left, and a summary graph of the fraction of internalized GluA1-receptor on the right. Data shown are means ± SEM; statistical significance was assessed by Student’s t-test (*, p<0.05; ***, p<0.001). Numbers of independent cultures (A) or of neurons/independent cultures analyzed (B and C) are shown in the bars.
Figure 3
Figure 3. Expression of NL3-R704C in wild-type neurons phenocopies NL3 R704C-knockin mutation
A, Measurements of AMPAR- and NMDAR-mediated EPSCs and of IPSCs in WT olfactory bulb neurons that were globally infected with a control lentivirus or lentiviruses expressing NL3-WT or NL3-R704C as indicated (left, representative traces; right, summary graphs). After lentiviral infection, all neurons express the lentivirally encoded proteins. B, Same as A, except that recordings were performed in sparsely transfected neurons, such that a single transfected neuron containing the control or NL3 expression plasmid is surrounded by non-transfected neurons. C, Measurements of spontaneous AMPAR-mediated miniature EPSCs (mEPSCs; top) or of miniature IPSCs (mIPSCs; bottom) in sparsely transfected olfactory bulb neurons containing a control plasmid or NL3 expression plasmids as indicated. Data shown are means ± SEM; statistical significance was assessed by Student’s t-test (*, p<0.05; **, p<0.01; ***, p<0.001). Numbers of analyzed neurons/ independent cultures are shown in the bars. For additional data, see Figs. S3 and S4.
Figure 4
Figure 4. R704C mutation increases NL3 interaction with AMPARs and decreases NL3 surface expression
A, Domain structures of HA-tagged NL3 proteins used for analyzing the effects of the R704C mutation on NL3/AMPAR interactions and on NL3 surface expression. B, Lentiviral expression of HA-tagged NL3-R704C decreases AMPAR-mediated EPSCs in cultured hippocampal neurons similar to untagged NL3-R704C (left, representative traces; right, summary graph of EPSC amplitudes). C, NL3 co-immunoprecipitates with AMPARs: R704C mutation enhances co-immunoprecipitation. Proteins were solubilized with Triton X-100 from hippocampal neurons infected with lentiviruses expressing HA-tagged NL3-WT and NL3-R704C, and NL3 was immunoprecipitated with HA antibodies. Input fractions and immunoprecipitates were immunoblotted for the AMPAR GluA2 subunit, for HA (to detect NL3), and for synaptophysin (Syp) as a negative control (left, representative blot [asterisk = IgG heavy chain]; right, quantification of the relative levels of GluA2 in the immunoprecipitates normalized for that in the WT NL3 sample; n=3 independent experiments). D, R704C mutation decreases the size but not density or staining intensity of postsynaptic NL3 clusters. Non-permeabilized neurons were probed with an antibody to HA to selectively label surface NL3 after lentiviral co-expression of HA-tagged NL3-WT or NL3-R704C with EGFP (left, representative images [red, HA labeling; green, EGFP fluorescence]; scale bars = 5 µm; right, summary graphs of the density [left], the size [middle], and the HA-labeling intensity [right] of HA-positive postsynaptic puncta). E, R704C mutation shifts NL3 localization from the surface to the cell interior. HA-tagged surface NL3 was immunostained in non-permeabilized neurons co-expressing NL3-WT or NL3-R704C with EGFP with an HA antibody under conditions that saturate surface-exposed HA epitopes. Neurons were then permeabilized and probed with a second HA antibody to label internal HA-tagged NL3, and the ratio of internal to surface NL3 was calculated; note that absolute surface and internal NL3 values cannot be compared because different primary and secondary antibodies were used (left, representative images; right, summary graphs of the surface and internal signal for HA-tagged NL3 (left), and of the ratio of internal and surface-exposed NL3 (right); scale bars = 15 µm). For a detailed protocol, see Fig. S5. F, R704C mutation decreases the synaptic NL3 levels, as monitored by co-localization with the synaptic vesicle protein vGLUT1. Surface HA-NL3 was immunostained without permeabilization as in D & E, then vGLUT1 was immunostained after permeabilization (left, representative images, right, summary graphs showing: total vGLUT1 intensity [left], percentage of NL3 co-localization with vGLUT1 [middle], and percentage of vGLUT1 co-localized with NL3 [right]; scale bars = 5 µm). Data shown are means ± SEM; statistical significance was assessed by Student’s t-test (***, p<0.001; ****, p<0.0001). Numbers of neurons/ independent cultures analyzed are shown in the bars.
Figure 5
Figure 5. NL4 R704C-mutation abolishes the suppression of excitatory glutamatergic synaptic responses by NL4-WT
A, Suppression of excitatory synaptic responses by NL4-WT in hippocampal neurons is abolished by the NL4 R704C-mutation. Neurons were infected with a control lentivirus or lentiviruses expressing WT or R704C-mutant NL4, and AMPAR- (top) and NMDAR-mediated evoked EPSCs (middle) as well as GABAAR-mediated IPSCs (bottom) were analyzed (left, representative traces; right, summary graphs of postsynaptic current amplitudes. B, NL4-R704C increases the total surface levels of AMPARs, whereas NL4-WT has no effect. EPSCs induced by locally puffing AMPA (50 µM for 100 ms) onto a neuron were measured in lentivirally infected hippocampal neurons (left, representative traces; right, summary graphs of the integrated EPSC charge transfer). C, R704C mutation does not affect NL4 surface localization (same experiment as Figs. 4D and 4E, except HA-tagged WT-NL4 and R704C-NL4 were probed). Left panels depict representative images (scale bars = 5 µm), and right panels summary graphs of the density and size of surface HA-positive puncta (left and middle graphs, respectively), and of the intensity ratio of internal vs. surface HA-immunofluorescence (right graph). D, R704C mutation does not affect NL4 synaptic localization (same experiment as Fig. 4F, but for HA-tagged NL4-WT and NL4-R704C). Left panels depict representative images (scale bars = 2 µm), and right panels summary graphs of the vGLUT1 intensity (left), percentage of NL4 co-localization with vGLUT1 (middle), and percentage of vGLUT1 co-localization with NL4 (right). Data shown in summary graphs are means ± SEM; statistical significance was assessed by Student’s t-test (*, p<0.05; **, p<0.01; ***, p<0.001). Numbers of neurons/independent cultures analyzed are shown in the bars.

References

    1. Sudhof TC. Neuroligins and neurexins link synaptic function to cognitive disease. Nature. 2008;455:903–911. - PMC - PubMed
    1. Ichtchenko K, et al. Neuroligin 1: a splice site-specific ligand for beta-neurexins. Cell. 1995;81:435–443. - PubMed
    1. Ichtchenko K, Nguyen T, Sudhof TC. Structures, alternative splicing, and neurexin binding of multiple neuroligins. J Biol Chem. 1996;271:2676–2682. - PubMed
    1. Bolliger MF, et al. Unusually rapid evolution of Neuroligin-4 in mice. Proc Natl Acad Sci U S A. 2008;105:6421–6426. - PMC - PubMed
    1. Song JY, Ichtchenko K, Sudhof TC, Brose N. Neuroligin 1 is a postsynaptic cell-adhesion molecule of excitatory synapses. Proc Natl Acad Sci U S A. 1999;96:1100–1105. - PMC - PubMed

Publication types

MeSH terms

Substances