. 2015 May 14;521(7551):217-221.
doi: 10.1038/nature14215. Epub 2015 Mar 16.

YAP is essential for tissue tension to ensure vertebrate 3D body shape

Affiliations

YAP is essential for tissue tension to ensure vertebrate 3D body shape

Sean Porazinski et al. Nature. .

Abstract

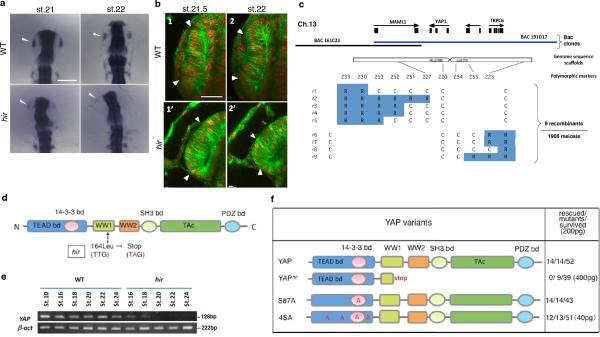
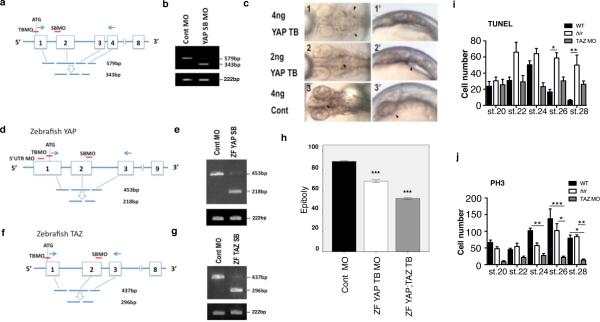
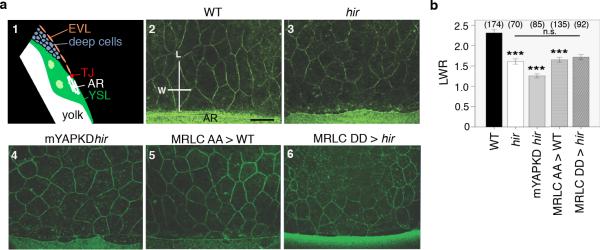
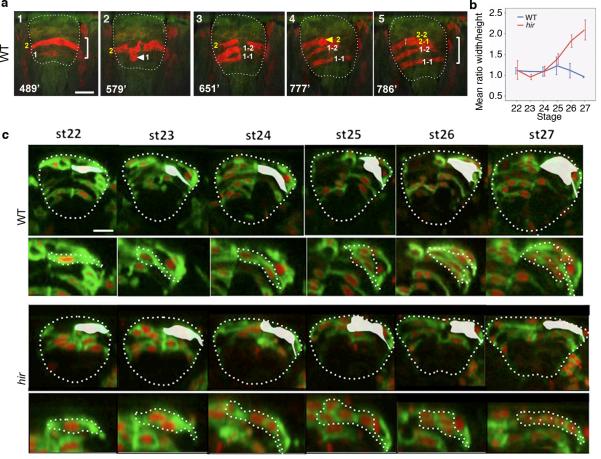
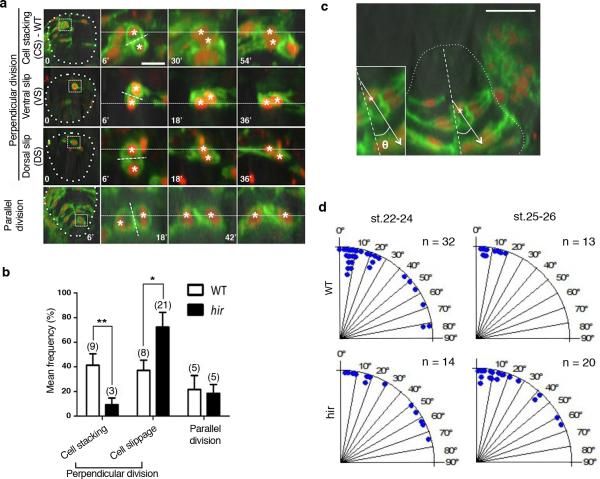
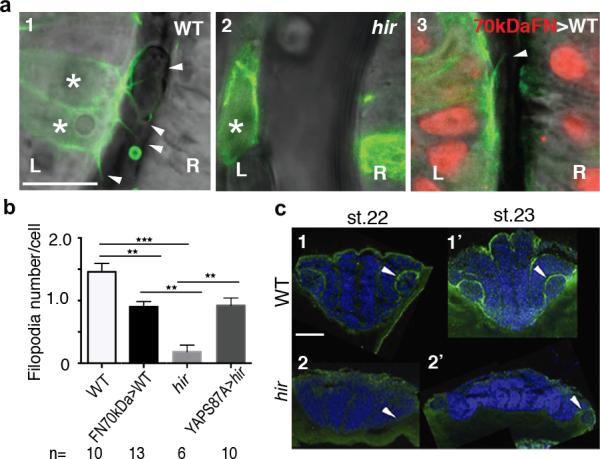
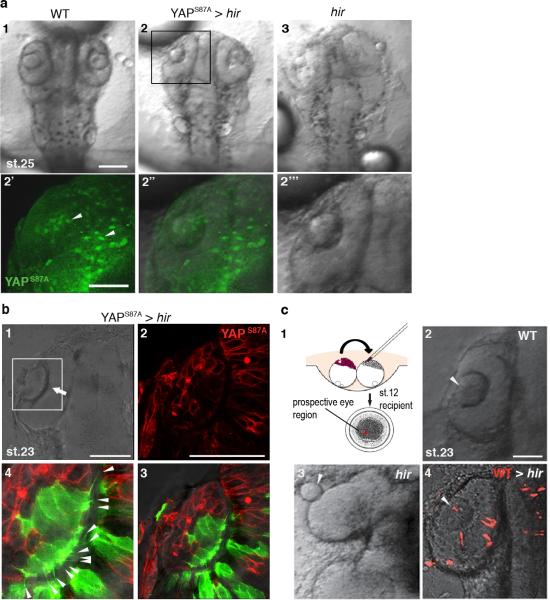
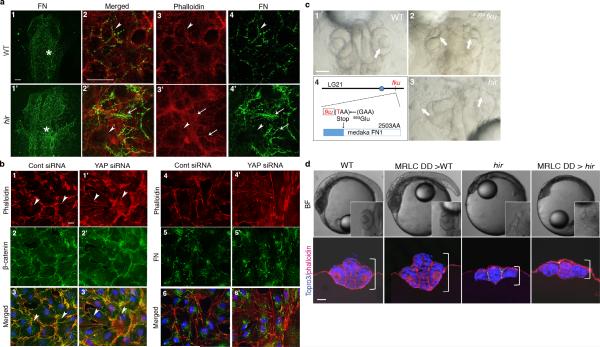
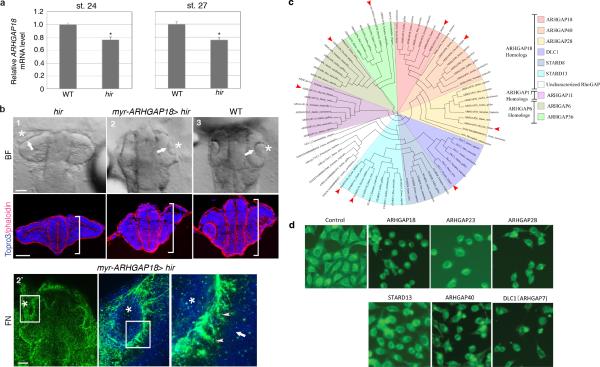
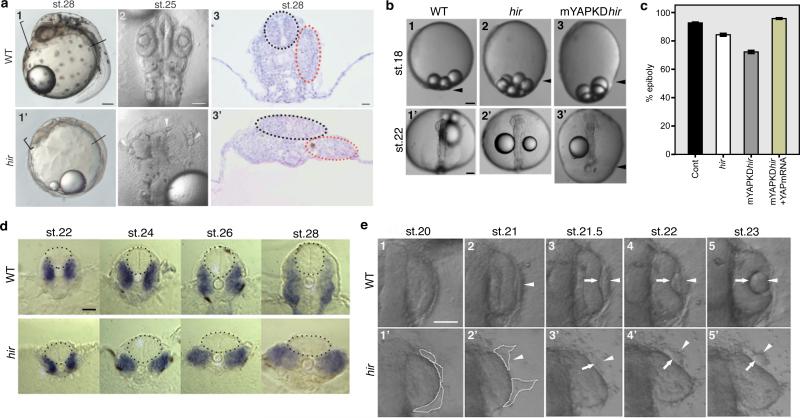
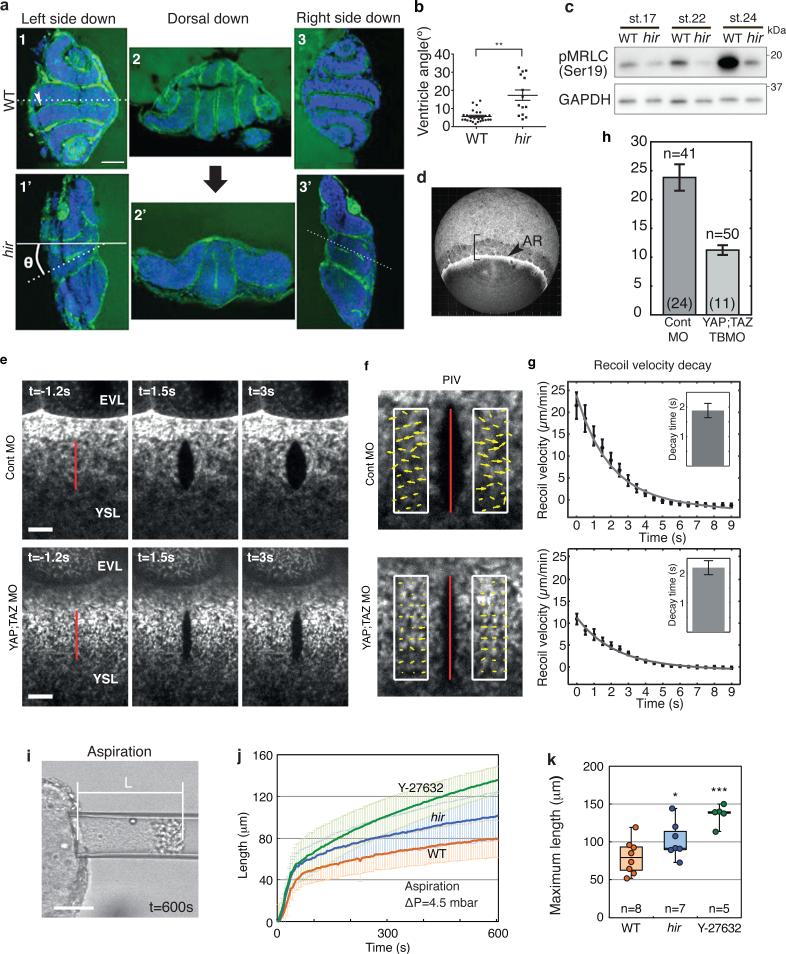
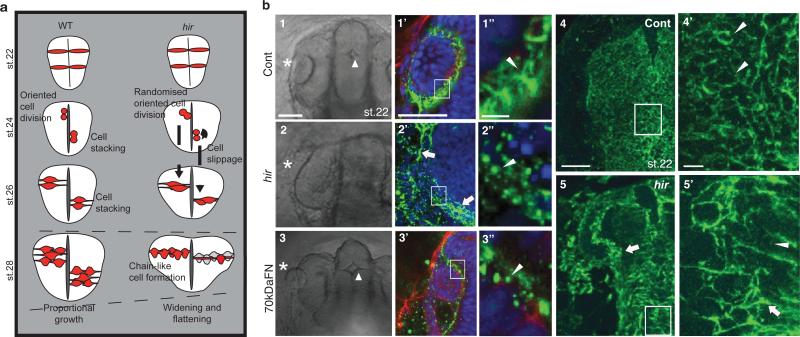
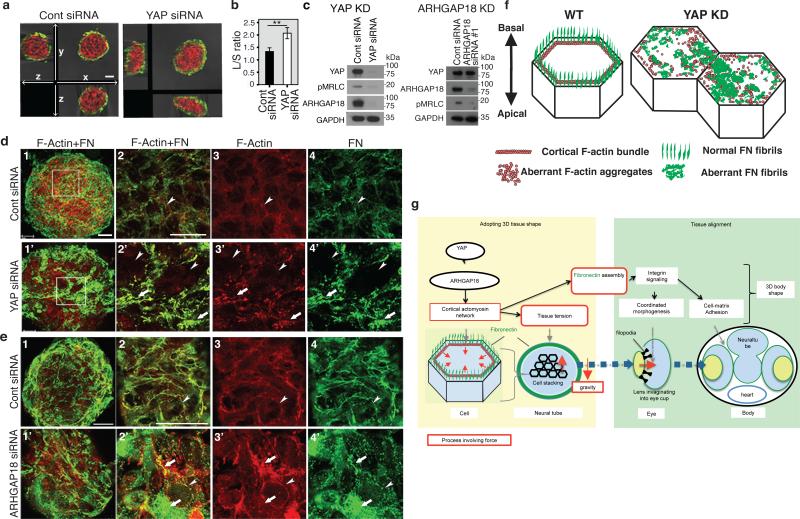
Vertebrates have a unique 3D body shape in which correct tissue and organ shape and alignment are essential for function. For example, vision requires the lens to be centred in the eye cup which must in turn be correctly positioned in the head. Tissue morphogenesis depends on force generation, force transmission through the tissue, and response of tissues and extracellular matrix to force. Although a century ago D'Arcy Thompson postulated that terrestrial animal body shapes are conditioned by gravity, there has been no animal model directly demonstrating how the aforementioned mechano-morphogenetic processes are coordinated to generate a body shape that withstands gravity. Here we report a unique medaka fish (Oryzias latipes) mutant, hirame (hir), which is sensitive to deformation by gravity. hir embryos display a markedly flattened body caused by mutation of YAP, a nuclear executor of Hippo signalling that regulates organ size. We show that actomyosin-mediated tissue tension is reduced in hir embryos, leading to tissue flattening and tissue misalignment, both of which contribute to body flattening. By analysing YAP function in 3D spheroids of human cells, we identify the Rho GTPase activating protein ARHGAP18 as an effector of YAP in controlling tissue tension. Together, these findings reveal a previously unrecognised function of YAP in regulating tissue shape and alignment required for proper 3D body shape. Understanding this morphogenetic function of YAP could facilitate the use of embryonic stem cells to generate complex organs requiring correct alignment of multiple tissues.


Figures

Extended Data Figure 1
Extended Data Figure 1. YAP is mutated in hir mutants
a, In situ hybridization of sox3 showed that the lens placode (arrowhead) is specified in hir mutant embryos (n=3) at st.21. At st.22, the nascent lens invaginated in WT (n=21), but did not in hir mutant embryos (n=13, arrowhead). b, Two frames from time-lapse imaging of retina of embryos injected with membrane EGFP and nuclear RFP (MNFP) mRNAs. In WT (n=10), the nascent lens invaginates from st.21 (1, margins of the lens indicated by arrowheads with retina to the right), whereas in hir (n=7) the lens mostly detached from the retina (2’, arrowheads show lens remnants attached to the retina). Scale bars: 80 μm in a; 30 μm in b. c, Nine recombinants in 1908 meiosis mapped hir close to the YAP gene on chromosome 13 (R: recombinant, C: non-recombinant embryos). d, YAP cDNA encodes six protein binding domains/motifs and one transcription activation (TAc) domain; a non-sense mutation in WW1 domain in hir. e, RT-PCR analysis of YAP mRNA during development. β-actin as control. f, mRNA of normal YAP and its variants were injected into hir mutants. The numbers represent: hir phenotype rescue judged via brain thickness, heart migration and Cuvier's duct formation; mutants (judged by genotyping when necessary); survived injected embryos of hir (+/−) crosses. High dose (400 pg) mRNA of YAPhir variant was injected into WT embryos to examine dominant-negative effects. The rescue by YAP4SA variant required only 20% of the amount required to rescue using normal YAP mRNA.
Extended Data Figure 2
Extended Data Figure 2. Morpholino knock-down in medaka and zebrafish
a, Design of medaka YAP TB and SB MOs relative to translation start (ATG), exons (numbered boxes) and introns. Primers (arrows) used to assess the efficiency of SB MO KD. b, Upper panel, proper splicing of YAP transcripts (579 bp) was nearly fully blocked (343 bp, <5% of normal level) by YAP SB MO (5 ng), assessed by RT-PCR; Lower panel, β-actin control. c, WT embryos injected with YAP TB MO and standard control MO. 1-3 dorsal and 1’-3’ lateral views (also Supplementary Table 1). Arrowheads indicate location of heart progenitors. Body flattening and bilateral cardiac progenitor cell migration was affected in a dose-dependent manner. 2, 2’, Bilateral cardiac progenitor cells fused at the midline but did not migrate anteriorly; 1, 1’ their migration arrests next to the ears at the high dose. The two distinct YAP morpholinos (YAP TB and SB MOs) mimicked the hir phenotype in a dose-dependent manner. To further verify specificity of the YAP MOs, YAP TB MO was co-injected with human YAP mRNA that does not hybridize with the YAP TB MO. Injection of YAP TB (but not YAP SB) MO into hir mutant embryos enhanced the blastopore closure phenotype of hir mutants (Fig. 1b,c, Supplementary Table 2). These maternal YAP KD hir mutant embryos failed to close the blastopore. Less than half the amount (2 ng) of YAP TB MO was required for causing this phenotype in hir mutants compared to that required for WT embryos (5 ng). This blastopore closure phenotype was rescued by medaka YAP mRNA (200 pg) co-injection. d-g, Zebrafish (ZF) WT embryos injected with three distinct ZFYAP MOs (TB, 5’UTR and SB) exhibit the blastopore closure phenotype as in medaka (Supplementary Table 3). Efficiencies of ZF YAP and TAZ SB MO KD (1.5 ng each) were assessed by RT-PCR using primers in d, f, respectively as in a, b. As reported by Gee et al., co-injection of ZF YAP mRNAs did not rescue the ZF YAP MO phenotype in zebrafish. h, Co-injection of ZF TAZ MO (total 2 ng) enhanced slow epiboly of YAP TB KD-injected embryos; control = 89±4.16% (n=20), YAP KD = 70.09±4.7% (n=11), YAP/TAZ KD = 52.5±2.64% (n=10). Error bars show ± S.E.M. ***P < 0.001, one-way ANOVA. i, j, TUNEL for cell death and phosphohistone H3 (PH3) antibody staining for cell proliferation (see methods for sample sizes). Stained cells in the neural tube were counted. Error bars indicate ± S.E.M. *P < 0.05, **P < 0.01, ***P < 0.001, one-way ANOVA (Extended Data Figure 2 source data).
Extended Data Figure 3
Extended Data Figure 3. Anisotropic EVL cell shape analysis in hir mutants
a, 1, Schematic of sectional view of blastoderm margin of a gastrulating embryo (TJ, tight junction; AR actin ring; YSL, yolk syncytial layer; EVL, enveloping layer); 2-6, EVL shape was visualized in phalloidin-stained fixed medaka embryos at 75% epiboly (st.16, 21 hpf) and compared among, 2 WT (n=14); 3 hir (n=9); 4 maternal YAP KD hir mutants (mYAPKDhir,) by TB MO-injection into hir embryos (n=12), 5 MRLC-AA (dominant negative form) mRNA-injected WT (n=6); and 6, MRLC-DD (constitutive active form) mRNA-injected hir embryos (n=4). b, EVL shape anisotropy quantification by the length/width ratio (LWR, shown in a2) of marginal EVL cells (up to 4 rows back from the EVL/YSL boundary, shown in Fig. 2d bracket). While EVL shape anisotropy was reduced in hir mutant embryos (3) to a level comparable to that of MRLC blocked embryos (5), activation of MRLC in hir (6) did not rescue it. Parentheses indicate number of cells measured. Scale bar 30 μm. Error bars represent ± S.E.M. ***P < 0.001, one-way ANOVA (Extended Data Figure 3 source data).
Extended Data Figure 4
Extended Data Figure 4. Flattening of the hir neural tube is associated with string-like cell arrangements
a, Increasing height [indicated by brackets in (1) and (5)] of WT neural tube (outlined, n=10) was associated with cell stacking. Time in minutes from st.21 shown bottom left of each sub-panel. Red fluorescent cells, e.g. cell 1 in (1), labeled by photo-converting Kaede fluorescent protein, rounded up at the ventricular zone [arrowhead in (2)] and divided along the ventricular zone [perpendicular cell division in (3)] to generate stacked daughter cells 1-1, 1-2, making the neural tube thicker in (5). b, Width/height ratio of spinal cord, measured from time-lapse imaging of single embryos (WT, hir n=3 each), showed that flattening occurred progressively in hir. Error bars are ± S.E.M. (Extended Data Figure 4 source data). c, Single-cell tracking of clones (labeled by membrane-GFP and nuclear-RFP) of the growing neural tube at the level of the fifth somite. Lower panels for WT and hir show magnified views of shaded regions in upper panels. The flatter and wider neural tube of the hir mutant at st.27 was associated with long chain-like cell arrangements (asterisks, bottom panels of hir) tracked from a single neuroepithelial cell at st.22, as compared with the thick cell group generated by cell stacking in WT embryos. Scale bars, 40 μm.
Extended Data Figure 5
Extended Data Figure 5. Flattening of the hir neural tube is associated with cell stacking failure
Single-cell analysis in hir neural tube shows cell stacking failure occurred after mitosis (a, b) and during mitosis (c, d). Neural progenitor cells divided with spindle orientation “perpendicular” or “parallel” to the ventricular zone (“perpendicular” or “parallel” cell division, respectively). a, While daughter cells (asterisks) in WT remained stacked after 45 minutes following perpendicular cell division (first row), those in hir exhibited cell slippage (second and third rows). Telophase neuroepithelial cells in the neural tube, first column; magnified views in second to fourth columns. Dotted lines show division planes. Two types of cell slippage were observed: ventral slippage (VS) where the dorsal daughter cell slipped towards the ventral (second row), and dorsal slippage (DS) where the ventral daughter cell slipped towards the dorsal (third row). After parallel cell division, daughter cells did not change their positions in hir (fourth row). b, Cell stacking was reduced and cell slippage increased after perpendicular cell division, but cells after parallel cell division remained unaltered in hir mutants. Cell numbers in parentheses. Error bars, ± S.E.M. *P < 0.05, **P < 0.01, t-test (Extended Data Figure 5 source data). c, During perpendicular mitosis, daughter cells did not stack properly in hir mutants. Cell division orientation (θ) was measured in time-lapse sequences as the acute angle of the telophase cell axis against that of the ventricular zone (e.g. dotted line 26° in a). d, Rose diagrams showing frequency and angle of parallel cell divisions. At st.25-26 (50-54 hpf) perpendicular cell divisions generated stacked cells against gravitational forces in WT (n=3 embryos at both stages). Far fewer stacked cells were observed in hir (n=4 embryos at st.22-24, n=3 embryos at st.25-26). These results are illustrated in Fig. 3a. Scale bars, 15 μm in a, 40 μm in c.
Extended Data Figure 6
Extended Data Figure 6. Detachment of lens is associated with loss of filopodia in hir
a, Representative live images of filopodia (arrowheads) from single lens cells (asterisks) expressing lifeact-GFP in a mosaic manner; (1) WT, (2) hir and (3) 70kDaFN mRNA-injected WT embryos at st.21.5 when lenses are detaching in hir mutants (see Extended Data Figure 1b for larger views). (3) Non-mosaic expression of 70kDaFN mRNA in WT embryos was confirmed by co-injected H2A-RFP in the nucleus (red). L, lens; R retina. b, Filopodia number/cell was compared (see Extended Data Fig. 7b4 for YAPS87A injected hir embryos). n, number of analyzed embryos. Error bars indicate ± S.E.M. **P < 0.01, ***P < 0.001, one-way ANOVA (Extended Data Figure 6 source data). c, Transverse section of integrin-β1 IHC. Strong integrin-β1 localisation between lens and retina in st.22 WT (n=2) (1, arrowhead); no such localisation in hir (n=3) (2). At st.23 in hir (n=3), weak localisation where rounded up lens reattached to retina (2’, arrowhead). Scale bars, 10 μm in a; 40 μm in c.
Extended Data Figure 7
Extended Data Figure 7. The hir mutation acts cell non-autonomously
a, Mosaic expression of EGFP-YAPS87A by mRNA injection at 16-cell stage in hir mutant embryos rescued the hir eye phenotype in (2) as compared to (1) WT and (3) hir. The boxed area in (2) is magnified in the lower panels (2’-2’’’) fluorescence, merged and bright-field views, respectively. Arrowheads in 2’ indicate EGFPYAPS87A expressing clones. b, Non-cell autonomous rescue of filopodia in hir mutant lens cells. YAPS87A+ mCherry-CAAX (labels membrane red) mRNA, and Lifeact-EGFP mRNA (labels F-actin green) were injected into different cells at 8-16 cell stage. (1) In the invaginated (arrow) hir mutant lens (boxed area magnified in 2 and 3, n=10) rescued by mosaic expression of YAPS87A (red), YAPS87A non-expressing mutant cells recovered filopodia (arrowheads in 4, magnified view of 3). Filopodia number/cell was compared between WT and hir in Extended Data Figure 6b. c, (1) Cells from donor embryos injected with rhodamine (red, top left) were transplanted to a recipient embryo (top right, blastula stage st.12) at the location fated to be eyes (bottom, animal pole view). (2) WT, (3) hir and (4) WT cells transplanted into hir mutant eye, causing the lens (arrowhead) to invaginate into the retina as in WT at st.23 (note that this confocal sectional view represents a fraction of transplanted cells in the whole eye, see Supplementary Table 4 for the frequency of rescue). Scale bars, 40 μm.
Extended Data Figure 8
Extended Data Figure 8. F-actin and FN localizations in hir
a, Whole-mount imaging of WT (n=5) and hir (n=4) embryos stained for F-actin (red) and FN (green). (1, 1’) whole dorsal view of embryos anterior up, only FN shown; (2-4, 2’-4’) magnified view of area indicated by asterisks in (1, 1’); merged (2, 2’), F-actin (3, 3’) and FN (4, 4’). Arrowheads indicate cortical F-actin and FN fibrils in WT and corresponding region in hir (3, 4, 3’, 4’); arrows show ectopic F-actin aggregates and aberrant FN fibrils in (3’, 4’). b, Immunostaining of 2D cultured RPE1 cells transfected with control (Cont, n=21) and YAP siRNAs (n=19) stained with Phalloidin (1, 1’), β-catenin (2, 2’) and merged with DAPI (3, 3’); Phalloidin (4, 4’), FN (5, 5’) and merged with DAPI (6, 6’). In marked contrast to the 3D spheroids, FN deposits were not altered in YAP KD cells (5, 5’) despite of increased F-actin stress fibers (1, 1’ and 4, 4’). c, The medaka fku mutants exhibit lens mislocation (arrows). Live dorsal view of the head of (1) WT, (2) fku and (3) hir mutant embryos at st.24. (4) The fku mutation was mapped to LG21 to the region encompassing the FN1 gene (0 recombinants/1130 meiosis). Positional cloning identified a non-sense mutation of 593Glu (GAA to TAA) in FN1 (2503 amino acids). FN1 morpholino KD in WT embryos mimicked the fku mutant phenotype. d, Constitutive-active MRLC-DD mRNA markedly increased body thickness of WT embryos, but did not rescue the flattened body (brackets in lower panels) and dislocated lens phenotypes of hir (n=48). Upper panels, live lateral view (insets, dorsal views of left eyes); lower panels, frontal sections stained with Phalloidin (red) and TO-PRO-3 (blue) at st.25. Scale bars 30 μm, except a2, 15 μm and b, 50 μm.
Extended Data Figure 9
Extended Data Figure 9. in vivo analysis of ARHGAP18 function
a, Quantitative RT-PCR analysis showed that ARHGAP18 mRNA expression in the hir mutant is significantly reduced to 76% of WT level. EF1α as an internal control. Data are shown as means ± S.E.M. [n=10 each; *P < 0.001 Student's t-test (two-tailed)]. b, myrARHGAP18 mRNA (150 pg) injection rescued the hir phenotype (21 rescued/39 hir/112 survived embryos). Upper panels, live dorsal view; lower panels, frontal sections stained with Phalloidin (red) and TO-PRO-3 (blue) at st.23; (1) uninjected hir, (2) injected hir and (3) WT. The lens (asterisk) invaginated into retina (arrows, upper panel) and the neural tube became thicker (brackets in lower panels) in the myrARHGAP18 mRNA-injected hir mutant embryos. (2’) FN staining of myrARHGAP18 mRNA-injected hir mutant embryos; boxed area magnified in subsequent panel to the right; invaginated lenses had fine FN fibrils (arrowheads) between lens and retina as in WT (see Fig. 3b1”). c, Phylogenetic analysis identified 16 ARHGAP18 paralogs in vertebrate lineages. Arrowheads show medaka orthologs. d, siRNA screening of 40 human ARHGAP genes in HeLa cells showed that knock-down of five ARHGAP genes exhibited the rounding up phenotype similar to ARHGAP18 inactivation,
Figure 1
Figure 1. Organ/tissue collapse and misalignment in hir mutants
a, 1, 1’, Lateral view of live wild-type (WT) and hir mutant embryos, anterior to the left. Arrowheads: heart. Brackets: embryo thickness; 2, 2’, Dorsal view, anterior upwards. Arrowheads: mislocated lenses; 3, 3’ Transverse section at the plane shown in 1 and 1’. Neural tubes (black dots) and somites (red dots). b, 1-3 lateral and 1’-3’ dorsal views of live embryos. Arrowheads: blastoderm margin. Epiboly quantified (%) in (c). Error bars ± S.E.M. (**P < 0.01, ***P < 0.001; one-way ANOVA with Dunnett's T3 post hoc. Figure 1 source data). d, Transverse sections at 5th somite level, neural tube (encircled) and somites (blue) by myoD in situ hybridization. e, Time-lapse sequence of dorsal view of WT and hir mutant right eyes. Arrowheads: lens placode; arrows: invaginating retina. Fragmented and detaching lens placode demarcated by dotted lines in 1’ and 2’. Scale bars: 40 μm.
Figure 2
Figure 2. Tissue tension is reduced in hir mutants
a, Embryos kept left side down (1, 1’), dorsal facing down (2, 2’) and right side down (3, 3’) from st.17 - 26, stained with phalloidin (green, F-actin) and TO-PRO-3 (blue, nucleus). Large black arrow: direction of gravity, θ: angle that the tangent along the brain ventricle (dotted lines in 1, 1’) makes with horizontal solid line. b, Range of collapse of mutant and WT embryos kept sideways. Error bars: ± S.E.M. **P < 0.01, t-test (Figure 2 source data). c, Immunoblotting of phospho-myosin regulatory light chain (pMRLC, Ser19) and control (GAPDH) (Supplementary Figure 1). d, Actomyosin-labelled Tg(actb1:myl12.1-eGFP) zebrafish embryos at 75% epiboly. Arrowhead: YSL actomyosin ring (AR) at the margin of the EVL. Bracket: for analysis of EVL shape anisotropy (Extended Data Fig. 3a). e, The actomyosin ring was cut along a 20 μm-long-line (red) perpendicular to the EVL/YSL boundary in MO-injected embryos, when control MO injected embryos were at 70-80% epiboly. f, Particle image velocimetry (PIV) quantifies the velocity field (yellow arrows) of the recoiling actomyosin network. g, Averaged temporal recoil velocity curves, control MO (n=41) and YAP;TAZ KD conditions (n=50). Error bars: error of the mean at 95% confidence. Exponential fit function with a linear offset (black solid line) yields the characteristic decay time (inset) and h, the initial recoil velocity for the control MO (23.8±2.3 μm/min) and YAP;TAZ KD conditions (11.2±0.8 μm/min). Error bars: 95% confidence interval for the fit results. i, Snapshot at the end of aspiration (600 sec) of st.22 neural tube with constant pressure (ΔP=4.5 mbar). j, The curves of the tongue length over time to measure the aspiration of WT, hir mutant and ROCK inhibitor (Y27632) treated neural tube explants. Error bars: ± S.D. Maximum tongue length measured at 600 sec were compared by t-test in k. Box plots represent 5%, 25%, median, 75%, and 95%. *P < 0.05, ***P < 0.001. Scale bars, 40 μm in a, i, 10 μm in e.
Figure 3
Figure 3. Cell and tissue dynamics in hir mutants
a, Schematic: hir neural tube collapse is associated with long chain-like arrangements of neuroepithelial cells generated by increased cell slippage and randomized oriented cell division (Extended Data Fig. 4, 5). b, Whole-mount FN immunohistochemistry (IHC) of st.22 embryos, dorsal view, anterior to the top. 1-1”, Cont (control), WT embryos injected with out-of-frame 70kD N-terminal medaka FN1a+1b mRNA (250 pg) (n=20); 2-2”, uninjected hir mutants (n=11); 3-3”, WT embryos injected with N-terminal 70kDa FN1a+1b mRNA (250 pg) (n=39). 1-3, left anterior head of live embryos (asterisks, lens; triangle, forebrain ventricle); 1’-3’, left eye of FN IHC (green), boxed area magnified in 1”-3”; 4, 5, surface view of FN stained neural tube, WT (n=15) and hir (n=14) corresponding to the region in 1 and 2, respectively, boxed area magnified in 4’ and 5’. Arrowheads: FN fibrils/puncta, arrows: FN large deposits. Scale bars, 40 μm in b1, 1’, 4; 5 μm in b1’’, 4’.
Figure 4
Figure 4. YAP regulation of tissue tension and FN assembly is mediated by ARHGAP18
a, b, Confocal 3D sectioning of longest and shortest axes of YAP and control (cont) KD RPE1 spheroids (n=5, 7) after centrifugation. b, Ratio of longest (L)/shortest (S) axes. Error bars: ± S.E.M. **P < 0.05, t-test (Figure 4 source data). c, Immunoblotting of YAP and ARHGAP18 KD spheroids for the indicated proteins (Supplementary Figure 1). d, e Whole-mount imaging of basal surfaces of spheroids transfected with control siRNA (n=17), YAP siRNA (n=13), and ARHGAP18 siRNA (n=15), stained for F-actin (red) and FN (green). 2-4 magnified view of boxed areas in 1. Arrowheads: cortical regions; arrows: ectopic F-actin aggregates and aberrant FN fibrils. f, Schematic; fine extracellular FN fibrils form in close proximity to cortical F-actin in normal cells, while in YAP and ARHGAP18 KD cells, FN fibrils are reduced and aberrant FN deposits coincide with ectopic F-actin aggregates. g, Schematic summarizing how YAP/ARHGAP18-dependent actomyosin network contraction controls tissue shape and alignment. Scale bars, 40 μm in a; 30 μm in d1, e1; 15 μm in d2, e2.

Comment in

  • Crumbling under pressure.
    Mason FM, Martin AC. Mason FM, et al. Dev Cell. 2015 Apr 20;33(2):122-4. doi: 10.1016/j.devcel.2015.04.005. Dev Cell. 2015. PMID: 25898164

References

    1. Chauhan BK, et al. Cdc42- and IRSp53-dependent contractile filopodia tether presumptive lens and retina to coordinate epithelial invagination. Development. 2009;136:3657–3667. - PMC - PubMed
    1. Nelson CM, Bissell MJ. Of extracellular matrix, scaffolds, and signaling: tissue architecture regulates development, homeostasis, and cancer. Annu. Rev. Cell Dev. Biol. 2006;22:287. - PMC - PubMed
    1. Mammoto T, Ingber DE. Mechanical control of tissue and organ development. Development. 2010;137:1407–1420. - PMC - PubMed
    1. Thompson DA. On Growth and Form. Cambridge University Press; 1917. pp. 1–1136.
    1. Furutani-Seiki M, et al. Neural degeneration mutants in the zebrafish, Danio rerio. Development. 1996;123:229–239. - PubMed

Publication types

MeSH terms