. 2015 Mar 16;208(6):839-56.
doi: 10.1083/jcb.201409026.

PAPC mediates self/non-self-distinction during Snail1-dependent tissue separation

Affiliations

PAPC mediates self/non-self-distinction during Snail1-dependent tissue separation

Olivia Luu et al. J Cell Biol. .

Abstract

Cleft-like boundaries represent a type of cell sorting boundary characterized by the presence of a physical gap between tissues. We studied the cleft-like ectoderm-mesoderm boundary in Xenopus laevis and zebrafish gastrulae. We identified the transcription factor Snail1 as being essential for tissue separation, showed that its expression in the mesoderm depends on noncanonical Wnt signaling, and demonstrated that it enables paraxial protocadherin (PAPC) to promote tissue separation through two novel functions. First, PAPC attenuates planar cell polarity signaling at the ectoderm-mesoderm boundary to lower cell adhesion and facilitate cleft formation. Second, PAPC controls formation of a distinct type of adhesive contact between mesoderm and ectoderm cells that shows properties of a cleft-like boundary at the single-cell level. It consists of short stretches of adherens junction-like contacts inserted between intermediate-sized contacts and large intercellular gaps. These roles of PAPC constitute a self/non-self-recognition mechanism that determines the site of boundary formation at the interface between PAPC-expressing and -nonexpressing cells.


Figures

Figure 1.
Figure 1.
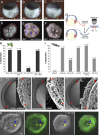
Snail1 function in tissue separation. (A–C) Brachet’s cleft in sagittally fractured stage 10.5 Xenopus gastrulae. Uninjected embryos (A); cleft (between red arrowheads) is shortened by Xsnail1-MO (B), but not Xsnail1-MO/Xsnail1 mRNA coinjection (C). Yellow arrows indicate the blastopore. C, chordamesoderm; P, prechordal mesoderm; L, leading edge mesendoderm; n, number of embryos. (D–F) BCR assay for separation behavior in Xenopus. Prechordal mesoderm explants injected with control Sna1-misMO (D), Xsnail1-MO (E), or Xsnail1-MO and Xsnail1 mRNA (F) are placed on explanted BCR. Explants sunken after 1 h in E are indicated by arrowheads. (G) Outline of BCR assay. (H) Quantitation of BCR assay. Y axis, percentage of test explants remaining on surface; n, number of explants. (I–K) Tissue separation in zebrafish. (I) Quantitation of separation behavior as in H. (J) Brachet’s cleft in live embryos (left panels) and SEM micrographs (right panels) at 75% epiboly in wild-type and snai1a-misMO– and snail1a MO–injected embryos. Red arrowheads indicate Brachet’s cleft; n, number of embryos. (K) In vitro assay, differential interference contrast images, and fluorescence overlay images at explanation (left) and 45 min later (right). Epiblast test explant (blue arrowheads) sinks into the epiblast, and fluorescent hypoblast explant (yellow arrowheads) remains on the surface.
Figure 2.
Figure 2.
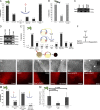
Xfz7 signaling regulates Xsnail1 expression and separation behavior. (A) Quantitative analysis of tissue separation as in Fig. 1 (H and I). Mesoderm was injected as indicated (symbols as in the text). (B) In situ hybridization for Xsnail1 RNA in stage 10.5 Xenopus gastrulae; dorsal halves of sagittally fractured embryos are shown. Red arrowheads indicate blastopore; differences in morphology caused by effects of treatments on gastrulation movements. (C) RT-PCR of dorsal mesoderm from stage 10.5 gastrulae to detect Xsnail1 mRNA. (D) snail1a in situ hybridization in zebrafish. Expression is normal in uninjected and mgfp RNA–injected embryos, reduced in DN-RhoA embryo (black arrowheads), and rescued in embryo coinjected with DN-RhoA and CA-JNK mRNA. Xfz7ΔC injected into one of eight blastomeres (white arrowheads) and dvl2-MO inhibit Snail1a expression. (E) Inferred pathway of Snail1 expression control by Fz7.
Figure 3.
Figure 3.
PAPC in tissue separation. (A and B) Quantitation of separation behavior; Xenopus (A) and zebrafish (B) mesoderm test explants on BCR/epiblast. (C and D) RT-PCR of variously injected Xenopus BCR at stage 10 to detect Xsnail1 or PAPC mRNA. TB WE, tailbud stage whole embryo. (E) Ectopic separation behavior in Xenopus BCR. Variously injected BCR test explants were placed on uninjected BCR. (F) Inferred control pathway. (G–L) Ectopic cleft formation in Xenopus BCR. One side of prospective BCR was injected with RDA, cleft was observed in incident light (arrowheads, top), and cell sorting in red fluorescence (bottom). n, number of explants. (M) Quantitation of separation behavior. (left) Xenopus mesoderm on PAPC-injected BCR; (right) M-PAPC BCR on uninjected or M-PAPC BCR. (N) Tissue surface tension of uninjected BCR or BCR expressing DN C-cadherin or M-PAPC. n, number of cell aggregates. Standard deviations are indicated.
Figure 4.
Figure 4.
Cleft contact formation. (A) Reaggregation of normal (FDA labeled) and M-PAPC–expressing (RDA) BCR cells. Arrowheads indicate example of cleft contact; blue and yellow dots and arrows indicate gliding movement; cell groups move apart in the direction of the red arrows. (B) Reaggregating prechordal mesoderm (RDA) and BCR (FDA) cells. Gliding of cells marked as in A. (C) Frequency of cleft contacts after 30 min of reaggregation. 95% confidence intervals indicated; n, number of cell pairs. (D) Expansion of initial cleft contact (arrows) between reaggregating ectoderm and mesoderm cells. (E) Exemplary kymographs of cell contacts in reaggregated cells quantitated in C. Black arrows indicate the position of cell–cell contact. White or gray, close contact; dark, cleft contact (pointed out by white arrows when only occasionally present).
Figure 5.
Figure 5.
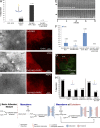
PAPC-dependent PCP inhibition at boundary. (A and B) Quantitation of tissue separation using Xenopus (A) and zebrafish (B) mesoderm test explants. (C) Inferred control pathway. (D–F) Localization of Dvl2-GFP and Pk1-venus in Xenopus. Yellow arrowheads indicate puncta in mesoderm (green); white arrowheads indicate boundary to ectoderm; ectoderm is labeled with membrane-RFP (red). 27 (E) and 20 (F) explant boundaries were evaluated in I. (G and H) Behavior of Dvl-GFP puncta at boundary to ectoderm in normal (G) or PAPC-MO–injected mesoderm (H). Arrowheads: blue, puncta appears, moves to interior, and disappears; yellow, moves to interior and stays; green, stable puncta; purple, cluster of fusing puncta. Of a total of 27 (G) or 18 (H) explant boundaries, 4 and 3, respectively, were filmed. (I) Puncta per cell at boundary. n, number of cells examined at 9–27 different explant boundaries per experimental treatment. Standard deviations indicate variability between individual cells. Averages are increased significantly compared with mesoderm Dvl-GFP or Pk1-venus at boundary (first two columns; t test, P < 0.0001 in all cases) except M-PAPC in ectoderm (last column, P = 0.111).
Figure 6.
Figure 6.
PCP function strengthens cell adhesion. (A–C) Prechordal mesoderm explants. Frames from time-lapse recordings of membrane-RFP–labeled cells migrating over each other. White arrowheads indicate membrane tethers in Pk1-MO or Dvl2-MO explants; yellow arrowheads indicate lamellipodia. n, number of explants. (D–F) Prechordal mesoderm in SEM images of sagittally fractured gastrulae. Extensions similar to membrane tethers in A–C are frequent in Pk1-MO or Dvl2-MO embryos (arrowheads). n, number of embryos. (G) Tissue surface tension in prechordal mesoderm is decreased by Pk1-MO and increased by ephrinB1-MO. Standard deviations are indicated. n, number of aggregates from a single experiment. (H) Normal mixing (arrowheads) of left and right prechordal mesoderm cells (RDA and FDA labeled) across midline. (I) Cells respect sorting boundary (arrowheads) when Pk1-MO is injected into the RDA side. n, number of embryos.
Figure 7.
Figure 7.
PAPC function beyond PCP inhibition is required for cleft formation. (A) Quantitation of separation in gain-of-function experiment. BCR was injected as indicated. (B–D) Ectopic cleft formation in the BCR, as in Fig. 3 (G–L). (E) Exemplary kymographs of cleft contact formation, as in Fig. 4 E. (F) Frequency of cleft contacts after reaggregation, as in Fig. 4 C. (G) Reduced Dvl-GFP puncta in EphB4-MO–injected mesoderm (green) at boundary to BCR (red, membrane-RFP in ectoderm). (H) Quantitation of separation behavior. (left) Mesoderm injected as indicated was tested on normal BCR. (right) BCR explants injected as indicated were tested on normal BCR. (I) Model of tissue separation at the mesoderm–ectoderm (BCR) boundary.
Figure 8.
Figure 8.
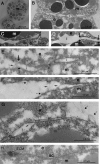
Ultrastructure of Brachet’s cleft. (A) Low-magnification view of Brachet’s cleft. ECM stained with LN. Note size differences of yolk platelets (y) in mesoderm versus ectoderm. (B–E) Contacts between ectoderm and mesoderm cell in absence of ECM staining. Boxes in B indicate regions shown at higher magnification in D–E. e, ectodermal BCR; m, prechordal mesoderm; l, large gaps; i, intermediate, gap-like contacts; c, close, adherens junction–like contacts. Arrows in D indicate point of divergence of membranes at end of intermediate contact and in E indicate characteristics of adherens junctions at high cadherin density.
Figure 9.
Figure 9.
Ultrastructure of cleft contacts. Cells after 20 min of reaggregation. (A) Pair of mesoderm (large yolk platelets) and ectoderm cells (small platelets). (B) Alternating large gaps and narrow contacts between cells of ectoderm–mesoderm pair. (C and D) High-magnification views of regions of close (C) and intermediate contacts (D), respectively, of a cell pair. (E and F) Cleft contact ECM stained with lanthanum/alcian blue. ECM stretching across gaps (small arrows) or in patches on cell surface and in large gaps (dashed arrows) is shown. (G and H) Contacts between normal ectoderm and PAPC-MO–injected prechordal mesoderm cells, ECM stained with lanthanum/alcian blue. e, ectodermal BCR; m, prechordal mesoderm; l, large gaps; i, intermediate contacts; c, close, adherens junction–like contacts; sc, super-close contacts; large arrows, points of divergence of membranes at end of intermediate contacts.
Figure 10.
Figure 10.
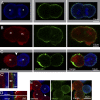
Actin cortex at cleft contacts. (A–C) Ectoderm–ectoderm (A), mesoderm–mesoderm (B), and ectoderm–mesoderm (C) reaggregating cells filled with cascade blue–dextran (blue; ectoderm) or RDA (red; mesoderm) and stained with fluorescein-tagged phalloidin for F-actin cortex labeling. Arrowhead in C indicates a cleft contact. (C’) High-magnification view of part of cleft contact in C; small arrows indicate gap largely covered by phalloidin staining; large arrow indicates gap remaining between cortices of adjacent cells. (D) Z stack of cleft contact; F-actin staining (bottom) is peripheral to RDA (top and bottom) boundary (arrowheads) both above cleft (top arrowheads) and in cleft (bottom arrowheads). (E) GFP-LifeAct (green) in gap (arrowhead) between living mesoderm and ectoderm cells labeled as in A–D.

Comment in

Similar articles

Cited by

References

    1. Barrallo-Gimeno A., and Nieto M.A.. 2005. The Snail genes as inducers of cell movement and survival: implications in development and cancer. Development. 132:3151–3161 10.1242/dev.01907 - DOI - PubMed
    1. Bikkavilli R.K., Feigin M.E., and Malbon C.C.. 2008. Gαo mediates WNT–JNK signaling through dishevelled 1 and 3, RhoA family members, and MEKK 1 and 4 in mammalian cells. J. Cell Sci. 121:234–245 10.1242/jcs.021964 - DOI - PubMed
    1. Boutros M., Paricio N., Strutt D.I., and Mlodzik M.. 1998. Dishevelled activates JNK and discriminates between JNK pathways in planar polarity and wingless signaling. Cell. 94:109–118 10.1016/S0092-8674(00)81226-X - DOI - PubMed
    1. Bruce A.E., Howley C., Zhou Y., Vickers S.L., Silver L.M., King M.L., and Ho R.K.. 2003. The maternally expressed zebrafish T-box gene eomesodermin regulates organizer formation. Development. 130:5503–5517 10.1242/dev.00763 - DOI - PubMed
    1. Bucior I., and Burger M.M.. 2004. Carbohydrate–carbohydrate interactions in cell recognition. Curr. Opin. Struct. Biol. 14:631–637 10.1016/j.sbi.2004.08.006 - DOI - PubMed

Publication types