. 2015 Apr 20;43(7):3747-63.
doi: 10.1093/nar/gkv194. Epub 2015 Mar 16.

Identification of U2AF(35)-dependent exons by RNA-Seq reveals a link between 3' splice-site organization and activity of U2AF-related proteins

Affiliations

Identification of U2AF(35)-dependent exons by RNA-Seq reveals a link between 3' splice-site organization and activity of U2AF-related proteins

Jana Kralovicova et al. Nucleic Acids Res. .

Abstract

The auxiliary factor of U2 small nuclear RNA (U2AF) is a heterodimer consisting of 65- and 35-kD proteins that bind the polypyrimidine tract (PPT) and AG dinucleotides at the 3' splice site (3'ss). The gene encoding U2AF35 (U2AF1) is alternatively spliced, giving rise to two isoforms U2AF35a and U2AF35b. Here, we knocked down U2AF35 and each isoform and characterized transcriptomes of HEK293 cells with varying U2AF35/U2AF65 and U2AF35a/b ratios. Depletion of both isoforms preferentially modified alternative RNA processing events without widespread failure to recognize 3'ss or constitutive exons. Over a third of differentially used exons were terminal, resulting largely from the use of known alternative polyadenylation (APA) sites. Intronic APA sites activated in depleted cultures were mostly proximal whereas tandem 3'UTR APA was biased toward distal sites. Exons upregulated in depleted cells were preceded by longer AG exclusion zones and PPTs than downregulated or control exons and were largely activated by PUF60 and repressed by CAPERα. The U2AF(35) repression and activation was associated with a significant interchange in the average probabilities to form single-stranded RNA in the optimal PPT and branch site locations and sequences further upstream. Although most differentially used exons were responsive to both U2AF subunits and their inclusion correlated with U2AF levels, a small number of transcripts exhibited distinct responses to U2AF35a and U2AF35b, supporting the existence of isoform-specific interactions. These results provide new insights into function of U2AF and U2AF35 in alternative RNA processing.


Figures

Figure 1.
Figure 1.
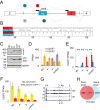
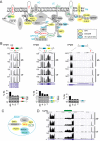
Genome-wide identification of U2AF(35)-dependent exons. (A) Alternative splicing of U2AF1 and location of SSOs. Exons are shown as boxes, introns as horizontal lines, SSOs as black rectangles across 3′ss and spliced products (a, b, c, s) as dotted lines. (B) Nucleotide (upper panel) and amino acid (lower panel) sequences of alternatively spliced U2AF1 exons. Amino acids are numbered at the bottom. (C) HinfI digested RT-PCR products showing the relative abundance of U2AF1 isoforms in depleted samples (upper panel) and immunoblot with antibodies against U2AF35 and tubulin (lower panels). ab-, depletion of both isoforms using siRNA U2AF35ab (30 nM); a-, depletion of U2AF35a (60 nM); b-, depletion of U2AF35b (60 nM); a-b-, depletion of U2AF35 using equimolar mixtures of isoform-specific siRNAs; siRNAs were as described (14,23). Ctr, a scrambled control. (D) Normalized expression of U2AF1 and U2AF2 genes in depleted cultures and controls. FPKM, fragments per kilobase of exon model per million reads. Error bars in panels D–F are 95% confidence intervals. U2AF1/U2AF2 ratios in ab-, a-, b- and control cultures were 0.09, 0.43, 1.47 and 2.25, respectively. (E) Normalized expression of U2AF1 isoforms. (F) Normalized expression of U2AF2 isoforms. Extra amino acids included in U2AF65 as a result of alternative GC 5′ss usage are in parentheses. (G) A genome browser view of exon Ab- and 3-containing isoforms in depleted cells (ab-) and controls (ctr). Exons are numbered at the top and corresponding isoforms are shown at the bottom. Browser views are in the native gene orientation throughout; the 5′>3′ transcriptional orientation is denoted by the > sign. (H) Significant sharing of genes identified by DEXSeq (exon-level) and Cufflinks (gene-level) as differentially expressed in ab- cultures versus controls.
Figure 2.
Figure 2.
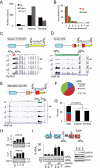
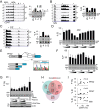
Characterization of global changes in APA induced by U2AF35 depletion. (A) Distribution of start, internal and terminal exons upregulated and downregulated in cells depleted of U2AF35. P-value was derived from a χ2-test for the 3×2 contingency table. P-value for the first exons versus the pool of internal and terminal exons was <10−7. (B) A high proportion of transcripts with ≥2 differentially expressed exons. (C-E) APA site usage in the indicated APA categories. Number of proximal and distal APA sites altered in depleted cells is shown above arrows that indicate shifts in APA site usage. APAP, APAD, proximal and distal polyadenylation sites. Upregulated and downregulated exons are indicated by red and green rectangles throughout. Each category is schematically shown at the top; yellow rectangles are 3′UTRs, blue boxes are constitutive exons, red and pink boxes are alternative exons. Splicing is denoted by dotted lines. (F) Frequency distribution of APA categories altered in ab- cells. (G) Breakdown of start, internal and terminal exons for Cufflinks-positive genes. APA/5′ss, altered APA or 5′ss of the first intron in ab- cells; ATI, annotated alternative transcription initiation sites altered in ab- cultures. P-value was computed as in panel A. (H) Validation of intronic/alternative 3′ss APA site usage in two plant homology domain-encoding genes shown in panels D and E. PCR primers are in Supplementary Table S4. (I) Control of mouse intronic APA site usage by human U2AF35. Schematics of the mouse IgM minigene with APA sites giving rise to membrane (APAD) and soluble (APAP) immunoglobulins M (upper panel). Del, deletion of the RNA polymerase II (polII) pausing site (100). The lower panel shows RNA products of the wild-type and deletion-containing IgM minigenes transfected into HEK293 cells individually depleted of each U2AF subunit. Final concentration of U2AF65 siRNA was 40 nM. Immunoblot is to the right.
Figure 3.
Figure 3.
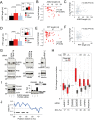
Structural and functional characterization of U2AF(35)-dependent 3′ss. (A, D) AGEZ (A) and PPT (D) length of alternative 3′ss (inset) and internal exons affected by U2AF35 depletion. Columns show means, error bars denote SDs. The number of each event is in the legend to Supplementary Figure S8. PPT length was computed for BPs with the highest SVM scores (41). P-values were derived from t-tests; ****P < 0.00005; **P < 0.005. AGEZ and PPT length correlated with the expression change of upregulated (B, E) but not downregulated (C, F) exons; r, Pearson correlation coefficient. (G) Immunoblots prepared from lysates from HEK293 cells depleted of poly(Y)-binding proteins (indicated at the top). Antibodies are shown at the bottom or to the right. (H) Functional antagonism and synergism of Y-binding proteins and U2AF. Exon inclusion levels of each transcript are in Supplementary Figure S11; RT-PCR primers are in Supplementary Table S4. Residual protein levels (RPL) were estimated from immunoblots shown in panel G. The Y-axis is on a log10 scale. Average changes between inclusion levels of upregulated and downregulated exons were compared by the Wilcoxon-Mann-Whitney test (*P < 0.05; **P < 0.005; ***P < 0.0005; ****P < 0.00005; NS: not significant; -: not tested). (I) Opposite effects of PUF60 depletion and overexpression on a GANAB exon. Immunoblots with the indicated antibodies are to the left and RT-PCR to the right. The GANAB minigene is schematically shown at the top; alternative exon is denoted by a white rectangle. Exogeneous RNA products were amplified by primers PL3 and PL4. Error bars are SDs of duplicate transfections. (J) Positional differences in unpaired probabilities upstream of U2AF(35)-activated and repressed exons. Positive delta PU values signify a higher average single-strandedness of upregulated exons in the optimal BP location and further upstream as compared to downregulated exons whereas negative values reveal their tendency to engage in local base-pairing interactions closer to 3′ss. Stars denote positions with P-values <0.05.
Figure 4.
Figure 4.
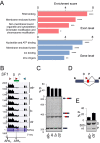
U2AF(35)-regulated exons are overrepresented in genes encoding RNA-binding proteins. (A) Functional enrichment analysis using DAVID (35). Asterisks denote the FDR significance (*P < 0.05; **P < 0.005; ***P < 0.0005; ****P < 0.00005). (B) Regulation of alternative 3′ss site usage of SF1 by U2AF(35). P, D, proximal and distal 3′ss of the last SF1 intron. Arrowheads denote RT-PCR primers (Supplementary Table S4) used in panel C. The last track shows unified 3′-seq coverage from multiple tissues with the location of two APA sites (45). Supplementary Figure S12 shows their usage in various cell types; the proximal APA site is used only weakly in HEK293 cells. (C) Activation of distal 3′ss SF1 in depleted cells. RNA products are schematically shown to the right. Error bars denote SDs. (D) Schematics of the SF1 minigene. Arrowheads show primers used for RT-PCR in panel E. (E) RNA products of the SF1 minigene. Transient transfections were into HEK293 cells (mock)-depleted of U2AF35.
Figure 5.
Figure 5.
Examples of U2AF(35)-regulated genes involved in cytoskeleton organization and chromatin modification. (A) Exon-centric regulation of actin dynamics. Protein products are drawn as colored shapes in a cellular context. Red and green text shows genes that were upregulated and downregulated in ab- cells, respectively; blue text denote protein complexes or subcellular structures: PM, plasma membrane; MF, microfilaments; SP, spectrin; AC, ankyrin complex; JC, junctional complex. EI, exon inclusion; ES, exon skipping; IR, intron retention. Actin monomers are schematically shown as small circles. ITG shapes denote multiple integrins upregulated and downregulated in ab- cultures (Supplementary Table S3). (B) Identification of U2AF(35)-sensitive exons in the tropomyosin genes (upper panels) and their validation by RT-PCR (lower panels). Restriction enzymes to establish the identity of mutually exclusive exons are indicated to the right; small fragments of digested products are not shown. Alternative exons are coloured, arrowheads denote PCR primers. (C) Components of the SAGA complex influenced by U2AF35 depletion. A legend for colored shapes is in panel A. (D) A genome browser view of a differentially used APA in a representative SAGA transcript. Additional SAGA transcripts are shown in Supplementary Figure S5F and S5G.
Figure 6.
Figure 6.
Evidence for distinct function of alternatively spliced U2AF35 isoforms. (A-C) Genome browser views of endogenous transcripts showing isoform-specific responses to U2AF35 depletion (left panels) and their validation using RT-PCR (right panels). (D) NIN exon inclusion levels in the indicated depletions. Final concentration of siRNAs was 6.7, 20 and 60 nM. Error bars are SDs. (E) Schematics of the PFN2 minigene. Chromatogram illustrates transcripts spliced to the cryptic 5′ss of intron 2 (Cr); P, D, proximal and distal 3′ss. (F) Opposite effects of U2AF35a and U2AF35b on splice-site selection in exogenous PFN2 transcripts. Spliced products are shown in panel E. (G) Isoform-specific rescue of 3′ss of PFN2 intron 2. The amount of rescue plasmid DNA was 20, 65 and 200 ng. Immunoblot with Xpress (U2AF35ex) and β-actin antibodies is shown in the lower panel. (H) Three-way Venn diagram showing overlaps of differentially expressed genes/exons (q < 0.05) in ab-, a- and b- depletions versus controls. Gene lists are in Supplementary Tables S2 and S3. (I) Exon/proximal 3′ss usage in the indicated transcripts (y axis) and residual U2AF heterodimer levels (x axis) estimated from a transfection experiment shown in Supplementary Figure S3.

Similar articles

Cited by

References

    1. Wahl M.C., Will C.L., Lührmann R. The spliceosome: design principles of a dynamic RNP machine. Cell. 2009;136:701–718. - PubMed
    1. Shcherbakova I., Hoskins A.A., Friedman L.J., Serebrov V., Correa I.R., Jr, Xu M.Q., Gelles J., Moore M.J. Alternative spliceosome assembly pathways revealed by single-molecule fluorescence microscopy. Cell Rep. 2013;5:151–165. - PMC - PubMed
    1. Ruskin B., Zamore P.D., Green M.R. A factor, U2AF, is required for U2 snRNP binding and splicing complex assembly. Cell. 1988;52:207–219. - PubMed
    1. Zamore P.D., Green M.R. Identification, purification, and biochemical characterization of U2 small nuclear ribonucleoprotein auxiliary factor. Proc. Natl Acad. Sci. U.S.A. 1989;86:9243–9247. - PMC - PubMed
    1. Zorio D.A., Blumenthal T. Both subunits of U2AF recognize the 3′ splice site in Caenorhabditis elegans. Nature. 1999;402:835–838. - PubMed

Publication types