. 2015 Apr 6;212(4):469-80.
doi: 10.1084/jem.20132423. Epub 2015 Mar 16.

Infiltration of circulating myeloid cells through CD95L contributes to neurodegeneration in mice

Affiliations

Infiltration of circulating myeloid cells through CD95L contributes to neurodegeneration in mice

Liang Gao et al. J Exp Med. .

Abstract

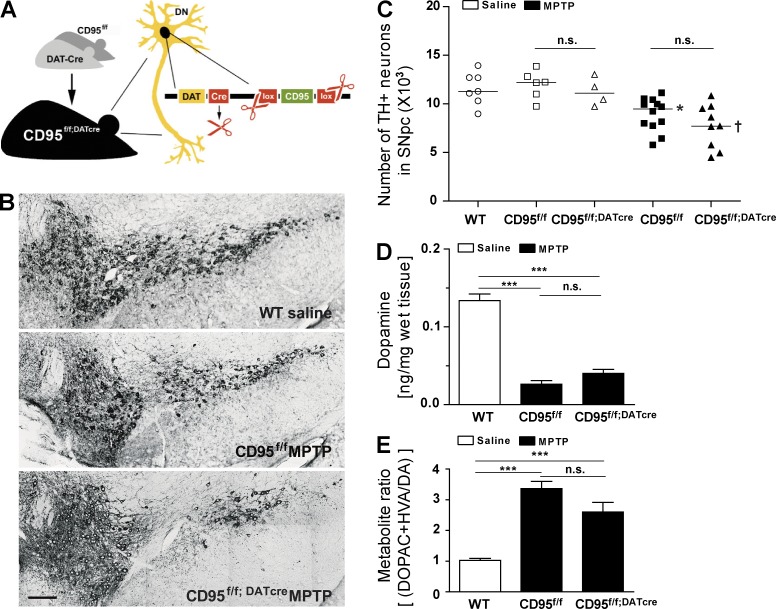
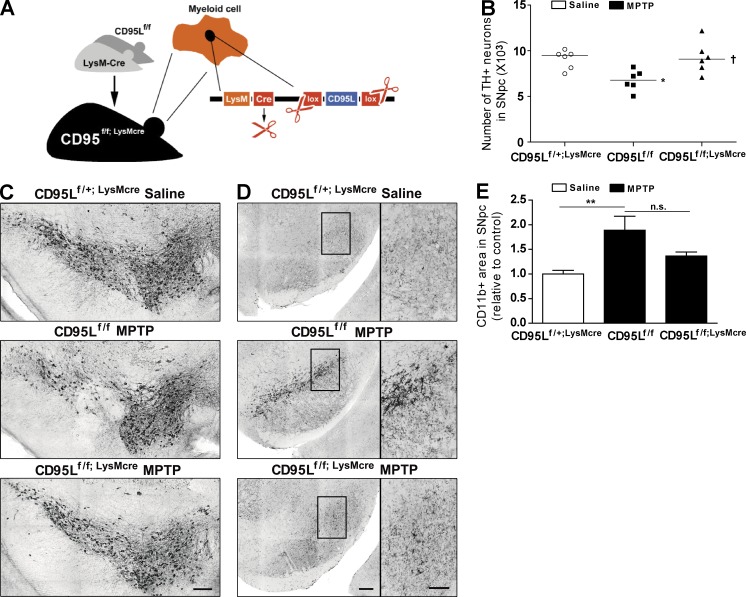
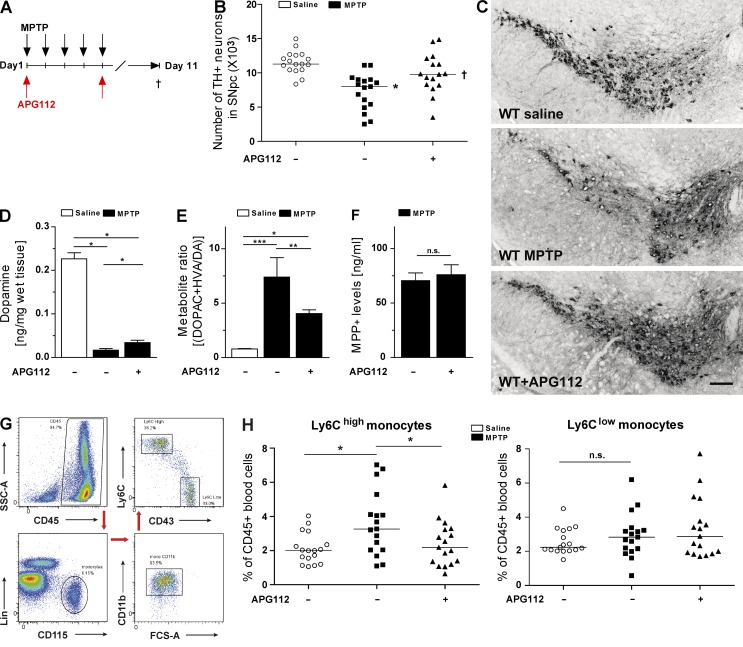
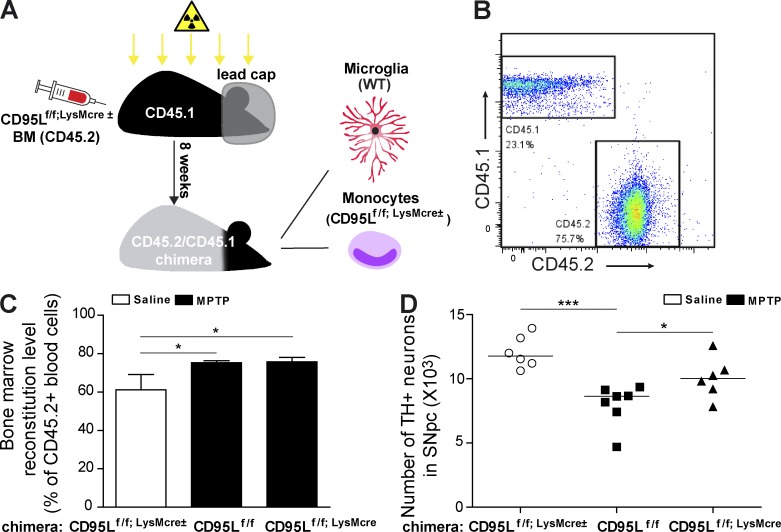
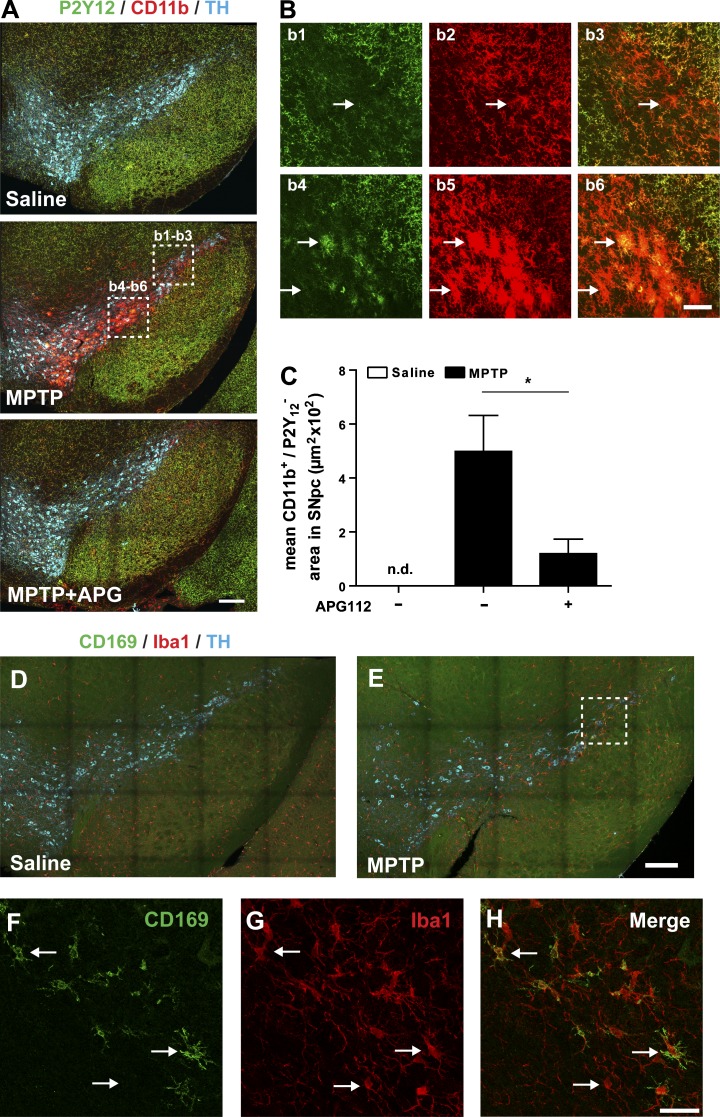
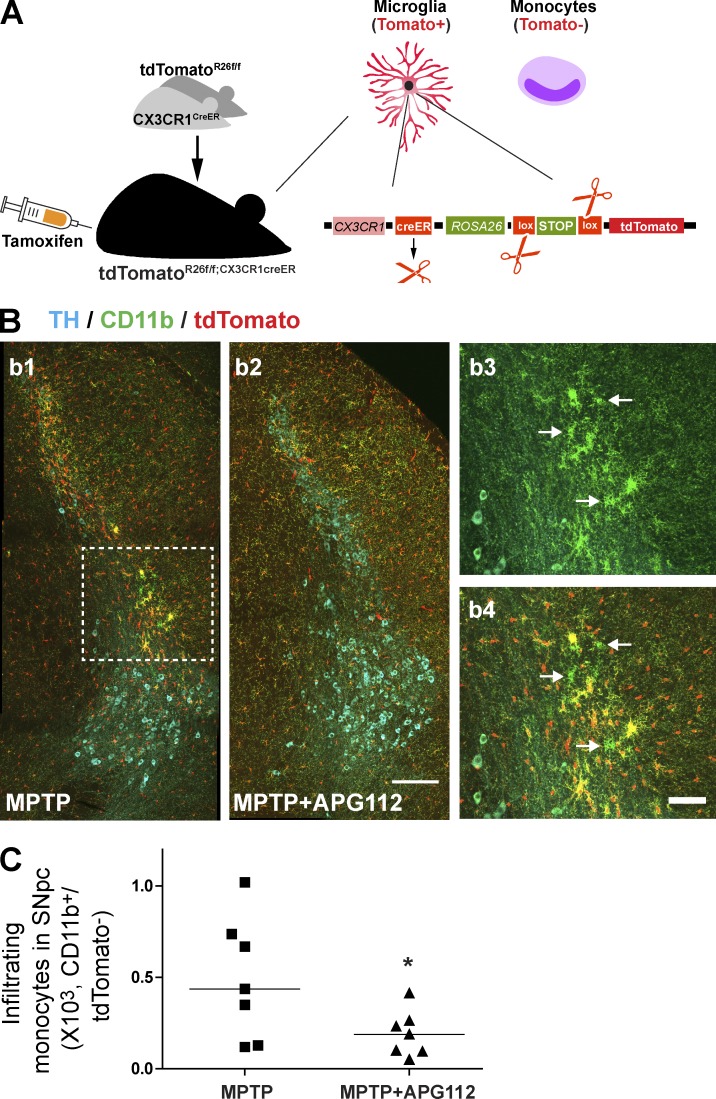
Neuroinflammation is increasingly recognized as a hallmark of neurodegeneration. Activated central nervous system-resident microglia and infiltrating immune cells contribute to the degeneration of dopaminergic neurons (DNs). However, how the inflammatory process leads to neuron loss and whether blocking this response would be beneficial to disease progression remains largely unknown. CD95 is a mediator of inflammation that has also been proposed as an apoptosis inducer in DNs, but previous studies using ubiquitous deletion of CD95 or CD95L in mouse models of neurodegeneration have generated conflicting results. Here we examine the role of CD95 in 1-methyl-4-phenyl-1,2,3,6-tetrahydropyridin (MPTP)-induced neurodegeneration using tissue-specific deletion of CD95 or CD95L. We show that DN death is not mediated by CD95-induced apoptosis because deletion of CD95 in DNs does not influence MPTP-induced neurodegeneration. In contrast, deletion of CD95L in peripheral myeloid cells significantly protects against MPTP neurotoxicity and preserves striatal dopamine levels. Systemic pharmacological inhibition of CD95L dampens the peripheral innate response, reduces the accumulation of infiltrating myeloid cells, and efficiently prevents MPTP-induced DN death. Altogether, this study emphasizes the role of the peripheral innate immune response in neurodegeneration and identifies CD95 as potential pharmacological target for neurodegenerative disease.


Figures

Figure 1.
Figure 1.
Selective deletion of CD95 in DNs (CD95f/f;DATcre mice) does not influence dopaminergic neurodegeneration after treatment with MPTP. (A) Scheme of CD95f/f;DATcre mice. (B) Representative images of TH+ neurons in SNpc of control and CD95f/f;DATcre mice. Bar, 100 µm. (C) Quantification of total TH+ DNs in the SNpc at day 6 after last administration of saline or MPTP to WT, CD95f/f, or CD95f/f;DATcre mice. Data are presented as dot plot with median; n = 4–12. ANOVA followed by Newman–Keuls post-hoc test: CD95f/f versus CD95f/f + MPTP: **, P < 0.01; CD95f/f;DATcre versus CD95f/f;DATcre + MPTP: †, P < 0.01; n.s., not significant. (D and E) Quantification of DA metabolite levels and metabolite ratio in striatum at day 6 after last administration of MPTP in saline-treated WT, MPTP-treated CD95f/f, and CD95f/f;DATcre mice. Data are presented as mean ± SEM; n = 6–7. ANOVA followed by Newman–Keuls post-hoc test: ***, P < 0.001.
Figure 2.
Figure 2.
Mice with deletion of CD95L in myeloid cells (CD95Lf/f;LysMcre mice) are more resistant to MPTP. (A) Scheme of CD95Lf/f;LysMcre mice. (B) Quantification of total TH+ DNs in the SNpc at day 6 after last administration of saline or MPTP to CD95Lf/+;LysMcre, CD95f/f, or CD95Lf/f;LysMcre mice. Data are presented as dot plot with median; n = 6. ANOVA followed by Newman–Keuls post-hoc test: control versus CD95Lf/f: *, P < 0.01; CD95Lf/f versus CD95Lf/f;LysMcre: †, P < 0.05. (C) Representative images of TH+ neurons in SNpc of control and CD95Lf/f;LysMcre mice. (D) Representative photomicrographs of SNpc sections immunostained with anti-CD11b from control and CD95Lf/f;LysMcre mice. Note the different morphology of CD11b+ cells in CD95Lf/f and CD95Lf/f;LysMcre mice, as shown in the magnified pictures of anti-CD11b staining in the insets in SNpc. Bars: (C and D) 100 µm (D, insets) 50 µm. (E) Quantification of CD11b+ cells in SNpc. Data are presented as mean ± SEM; n = 6. ANOVA followed by Newman–Keuls post-hoc test: **, P < 0.01; n.s., not significant.
Figure 3.
Figure 3.
Pharmacological neutralization of CD95L protects mice against MPTP toxicity and alters peripheral immune response. (A) Scheme of MPTP and APG112 treatment. (B) Quantification of total TH+ DNs in the SNpc at day 6 after last administration of saline or MPTP of control or APG112-treated mice. ANOVA followed by Newman–Keuls post-hoc test: control versus MPTP: *, P < 0.001; MPTP versus MPTP + APG112: †, P < 0.01. (C) Representative images of TH+ neurons in SNpc of control and APG112-treated mice. Bar, 100 µm. (D) Quantification of striatal DA levels using HPLC at day 6 after last administration of saline or MPTP to control or APG112-treated mice. (E) Calculation of the metabolite ratio [(DOPAC + HVA/DA) × 100] after quantification of striatal DA metabolite levels by HPLC. (D and E) Data are presented as mean ± SEM; n = 8. ANOVA on ranks, Student–Newman–Keuls multiple comparison: *, P < 0.05; **, P < 0.01; ***, P < 0.001. (F) HPLC measurement of striatal MPP+ levels in WT and WT + APG112 mice at 90 min after MPTP injection. Data are presented as mean ± SEM; n = 3. Student’s t test: n.s., not significant. (G) Representative dot plots of blood monocytes and gating scheme of flow cytometry. (H) Quantification of blood monocyte subsets by FACS at day 6 after last administration of saline or MPTP of control or APG112-treated mice. ANOVA followed by Newman–Keuls post-hoc test: *, P < 0.05. (B and H) Data are presented as dot plot with median and were pooled from two independent experiments; n = 16–17.
Figure 4.
Figure 4.
Mice with deletion of CD95L in peripheral myeloid cells (CD95Lf/f;LysMcre chimera mice) are resistant to MPTP neurotoxicity. (A) Scheme of CD95Lf/f;LysMcre BM chimera mice. The heads of BM recipient mice were covered with a lead cap during irradiation to avoid irradiation-induced monocyte infiltration. (B) Representative FACS dot plots of CD45.1- and CD45.2-stained blood samples from CD95Lf/f;LysMcre± BM chimera mice. (C) BM reconstitution level of chimera mice before the injection of saline or MPTP. Data are presented as mean ± SEM; n = 6–7. (D) Quantification of total TH+ DNs in the SNpc at day 6 after last administration of saline or MPTP to CD95Lf/f;LysMcre± BM chimera mice. Data are presented as dot plot with median; n = 6–7. (C and D) ANOVA followed by Newman–Keuls post-hoc test: *, P < 0.05; ***, P < 0.001.
Figure 5.
Figure 5.
Myeloid cell infiltration in SNpc demonstrated by staining of microglia marker P2Y12 or monocyte marker CD169. (A) Representative photomicrographs of SNpc sections immunostained with anti-P2Y12, anti-TH, and anti-CD11b from saline-, MPTP-, and MPTP + APG112–treated mice. (B) Representative CD11b single-positive (CD11b+/P2Y12; as indicated with arrows in b1–b3) and CD11b P2Y12 double-positive (CD11b+/P2Y12+; as indicated with arrows in b4–b6) cells, which are highlighted with dashed rectangles in A. (C) Mosaic acquisition of CD11b single-positive (CD11b+/P2Y12) area in saline-, MPTP-, and MPTP/APG112-treated mice. Data are presented as mean ± SEM; n = 10. Student’s t test: *, P < 0.05; n.d., not detectable. (D and E) Representative photomicrographs of SNpc sections immunostained with anti-CD169, anti-Iba1, and anti-TH from saline- and MPTP-treated mice. Infiltrating monocytes are CD169+/Iba1+ cells and microglia are CD169/Iba1+ cells, as arrows indicate in F–H (dashed rectangle in E). Bars: (A, D, and E) 100 µm; (B) 30 µm; (F–H) 20 µm.
Figure 6.
Figure 6.
Pharmacological neutralization of CD95L reduces infiltration of circulating myeloid cells in SNpc. (A) Scheme of tdTomatoR26f/f;Cx3cr1creER mice. 4 wk after tamoxifen induction, microglia were tdTomato positive and the circulating monocytes were tdTomato negative. (B) Representative CD11b single-positive (CD11b+/tdTomato; as indicated with arrows in b3 and b4) infiltrating monocytes, which are highlighted with the dashed rectangle in b1. Bars: (b1 and b2) 50 µm; (b3 and b4) 20 µm. (C) Quantification of infiltrating monocytes (CD11b+/tdTomato) in SNpc of MPTP- and MPTP/APG112-treated mice. Data are presented as dot plot with median; n = 7. Student’s t test: *, P < 0.05.

References

    1. Adachi M., Suematsu S., Suda T., Watanabe D., Fukuyama H., Ogasawara J., Tanaka T., Yoshida N., and Nagata S.. 1996. Enhanced and accelerated lymphoproliferation in Fas-null mice. Proc. Natl. Acad. Sci. USA. 93:2131–2136 10.1073/pnas.93.5.2131 - DOI - PMC - PubMed
    1. Ahmed I., Tamouza R., Delord M., Krishnamoorthy R., Tzourio C., Mulot C., Nacfer M., Lambert J.-C., Beaune P., Laurent-Puig P., et al. . 2012. Association between Parkinson’s disease and the HLA-DRB1 locus. Mov. Disord. 27:1104–1110 10.1002/mds.25035 - DOI - PubMed
    1. Ajami B., Bennett J.L., Krieger C., McNagny K.M., and Rossi F.M.V.. 2011. Infiltrating monocytes trigger EAE progression, but do not contribute to the resident microglia pool. Nat. Neurosci. 14:1142–1149 10.1038/nn.2887 - DOI - PubMed
    1. Brochard V., Combadière B., Prigent A., Laouar Y., Perrin A., Beray-Berthat V., Bonduelle O., Alvarez-Fischer D., Callebert J., Launay J.M., et al. . 2009. Infiltration of CD4+ lymphocytes into the brain contributes to neurodegeneration in a mouse model of Parkinson disease. J. Clin. Invest. 119:182–192 10.1172/JCI36470 - DOI - PMC - PubMed
    1. Butovsky O., Siddiqui S., Gabriely G., Lanser A.J., Dake B., Murugaiyan G., Doykan C.E., Wu P.M., Gali R.R., Iyer L.K., et al. . 2012. Modulating inflammatory monocytes with a unique microRNA gene signature ameliorates murine ALS. J. Clin. Invest. 122:3063–3087 10.1172/JCI62636 - DOI - PMC - PubMed

Publication types

MeSH terms