. 2015 Apr;145(4):285-301.
doi: 10.1085/jgp.201411348. Epub 2015 Mar 16.

Conditional knockout of TMEM16A/anoctamin1 abolishes the calcium-activated chloride current in mouse vomeronasal sensory neurons

Affiliations

Conditional knockout of TMEM16A/anoctamin1 abolishes the calcium-activated chloride current in mouse vomeronasal sensory neurons

Asma Amjad et al. J Gen Physiol. 2015 Apr.

Abstract

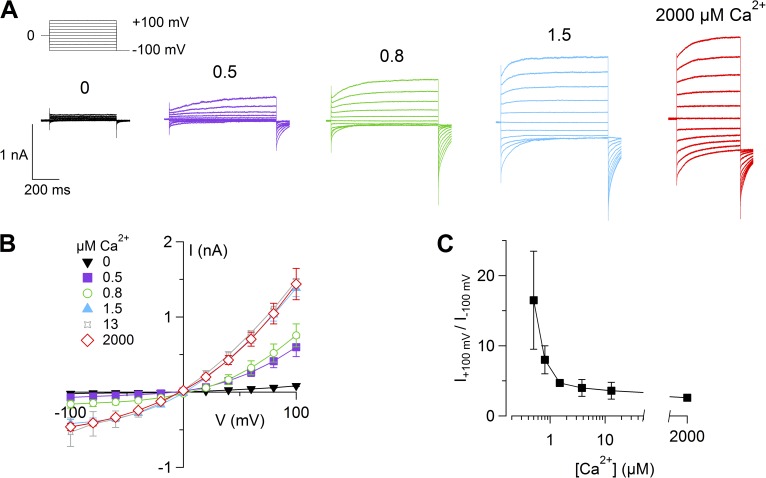
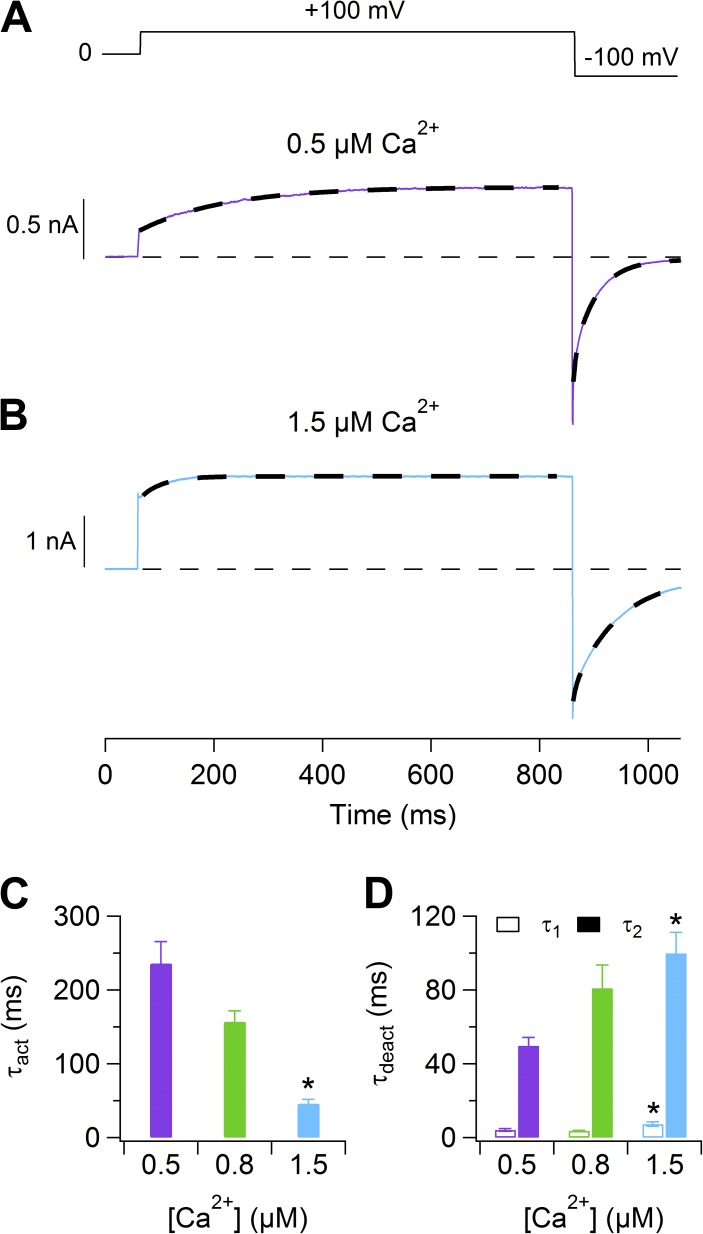
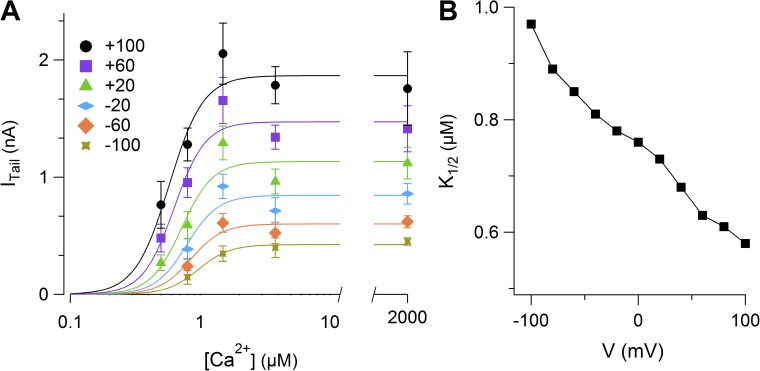
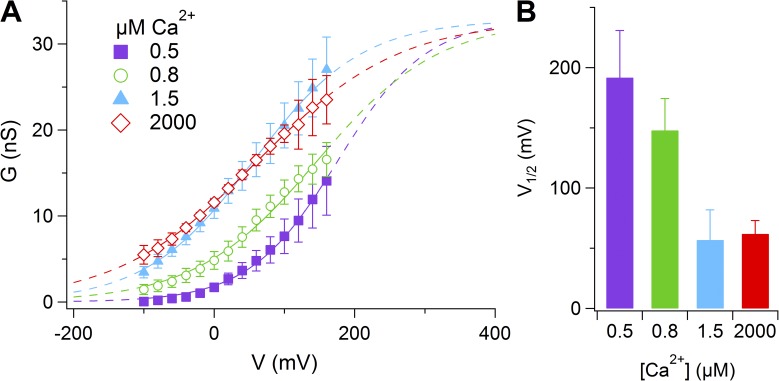
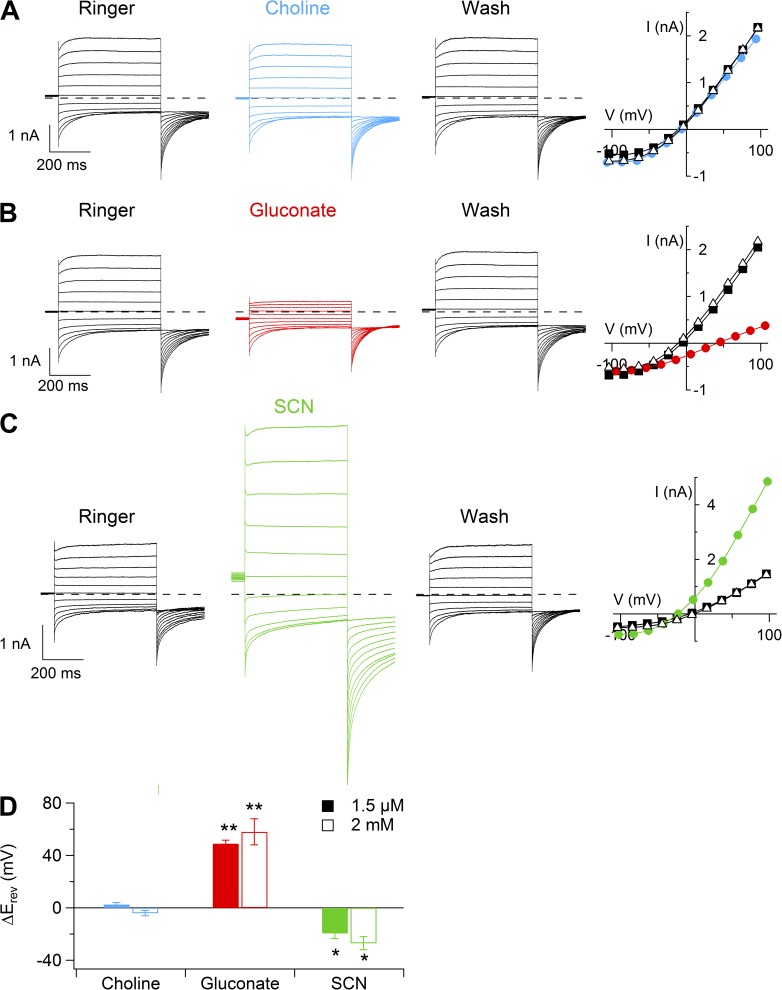
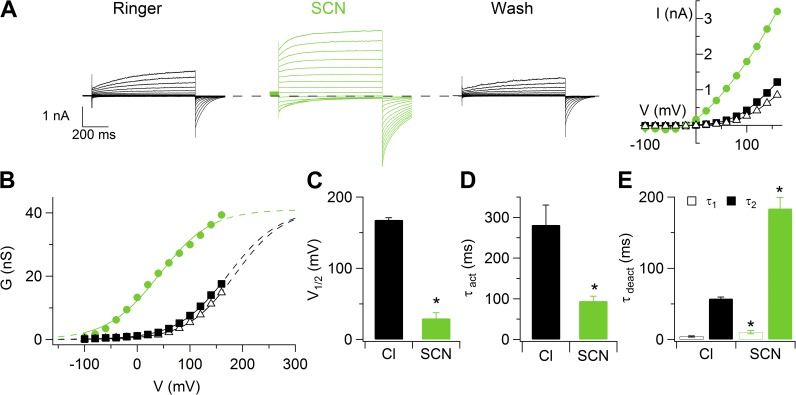
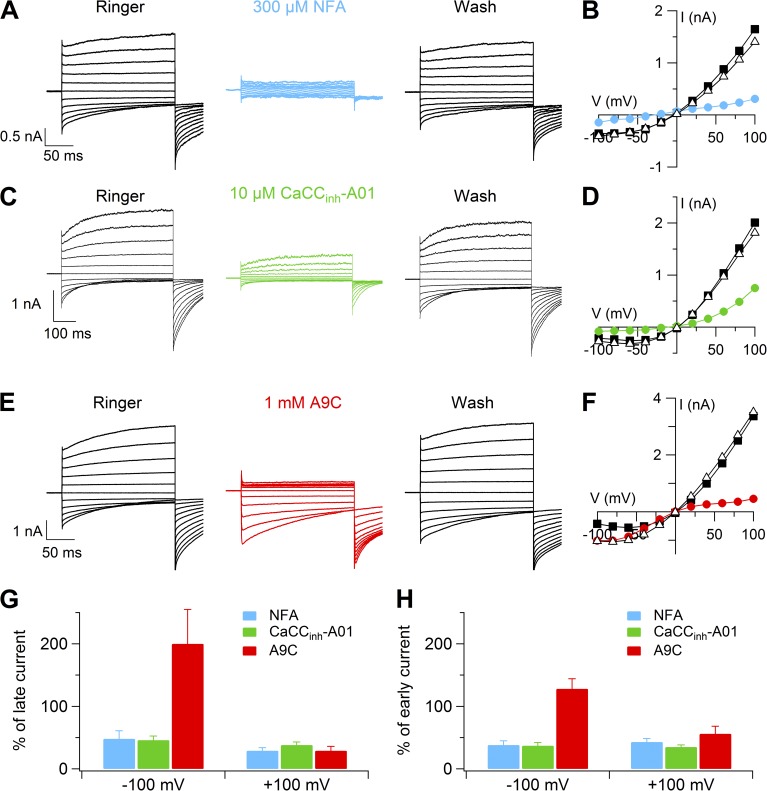
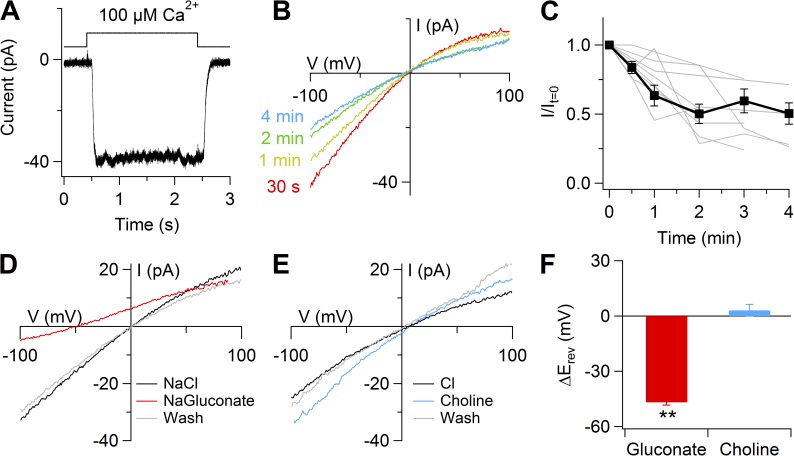
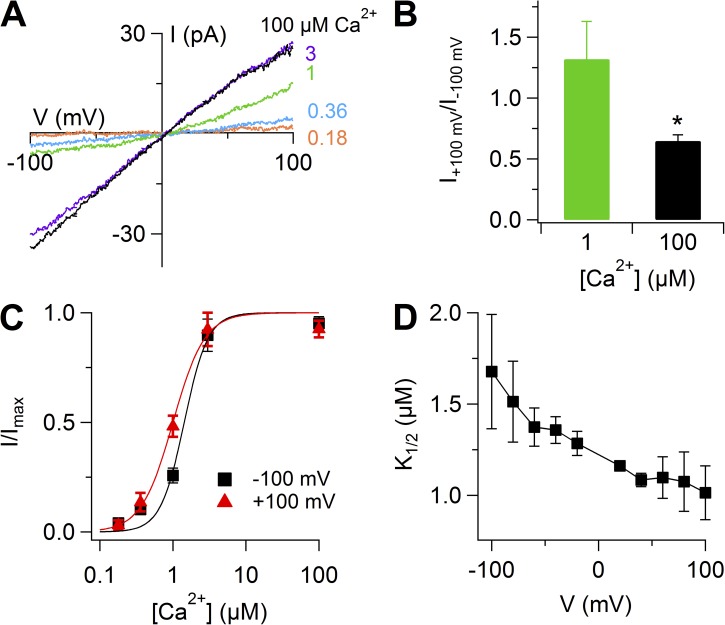
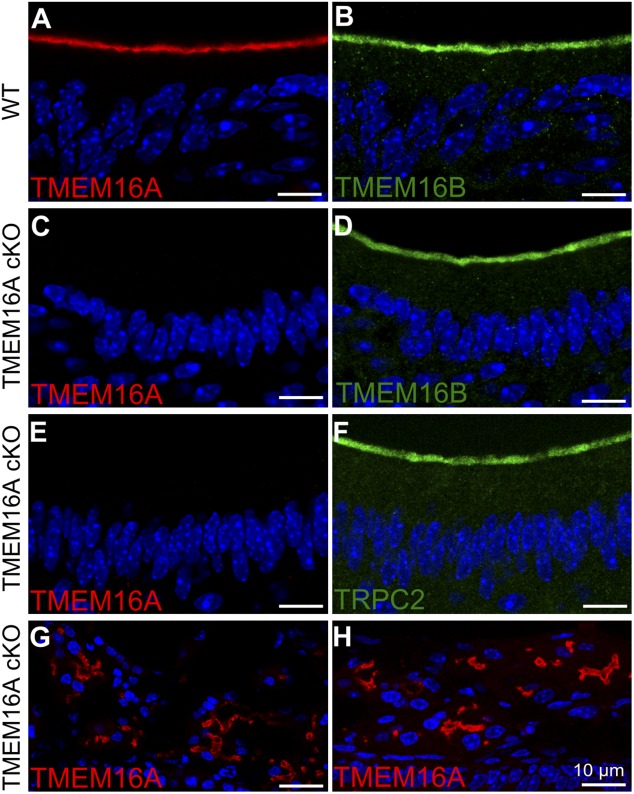
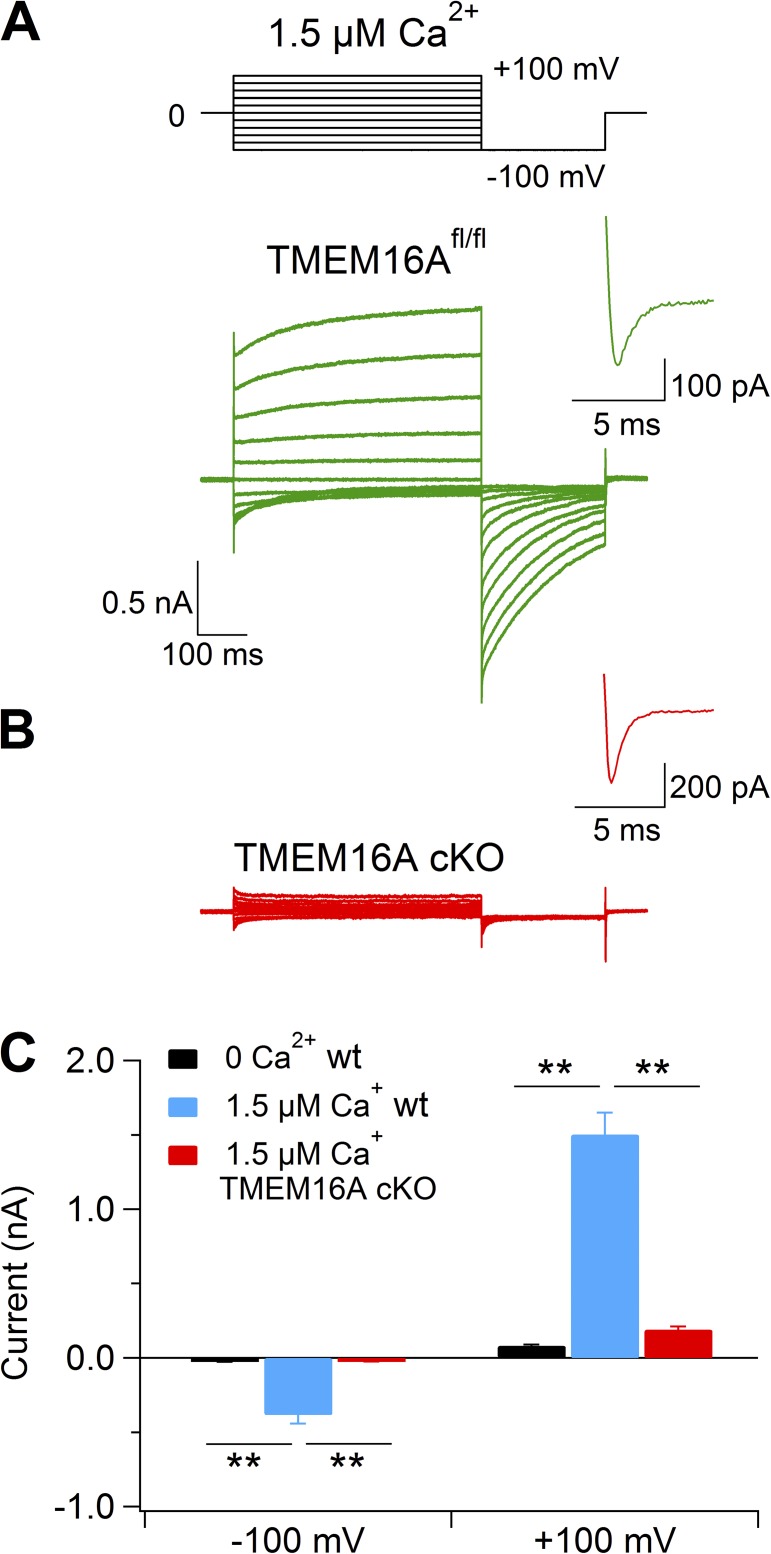
Pheromones are substances released from animals that, when detected by the vomeronasal organ of other individuals of the same species, affect their physiology and behavior. Pheromone binding to receptors on microvilli on the dendritic knobs of vomeronasal sensory neurons activates a second messenger cascade to produce an increase in intracellular Ca(2+) concentration. Here, we used whole-cell and inside-out patch-clamp analysis to provide a functional characterization of currents activated by Ca(2+) in isolated mouse vomeronasal sensory neurons in the absence of intracellular K(+). In whole-cell recordings, the average current in 1.5 µM Ca(2+) and symmetrical Cl(-) was -382 pA at -100 mV. Ion substitution experiments and partial blockade by commonly used Cl(-) channel blockers indicated that Ca(2+) activates mainly anionic currents in these neurons. Recordings from inside-out patches from dendritic knobs of mouse vomeronasal sensory neurons confirmed the presence of Ca(2+)-activated Cl(-) channels in the knobs and/or microvilli. We compared the electrophysiological properties of the native currents with those mediated by heterologously expressed TMEM16A/anoctamin1 or TMEM16B/anoctamin2 Ca(2+)-activated Cl(-) channels, which are coexpressed in microvilli of mouse vomeronasal sensory neurons, and found a closer resemblance to those of TMEM16A. We used the Cre-loxP system to selectively knock out TMEM16A in cells expressing the olfactory marker protein, which is found in mature vomeronasal sensory neurons. Immunohistochemistry confirmed the specific ablation of TMEM16A in vomeronasal neurons. Ca(2+)-activated currents were abolished in vomeronasal sensory neurons of TMEM16A conditional knockout mice, demonstrating that TMEM16A is an essential component of Ca(2+)-activated Cl(-) currents in mouse vomeronasal sensory neurons.


Figures

Figure 1.
Figure 1.
Ca2+-activated currents in mouse vomeronasal sensory neurons. (A) Representative whole-cell currents recorded from different neurons with a pipette solution containing the indicated [Ca2+]i (for the trace in 2 mM Ca2+, the intracellular solution contained 140 mM NaCl). The holding voltage was 0 mV and voltage steps from −100 to 100 mV with 20-mV increments, followed by a step to −100 mV, were applied as indicated in the top part of the panel. (B) Average steady-state I-V relationships from several neurons at the indicated [Ca2+]i (n = 3–28). (C) Average ratios between steady-state currents measured at 100 and −100 mV at various [Ca2+]i (n = 3–28). Data in B and C are represented as mean ± SEM.
Figure 2.
Figure 2.
Activation and deactivation kinetics of Ca2+-activated currents. (A and B) Representative currents with 0.5 and 1.5 µM [Ca2+]i, respectively. The voltage was stepped from 0 to 100 mV and then to −100 mV. Dashed lines are the fit of activation or deactivation time constants obtained, respectively, with a single- or double-exponential function. (C and D) Average activation (from 0 to 100 mV) or deactivation (from 100 to −100 mV) time constants at the indicated [Ca2+]i (n = 5–7). Data in C and D are represented as mean ± SEM (*, P < 0.05; Dunn–Hollander–Wolfe test after Krustal–Wallis analysis between 0.5 and 1.5 µM).
Figure 3.
Figure 3.
Ca2+ sensitivity. (A) Average instantaneous tail currents measured at −100 mV after a prepulse varying from −100 to 100 mV plotted versus [Ca2+]i (n = 4–8). The continuous lines are the fit with the Hill equation (Eq. 1). (B) K1/2 values plotted versus the prepulse voltage. Data in A are represented as mean ± SEM.
Figure 4.
Figure 4.
Voltage dependence of Ca2+-activated currents. (A) Average conductances at the indicated [Ca2+]i measured from instantaneous tail currents at −100 mV after prepulses from −100 to 160 mV plotted versus the prepulse voltage (n = 4–8). The continuous lines are the fit with the Boltzmann equation (Eq. 2). (B) Average V1/2 values plotted versus [Ca2+]i (n = 4–8). Data are represented as mean ± SEM.
Figure 5.
Figure 5.
Ionic selectivity of Ca2+-activated currents. Representative whole-cell recordings obtained with an intracellular solution containing 1.5 µM Ca2+. Voltage protocol as in Fig. 1 A. Each neuron was exposed to a Ringer’s solution containing NaCl, choline-Cl (A), Na-gluconate (B), or NaSCN (C), followed by washout in Ringer’s solution with NaCl. Dashed lines indicate zero current. Steady-state I-V relationships measured at the end of the voltage steps are shown at the right of each set of recordings. (D) Average reversal potential shift upon substitution of extracellular NaCl with choline-Cl, Na-gluconate, or NaSCN in 1.5 µM (closed bars; n = 5–10) or 2 mM Ca2+ (open bars; n = 4). Data in D are represented as mean ± SEM (**, P < 0.01; *, P < 0.05; Wilcoxon Signed Rank test).
Figure 6.
Figure 6.
Change of voltage dependence in the presence of SCN. (A) Representative whole-cell recordings obtained with an intracellular solution containing 0.5 µM Ca2+. The same neuron was exposed to a Ringer’s solution containing NaCl or NaSCN, followed by washout in Ringer’s solution with NaCl. Voltage steps of 800-ms duration were given from a holding voltage of 0 mV to voltages between −100 and 160 mV in 20-mV steps, followed by a step to −100 mV. Dashed lines indicate zero current. Steady-state I-V relationships measured at the end of the voltage steps. (B) Conductances measured from instantaneous tail currents at −100 mV after prepulses from −100 to 160 mV plotted versus the prepulse voltage. Data from the recordings shown in A. (C) Average V1/2 in Cl or SCN (n = 3). (D and E) Average activation and deactivation time constants in Cl or SCN (n = 3). Data in C–E are represented as mean ± SEM (*, P < 0.05; Wilcoxon Signed Rank test).
Figure 7.
Figure 7.
Pharmacology of Ca2+-activated currents. Representative whole-cell recordings obtained with an intracellular solution containing 1.5 µM Ca2+. Voltage protocol as in Fig. 1 A. Each neuron was exposed to a Ringer’s solution to 300 µM NFA (A), 10 µM CaCCihn-A01 (C), or 1 mM A9C (E), and again to Ringer’s solution. (B, D, and F) I-V relationships measured at the end of the voltage steps from the recordings shown on the left. (G and H) Average percentages of currents measured in the presence of each compound relative to control at the end of the voltage step (G; late current) or 2 ms after the voltage step (H; early current) at −100 or 100 mV (n = 5–7). Data in G and H are represented as mean ± SEM.
Figure 8.
Figure 8.
Rundown and ionic selectivity of Ca2+-activated currents in inside-out patches from dendritic knob/microvilli of vomeronasal sensory neurons. (A) An inside-out patch was exposed to 100 µM Ca2+ for 2 s at the time indicated in the upper trace. Holding potential, −50 mV. Symmetrical NaCl solutions. (B) I-V relations from a voltage ramp protocol. Leakage currents measured in 0 Ca2+ were subtracted. The number next to each trace indicates the time of Ca2+ application after patch excision. (C) Average ratios between currents at −100 mV measured at the indicated times after patch excision and the current measured at patch excision (n = 3–10). Ratios of individual patches are in gray. (D and E) I-V relations activated by 100 µM Ca2+ from a voltage ramp protocol after subtraction of the leakage currents measured in 0 Ca2+. The patch was exposed to bath solutions containing 140 mM NaCl, Na-gluconate (D), or choline-Cl (E), followed by washout with NaCl. Current traces in D and E were from the same patch. (F) Average reversal potential shift upon substitution of extracellular NaCl with Na-gluconate or choline-Cl (n = 3) (**, P < 0.01; Wilcoxon Signed Rank test). Error bars indicate SEM.
Figure 9.
Figure 9.
Dose–response relations of Ca2+-activated currents in inside-out patches from the dendritic knob/microvilli of vomeronasal sensory neurons. (A) I-V relations from the same patch exposed to the indicated Ca2+ concentrations after subtraction of the currents measured in 0 Ca2+. (B) Ratios between currents measured at 100 and at −100 mV at the indicated Ca2+ concentrations (n = 5–13). *, P < 0.05; Wilcoxon Signed Rank test. (C) Dose–response relations, obtained by normalized currents at −100 or 100 mV (n = 5). Continuous lines are the fit with the Hill equation (Eq. 1). (D) Mean K1/2 values plotted versus voltage (n = 5). Error bars indicate SEM.
Figure 10.
Figure 10.
Immunostaining of sections of VNO in WT and TMEM16A cKO mice. (A and B) Confocal micrographs showing TMEM16A (red) and TMEM16B (green) expression at the apical surface of the vomeronasal epithelium in WT mice. (C–F) No immunoreactivity to TMEM16A was detectable at the apical surface of the vomeronasal epithelium in TMEM16A cKO mice, whereas TMEM16B and TRPC2 were normally detected. (G and H) As a control, expression of TMEM16A is shown in nasal septal glands (G) and lateral nasal glands (H) of cKO mice. Cell nuclei were stained by DAPI (blue). Bars, 10 µm.
Figure 11.
Figure 11.
Lack of Ca2+-activated currents in vomeronasal sensory neurons from TMEM16A conditional knockout mice. Representative whole-cell recordings obtained with an intracellular solution containing 1.5 µM Ca2+ from vomeronasal sensory neurons dissociated from TMEM16Afl/fl (A) or TMEM16A cKO (B) mice. Insets show the enlargement of the recordings of voltage-gated inward currents activated by a step to 0 mV from the holding potential of −100 mV, as indicated in the voltage protocol at the top of the figure. (C) Mean current amplitudes measured at −100 or 100 mV with intracellular pipette solution containing nominally 0 (black bar; n = 6) or 1.5 µM free Ca2+ from WT (blue bar; n = 28) or TMEM16A cKO mice (red bar; n = 20). Error bars indicate SEM (**, P < 0.01; Dunn–Hollander–Wolfe test after Krustal–Wallis analysis).

Similar articles

Cited by

References

    1. Adomaviciene A., Smith K.J., Garnett H., and Tammaro P.. 2013. Putative pore-loops of TMEM16/anoctamin channels affect channel density in cell membranes. J. Physiol. 591:3487–3505 10.1113/jphysiol.2013.251660 - DOI - PMC - PubMed
    1. Arnson H.A., Fu X., and Holy T.E.. 2010. Multielectrode array recordings of the vomeronasal epithelium. J. Vis. Exp. 1:1845. - PMC - PubMed
    1. Barry P.H.1994. JPCalc, a software package for calculating liquid junction potential corrections in patch-clamp, intracellular, epithelial and bilayer measurements and for correcting junction potential measurements. J. Neurosci. Methods. 51:107–116 10.1016/0165-0270(94)90031-0 - DOI - PubMed
    1. Berghard A., and Buck L.B.. 1996. Sensory transduction in vomeronasal neurons: Evidence for Gαo, Gαi2, and adenylyl cyclase II as major components of a pheromone signaling cascade. J. Neurosci. 16:909–918. - PMC - PubMed
    1. Betto G., Cherian O.L., Pifferi S., Cenedese V., Boccaccio A., and Menini A.. 2014. Interactions between permeation and gating in the TMEM16B/anoctamin2 calcium-activated chloride channel. J. Gen. Physiol. 143:703–718 10.1085/jgp.201411182 - DOI - PMC - PubMed

Publication types