. 2015 Mar;3(3):e12329.
doi: 10.14814/phy2.12329.

Universal and individual characteristics of postural sway during quiet standing in healthy young adults

Affiliations

Universal and individual characteristics of postural sway during quiet standing in healthy young adults

Tomohisa Yamamoto et al. Physiol Rep. 2015 Mar.

Abstract

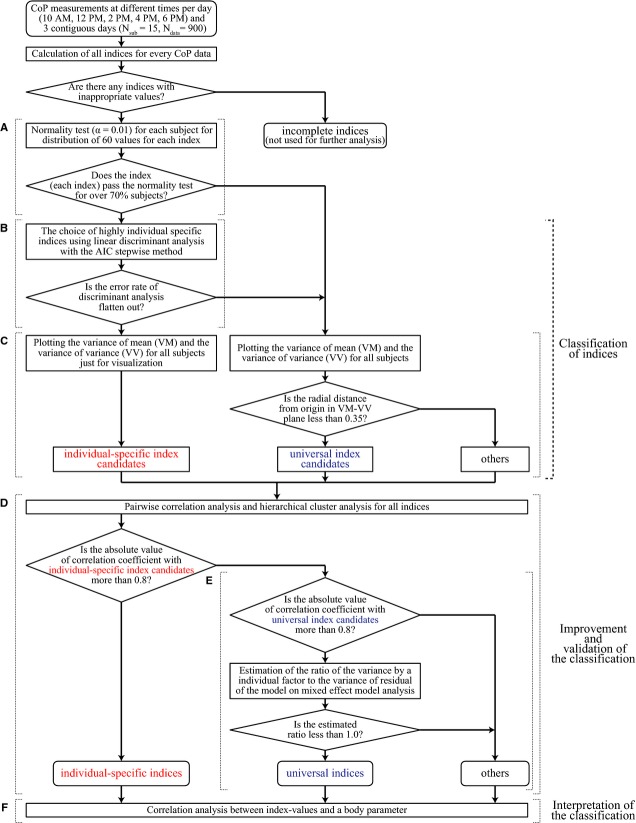
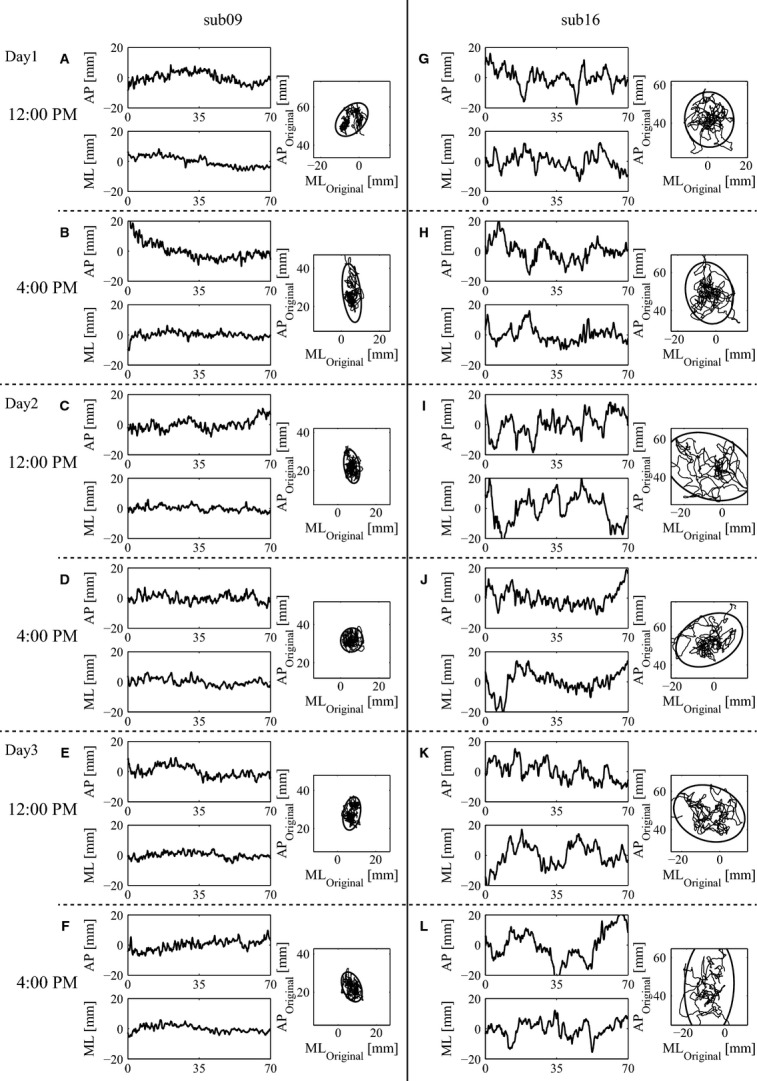
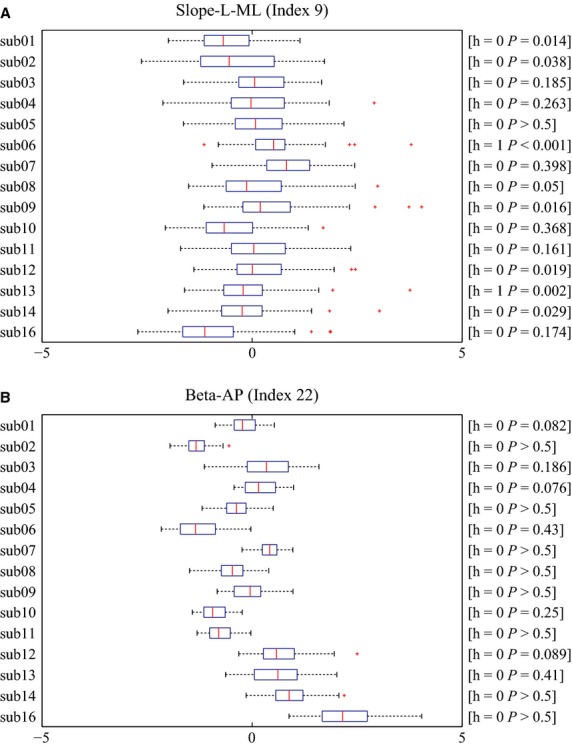
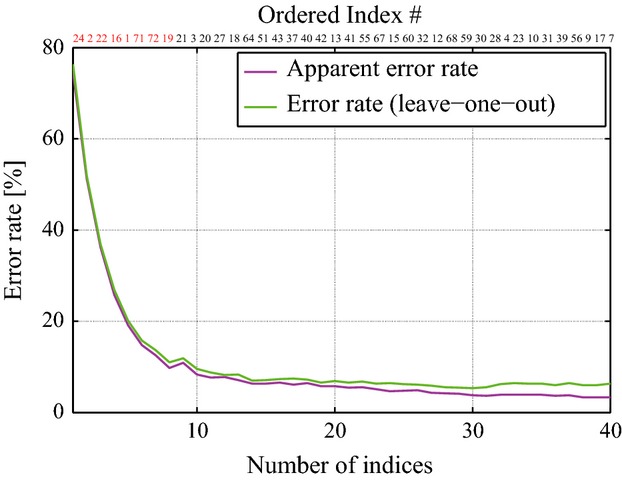
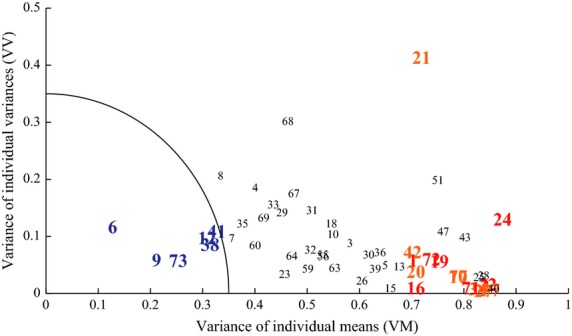
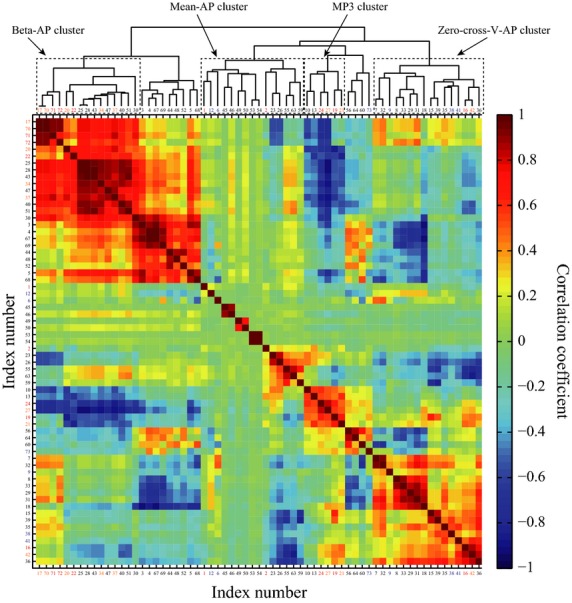
The time course of the center of pressure (CoP) during human quiet standing, corresponding to body sway, is a stochastic process, influenced by a variety of features of the underlying neuro-musculo-skeletal system, such as postural stability and flexibility. Due to complexity of the process, sway patterns have been characterized in an empirical way by a number of indices, such as sway size and mean sway velocity. Here, we describe a statistical approach with the aim of estimating "universal" indices, namely parameters that are independent of individual body characteristics and thus are not "hidden" by the presence of individual, daily, and circadian variations of sway; in this manner it is possible to characterize the common aspects of sway dynamics across healthy young adults, in the assumption that they might reflect underlying neural control during quiet standing. Such universal indices are identified by analyzing intra and inter-subject variability of various indices, after sorting out individual-specific indices that contribute to individual discriminations. It is shown that the universal indices characterize mainly slow components of sway, such as scaling exponents of power-law behavior at a low-frequency regime. On the other hand, most of the individual-specific indices contributing to the individual discriminations exhibit significant correlation with body parameters, and they can be associated with fast oscillatory components of sway. These results are consistent with a mechanistic hypothesis claiming that the slow and the fast components of sway are associated, respectively, with neural control and biomechanics, supporting our assumption that the universal characteristics of postural sway might represent neural control strategies during quiet standing.

Keywords: Intermittent control; postural control; postural sway; slow component.


Figures

Figure 1
Figure 1
Flow chart for the classification of indices. It was composed of three steps; namely, classification, improvement and validation, and interpretation of the classification. See Methods for details.
Figure 2
Figure 2
Examples of CoP patterns (planar CoP trajectory, CoP-AP and CoP-ML) for two different subjects measured at different circadian times and different days. (A)–(F): CoP data from subject-09. (G)–(L): CoP data from subject-16. For each subject, from the top to the bottom panels, the measurements were performed at 12:00 pm of Day 1, 4:00 pm of Day 1, 12:00 pm of Day 2, 4:00 pm of Day 2, 12:00 pm of Day 3, and 4:00 pm of Day 3.
Figure 3
Figure 3
Box-plot of every subject for (A) Slope-L-ML (Index 9) and (B) Beta-AP (Index 22). (A) Slope-L-ML (Index 9) was normally distributed in most of the subjects. h and P-values for each panel represent the results of Lilliefors' test examining the null hypothesis that the data comes from a normal distribution. h = 1 if the test rejects the null hypothesis at 1% significance level, and h = 0 otherwise. The individual means of Slope-L-ML index for all subjects were close to each other, which made the individual variances relatively large. (B) Beta-AP (Index 22) was also normally distributed in all subjects. The individual means of Beta-AP index were largely subject-dependent, which made the individual variances relatively small.
Figure 4
Figure 4
Apparent error rate and error rate of leave-one-out cross-validation as the function of number of indices used for the linear discriminant analysis. The order of indices was determined by the AIC-based stepwise method, where the indices were included into the linear classifier according to the order of indices. Red-color numbers represent the indices that were selected as the individual-specific index candidates.
Figure 5
Figure 5
The variance of individual means (VM) and the variance of individual variances (VV) of each index across subjects. Numbers plotted in the VM-VV plane represent the index numbers. The candidates of universal and individual-specific indices were colored in blue and red, respectively. Indices colored in orange were also considered as individual-specific later by the correlation analysis. Indices colored in black were neither universal nor individual specific.
Figure 6
Figure 6
Pooled histograms stacked over all subjects for Slope-L-ML (Index 9) in (A) and for Beta-AP (Index 22) in (B). The title of each panel indicates the h and P-values of the Lilliefors' test for each index. The index Slope-L-ML was considered as universal, for which the pooled histogram was similar to the normal distribution and each bin of the histogram were almost evenly occupied (stacked) by subject-wise different colors. On the other hand, the index Beta-AP was considered as individual specific, for which shape of the pooled histogram was asymmetry with a long tail and was not similar to the normal distribution. Moreover, each bin of the histogram was not evenly occupied by subject-wise colors.
Figure 7
Figure 7
Radar charts illustrating how the CoP time-series of two representative subjects were characterized commonly and differently, respectively, by the set of values of the universal index candidates and by the set of individual-specific index candidates. In each panel, solid lines connect the individual mean values of the indices, and dashed lines connect the individual mean ± SD values of the indices. (A) Universal index candidates. (B) Individual-specific index candidates.
Figure 8
Figure 8
Correlations between two indices for all possible combinations of indices. The panel color at (k,k′)-grid represents the correlation coefficient between k-th and k′-th indices. The indices were rearranged by the dendrogram representing the similarity of pair of two indices. This dendrogram was drawn up on the basis of hierarchical cluster analysis where the correlation coefficients were used as the distance among indices.
Figure 9
Figure 9
(A) Scatter plot of Slope-L-AP (Index 12) as one of the universal index versus the moment of inertia of each subject. (B) Scatter plot of log-MV-AP (Index 72) as one of the individual-specific index versus the moment of inertia of each subject. Individual-specific index tended to correlate more with the moment of inertia than universal index.

References

    1. Agostini V, Chiaramello E, Canavese L, Bredariol C. Knaflitz M. Postural sway in volleyball players. Hum. Mov. Sci. 2013;32:445–456. - PubMed
    1. Asai Y, Tasaka Y, Nomura K, Nomura T, Casadio M. Morasso P. A model of postural control in quiet standing: robust compensation of delay-induced instability using intermittent activation of feedback control. PLoS One. 2009;4:e6169. - PMC - PubMed
    1. Baratto L, Morasso P, Re C. Spada G. A new look at posturographic analysis in the clinical context: sway-density vs. other parameterization techniques. Mot. Control. 2002;6:246–270. - PubMed
    1. Bosek M, Grzegorzewski B, Kowalczyk A. Lubiński I. Degradation of postural control system as a consequence of Parkinson's disease and ageing. Neurosci. Lett. 2005;376:215–220. - PubMed
    1. Bottaro A, Casadio M, Morasso PG. Sanguineti V. Body sway during quiet standing: is it the residual chattering of an intermittent stabilization process? Hum. Mov. Sci. 2005;24:588–615. - PubMed