. 2014 Dec 8:9:20.
doi: 10.1186/1944-3277-9-20. eCollection 2014.

Quality scores for 32,000 genomes

Affiliations

Quality scores for 32,000 genomes

Miriam L Land et al. Stand Genomic Sci. .

Abstract

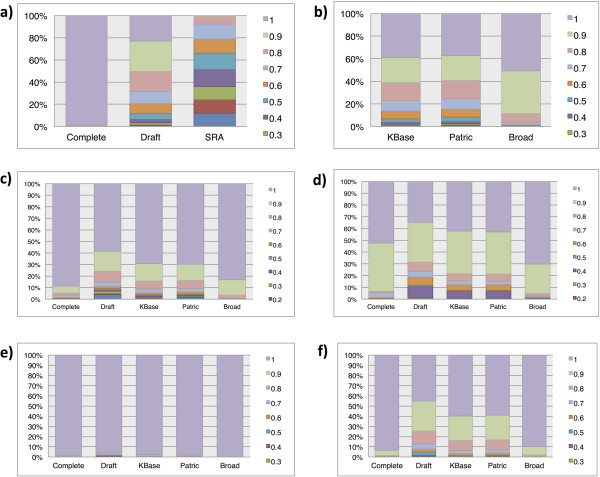
Background: More than 80% of the microbial genomes in GenBank are of 'draft' quality (12,553 draft vs. 2,679 finished, as of October, 2013). We have examined all the microbial DNA sequences available for complete, draft, and Sequence Read Archive genomes in GenBank as well as three other major public databases, and assigned quality scores for more than 30,000 prokaryotic genome sequences.

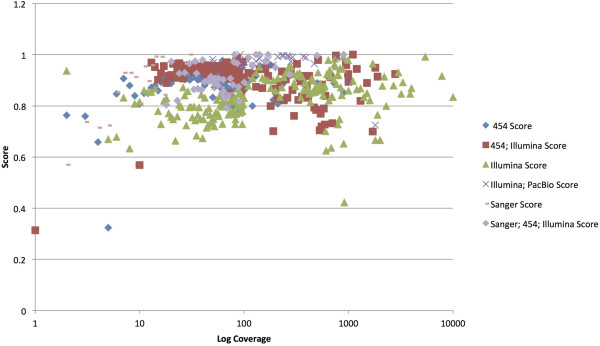
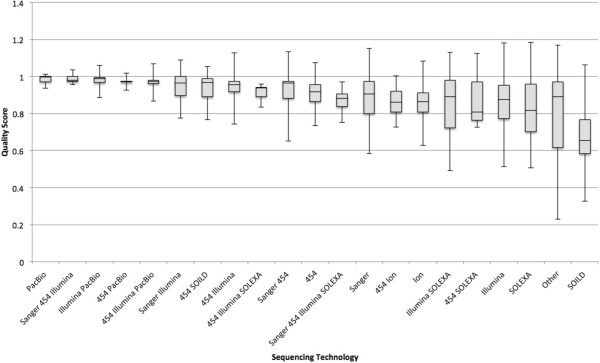
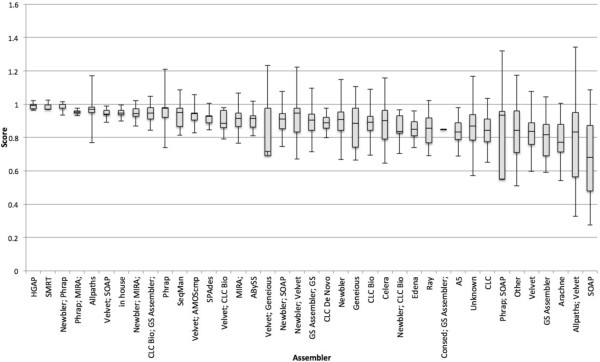
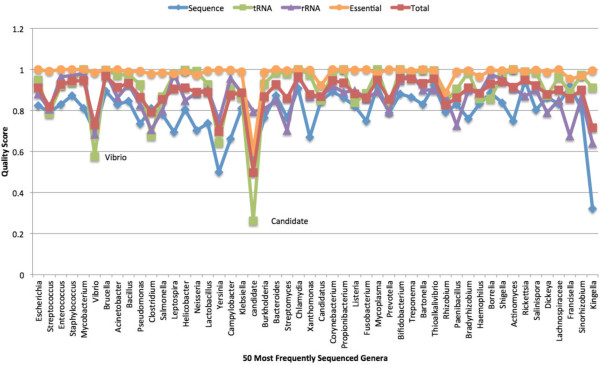
Results: Scores were assigned using four categories: the completeness of the assembly, the presence of full-length rRNA genes, tRNA composition and the presence of a set of 102 conserved genes in prokaryotes. Most (~88%) of the genomes had quality scores of 0.8 or better and can be safely used for standard comparative genomics analysis. We compared genomes across factors that may influence the score. We found that although sequencing depth coverage of over 100x did not ensure a better score, sequencing read length was a better indicator of sequencing quality. With few exceptions, most of the 30,000 genomes have nearly all the 102 essential genes.

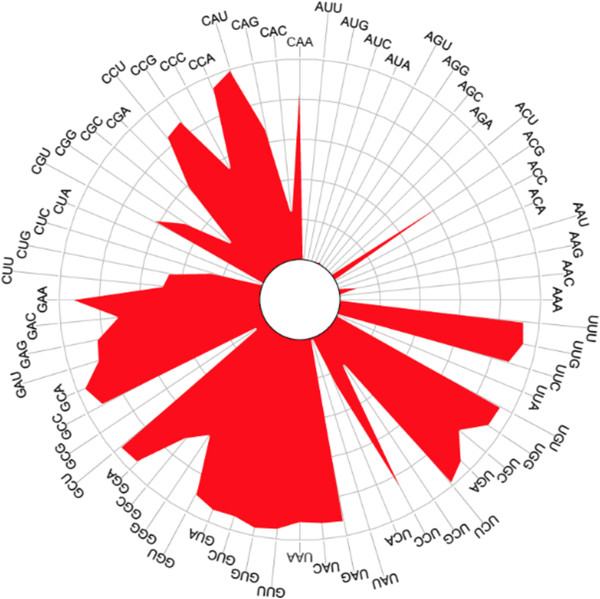
Conclusions: The score can be used to set thresholds for screening data when analyzing "all published genomes" and reference data is either not available or not applicable. The scores highlighted organisms for which commonly used tools do not perform well. This information can be used to improve tools and to serve a broad group of users as more diverse organisms are sequenced. Unexpectedly, the comparison of predicted tRNAs across 15,000 high quality genomes showed that anticodons beginning with an 'A' (codons ending with a 'U') are almost non-existent, with the exception of one arginine codon (CGU); this has been noted previously in the literature for a few genomes, but not with the depth found here.

Keywords: DNA; Database; Evaluation; Quality; Sequencing; Status.


Figures

Figure 1
Figure 1
Comparison of quality scores between the data sources. For each data source, the percent of genomes within each range of scores. The number in the legend is the largest value in the range. Ranges with no genomes are not presented in the legends. The six tables are scores for (a) Sequence quality from GenBank Sources, (b) Sequence quality from Non-GenBank Sources, (c) tRNAs (one each of 20 standard amino acids), (d) rRNAs (one full size 5S, 16S, and 23S rRNA), (e) Essential Genes (102 conserved Pfam-A domains) and (f) Total combined Scores.
Figure 2
Figure 2
Rose plot of predicted tRNA anticodon frequency. Length of line from center outwards indicates relative frequency. Each quadrant corresponds to a different starting base for the anticodon. The upper right quadrant contains the anticodons that start with ‘A’ and are relatively rare.
Figure 3
Figure 3
Plot of average score by log coverage level for each sequencing technology. The coverage level and sequencing technology extracted from GenBank and PATRIC sources. The log of the coverage is plotted by score and symbols assigned by sequencing technology. Due to the density of the data in the plot, less frequent sequencing technologies are not shown.
Figure 4
Figure 4
Box and whiskers plot of average score by sequencing technology. Where available, a sequencing technology was parsed from GenBank and PATRIC sources. Data are sorted left to right from largest to smallest mean value. The box represents the first quartile, the mean, and the third quartile. The whiskers represent 2 standard deviations on either side of the mean. Because the data have an upper limit of 1, the upper range can exceed the possible values.
Figure 5
Figure 5
Box and whiskers plot of average score by assembler. Where available, a assembly method was parsed from GenBank and PATRIC sources. Data are sorted left to right from largest to smallest mean value. The box represents the first quartile, the mean, and the third quartile. The whiskers represent 2 standard deviations on either side of the mean. Because the data have an upper limit of 1, the upper range can exceed the possible values.
Figure 6
Figure 6
Quality scores for 50 most abundant genera. Average quality scores for sequence, tRNAs, rRNAs, essential genes, and total plotted for each of the 50 most represented genera. The genera are presented in order of abundance from Escherichia on the left to Kingella on the right.

References

    1. Schatz MC, Langmead B. The DNA data deluge fast, efficient genome-sequencing machines are spewing out more data than geneticists can analyze. Ieee Spectrum. 2013;50(7):28–33. - PMC - PubMed
    1. Deus HF, Stanislaus R, Veiga DF, Behrens C, Wistuba II, Minna JD, Garner HR, Swisher SG, Roth JA, Correa AM, Broom B, Coombes K, Chang A, Vogel LH, Almeida JS. A semantic web management model for integrative biomedical informatics. Plos One. 2008;3(8):e2946. - PMC - PubMed
    1. Beaman RS, Traub GH, Dell CA, Santiago N, Koh J, Cellinese N. TOLKIN - Tree of Life Knowledge and Information Network: filling a gap for collaborative research in biological systematics. Plos One. 2012;7(6):e39352. - PMC - PubMed
    1. Bhattacharyya M, Bandyopadhyay S. Recent Directions in Compressing Next Generation Sequencing Data. Current Bioinformatics. 2012;7(1):2–6.
    1. Mavromatis K, Land ML, Brettin TS, Quest DJ, Copeland A, Clum A, Goodwin L, Woyke T, Lapidus A, Klenk HP, Cottingham RW, Kyrpides NC. The fast changing landscape of sequencing technologies and their impact on microbial genome assemblies and annotation. Plos One. 2012;7(12):e48837. - PMC - PubMed