

Effects of sex chromosome dosage on corpus callosum morphology in supernumerary sex chromosome aneuploidies
- PMID: 25780557
- PMCID: PMC4360142
- DOI: 10.1186/s13293-014-0016-4
Effects of sex chromosome dosage on corpus callosum morphology in supernumerary sex chromosome aneuploidies
Abstract
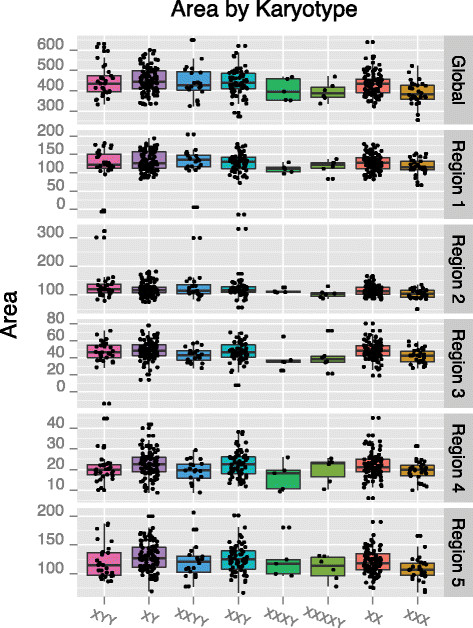
Background: Supernumerary sex chromosome aneuploidies (sSCA) are characterized by the presence of one or more additional sex chromosomes in an individual's karyotype; they affect around 1 in 400 individuals. Although there is high variability, each sSCA subtype has a characteristic set of cognitive and physical phenotypes. Here, we investigated the differences in the morphometry of the human corpus callosum (CC) between sex-matched controls 46,XY (N =99), 46,XX (N =93), and six unique sSCA karyotypes: 47,XYY (N =29), 47,XXY (N =58), 48,XXYY (N =20), 47,XXX (N =30), 48,XXXY (N =5), and 49,XXXXY (N =6).
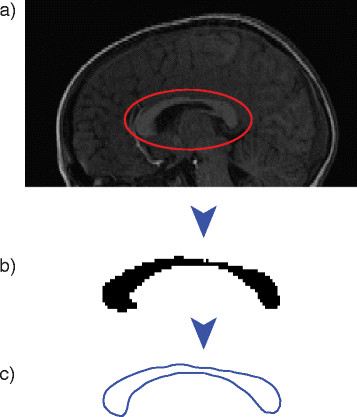
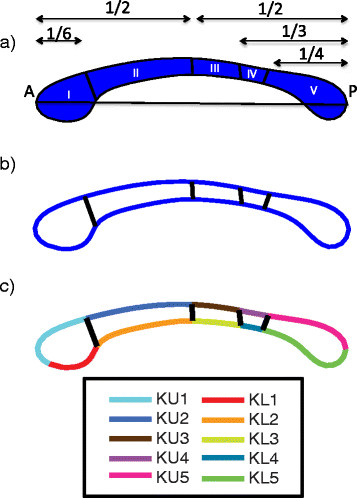
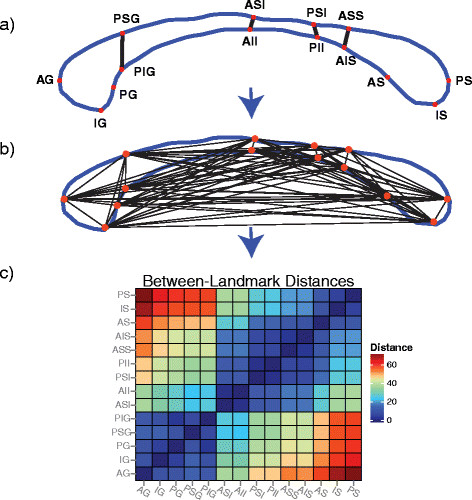
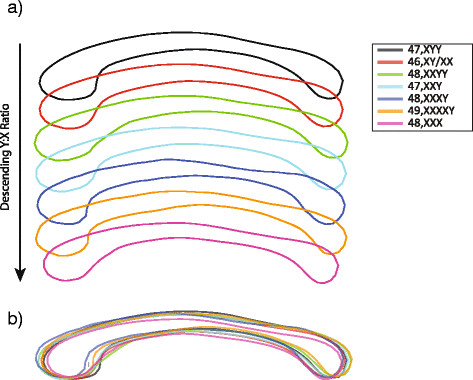
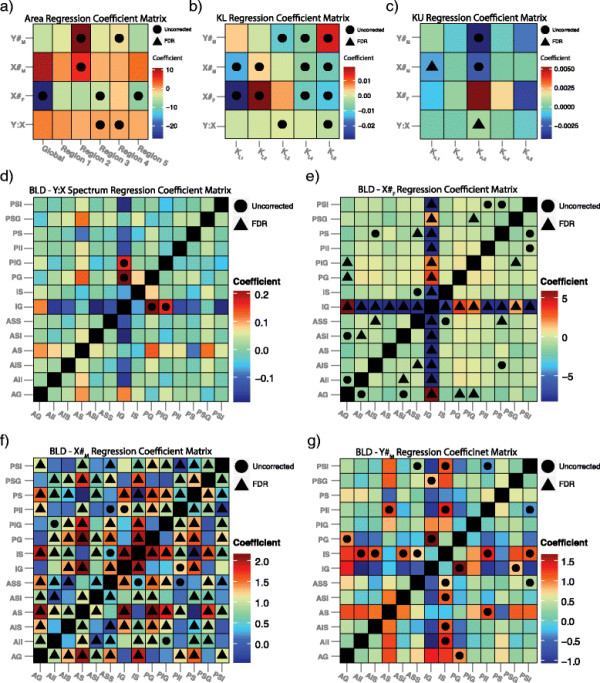
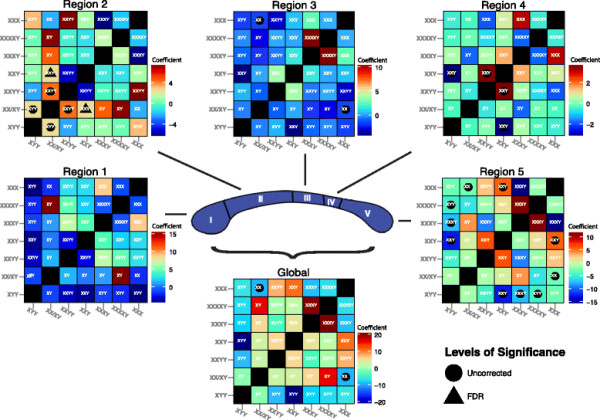
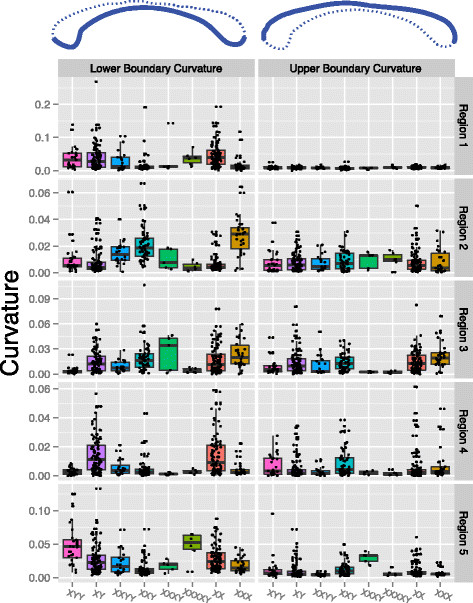
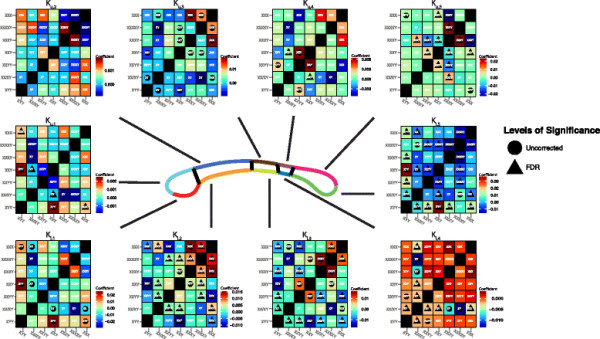
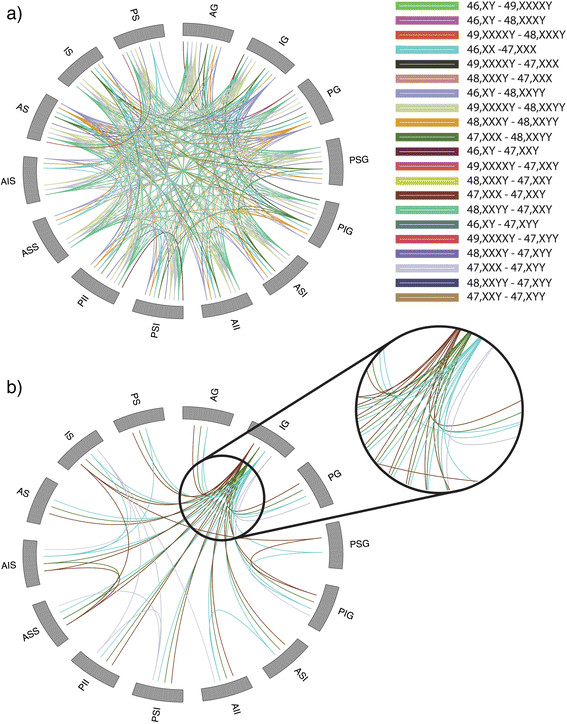
Methods: We investigated CC morphometry using local and global area, local curvature of the CC boundary, and between-landmark distance analysis (BLDA). We hypothesized that CC morphometry would vary differentially along a proposed spectrum of Y:X chromosome ratio with supernumerary Y karyotypes having the largest CC areas and supernumerary X karyotypes having significantly smaller CC areas. To investigate this, we defined an sSCA spectrum based on a descending Y:X karyotype ratio: 47,XYY, 46,XY, 48,XXYY, 47,XXY, 48,XXXY, 49,XXXXY, 46,XX, 47,XXX. We similarly explored the effects of both X and Y chromosome numbers within sex. Results of shape-based metrics were analyzed using permutation tests consisting of 5,000 iterations.
Results: Several subregional areas, local curvature, and BLDs differed between groups. Moderate associations were found between area and curvature in relation to the spectrum and X and Y chromosome counts. BLD was strongly associated with X chromosome count in both male and female groups.
Conclusions: Our results suggest that X- and Y-linked genes have differential effects on CC morphometry. To our knowledge, this is the first study to compare CC morphometry across these extremely rare groups.
Keywords: Aneuploidies; Corpus callosum; Sex chromosomes; Sexual differentiation; Statistical shape analysis.
Figures
Similar articles
-
Clinical, Cognitive and Neurodevelopmental Profile in Tetrasomies and Pentasomies: A Systematic Review.Children (Basel). 2022 Nov 9;9(11):1719. doi: 10.3390/children9111719. Children (Basel). 2022. PMID: 36360447 Free PMC article. Review.
-
Molecular diagnostic testing for Klinefelter syndrome and other male sex chromosome aneuploidies.Int J Pediatr Endocrinol. 2012 Apr 23;2012(1):8. doi: 10.1186/1687-9856-2012-8. Int J Pediatr Endocrinol. 2012. PMID: 22524164 Free PMC article.
-
An Allometric Analysis of Sex and Sex Chromosome Dosage Effects on Subcortical Anatomy in Humans.J Neurosci. 2016 Feb 24;36(8):2438-48. doi: 10.1523/JNEUROSCI.3195-15.2016. J Neurosci. 2016. PMID: 26911691 Free PMC article.
-
Behavioral phenotype of sex chromosome aneuploidies: 48,XXYY, 48,XXXY, and 49,XXXXY.Am J Med Genet A. 2007 Jun 1;143A(11):1198-203. doi: 10.1002/ajmg.a.31746. Am J Med Genet A. 2007. PMID: 17497714
-
Sex chromosome tetrasomy and pentasomy.Pediatrics. 1995 Oct;96(4 Pt 1):672-82. Pediatrics. 1995. PMID: 7567329 Review.
Cited by
-
White matter microstructure in a genetically defined group at increased risk of autism symptoms, and a comparison with idiopathic autism: an exploratory study.Brain Imaging Behav. 2016 Dec;10(4):1280-1288. doi: 10.1007/s11682-015-9496-z. Brain Imaging Behav. 2016. PMID: 26699143 Free PMC article.
-
Clinical, Cognitive and Neurodevelopmental Profile in Tetrasomies and Pentasomies: A Systematic Review.Children (Basel). 2022 Nov 9;9(11):1719. doi: 10.3390/children9111719. Children (Basel). 2022. PMID: 36360447 Free PMC article. Review.
-
Multimodal neuroimaging of male and female brain structure in health and disease across the life span.J Neurosci Res. 2017 Jan 2;95(1-2):371-379. doi: 10.1002/jnr.23919. J Neurosci Res. 2017. PMID: 27870421 Free PMC article. Review.
-
Demographic Composition of Participants in Sex Chromosome Aneuploidy Studies across the Globe: a 20-year Systematic Review.medRxiv [Preprint]. 2025 Jun 18:2025.06.17.25329799. doi: 10.1101/2025.06.17.25329799. medRxiv. 2025. PMID: 40585069 Free PMC article. Preprint.
References
Grants and funding
LinkOut - more resources
Full Text Sources
Other Literature Sources
