Comprehensive model of annual plankton succession based on the whole-plankton time series approach
- PMID: 25780912
- PMCID: PMC4363592
- DOI: 10.1371/journal.pone.0119219
Comprehensive model of annual plankton succession based on the whole-plankton time series approach
Abstract
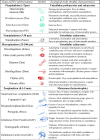
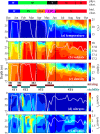
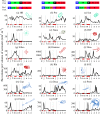
Ecological succession provides a widely accepted description of seasonal changes in phytoplankton and mesozooplankton assemblages in the natural environment, but concurrent changes in smaller (i.e. microbes) and larger (i.e. macroplankton) organisms are not included in the model because plankton ranging from bacteria to jellies are seldom sampled and analyzed simultaneously. Here we studied, for the first time in the aquatic literature, the succession of marine plankton in the whole-plankton assemblage that spanned 5 orders of magnitude in size from microbes to macroplankton predators (not including fish or fish larvae, for which no consistent data were available). Samples were collected in the northwestern Mediterranean Sea (Bay of Villefranche) weekly during 10 months. Simultaneously collected samples were analyzed by flow cytometry, inverse microscopy, FlowCam, and ZooScan. The whole-plankton assemblage underwent sharp reorganizations that corresponded to bottom-up events of vertical mixing in the water-column, and its development was top-down controlled by large gelatinous filter feeders and predators. Based on the results provided by our novel whole-plankton assemblage approach, we propose a new comprehensive conceptual model of the annual plankton succession (i.e. whole plankton model) characterized by both stepwise stacking of four broad trophic communities from early spring through summer, which is a new concept, and progressive replacement of ecological plankton categories within the different trophic communities, as recognised traditionally.
Conflict of interest statement
Figures


Similar articles
-
From plankton to top predators: bottom-up control of a marine food web across four trophic levels.J Anim Ecol. 2006 Nov;75(6):1259-68. doi: 10.1111/j.1365-2656.2006.01148.x. J Anim Ecol. 2006. PMID: 17032358
-
'End to end' planktonic trophic web and its implications for the mussel farms in the Mar Piccolo of Taranto (Ionian Sea, Italy).Environ Sci Pollut Res Int. 2016 Jul;23(13):12707-24. doi: 10.1007/s11356-015-5621-1. Epub 2015 Oct 24. Environ Sci Pollut Res Int. 2016. PMID: 26498814
-
Inter-annual variations of planktonic food webs in the northern Adriatic Sea.Sci Total Environ. 2005 Dec 15;353(1-3):218-31. doi: 10.1016/j.scitotenv.2005.09.016. Epub 2005 Oct 28. Sci Total Environ. 2005. PMID: 16257435
-
Long-term oceanographic and ecological research in the Western English Channel.Adv Mar Biol. 2005;47:1-105. doi: 10.1016/S0065-2881(04)47001-1. Adv Mar Biol. 2005. PMID: 15596166 Review.
-
Arsenobetaine formation in plankton: a review of studies at the base of the aquatic food chain.J Environ Monit. 2012 Nov;14(11):2841-53. doi: 10.1039/c2em30572k. J Environ Monit. 2012. PMID: 23014956 Review.
Cited by
-
Photoperiod-driven rhythms reveal multi-decadal stability of phytoplankton communities in a highly fluctuating coastal environment.Sci Rep. 2022 Mar 10;12(1):3908. doi: 10.1038/s41598-022-07009-6. Sci Rep. 2022. PMID: 35273208 Free PMC article.
-
Student's tutorial on bloom hypotheses in the context of phytoplankton annual cycles.Glob Chang Biol. 2018 Jan;24(1):55-77. doi: 10.1111/gcb.13858. Epub 2017 Sep 22. Glob Chang Biol. 2018. PMID: 28787760 Free PMC article.
-
Five-Year Time Series Reveals Short-Term Blooms of Planktonic Fungi in a Coastal Mediterranean Site.Environ Microbiol Rep. 2025 Aug;17(4):e70154. doi: 10.1111/1758-2229.70154. Environ Microbiol Rep. 2025. PMID: 40650523 Free PMC article.
-
In the right place, at the right time: the integration of bacteria into the Plankton Ecology Group model.Microbiome. 2023 May 20;11(1):112. doi: 10.1186/s40168-023-01522-0. Microbiome. 2023. PMID: 37210505 Free PMC article.
-
Plankton biogeography in the North Atlantic Ocean and its adjacent seas: Species assemblages and environmental signatures.Ecol Evol. 2021 Mar 24;11(10):5135-5149. doi: 10.1002/ece3.7406. eCollection 2021 May. Ecol Evol. 2021. PMID: 34025997 Free PMC article.
References
-
- Allen TFH, Bartell SM, Koonce JF. Multiple stable configurations in ordination of phytoplankton community change rates. Ecology. 1977; 58: 1076–1084. 10.2307/1936927 - DOI
-
- Margalef R. Temporal succession and spatial heterogeneity in natural phytoplankton In: Buzzati-Traverso A, editor. Perspectives in Marine Biology. Los Angeles: : University of California Press; 1958. pp. 323–349.
-
- Margalef R. 1967 Some concepts relative to the organization of plankton. In: Allen & Unwin, editors Oceanography and Marine Biology: An Annual Review. Aberdeen: Aberdeen University Press; 1967. pp. 257–289.
Publication types
MeSH terms
LinkOut - more resources
Full Text Sources
Other Literature Sources

