

Functional analysis of sirtuin genes in multiple Plasmodium falciparum strains
- PMID: 25780929
- PMCID: PMC4364008
- DOI: 10.1371/journal.pone.0118865
Functional analysis of sirtuin genes in multiple Plasmodium falciparum strains
Abstract
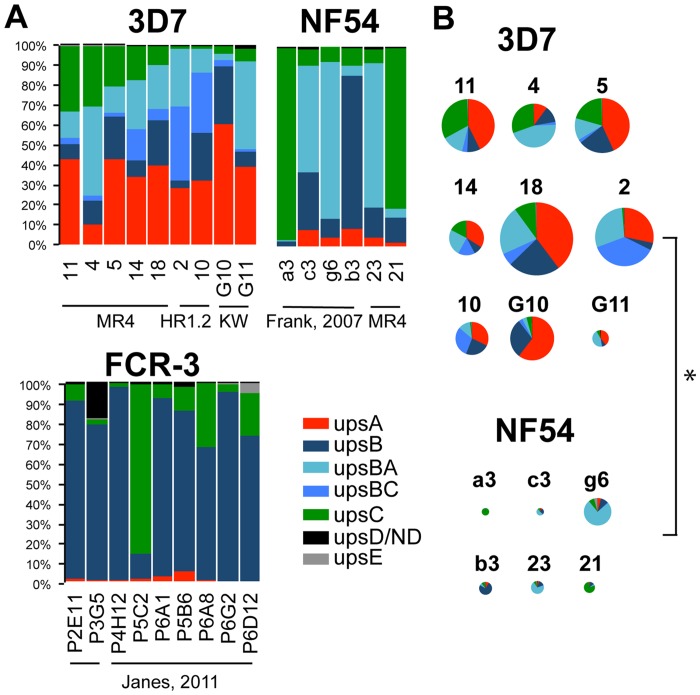
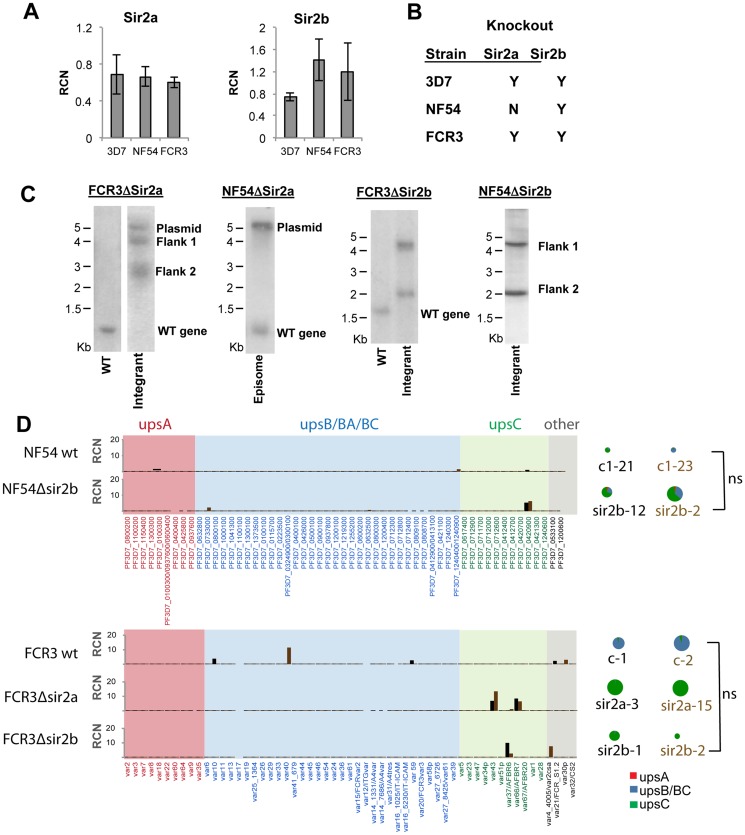
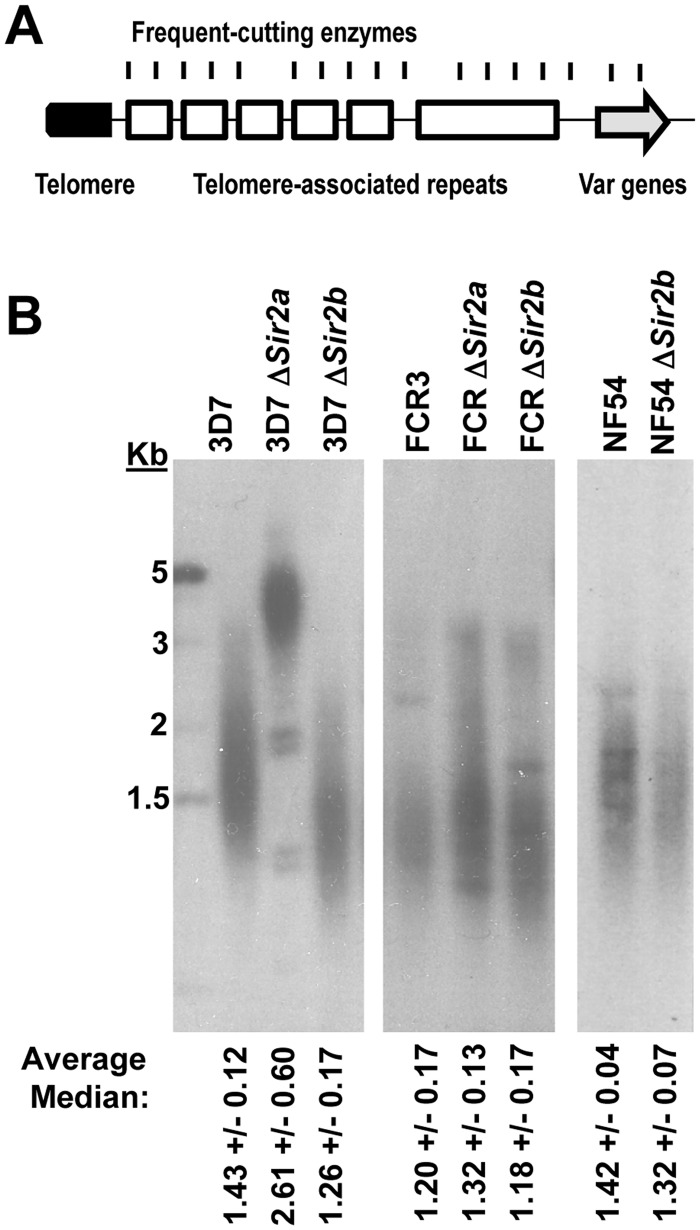
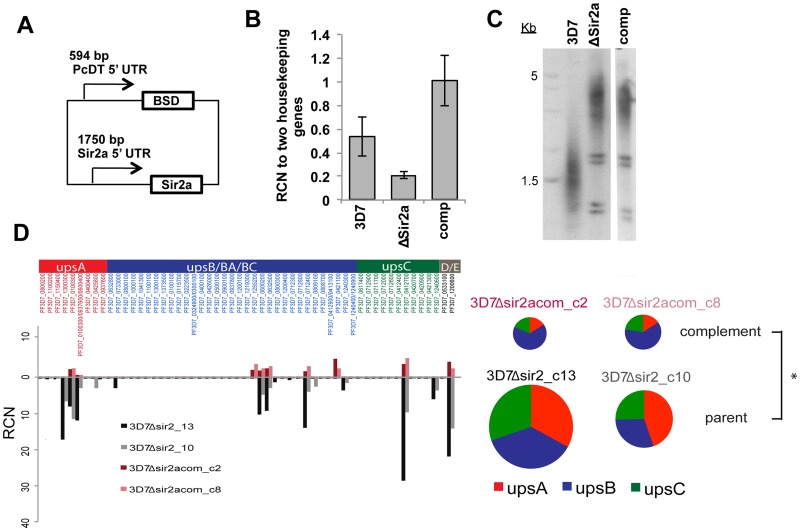
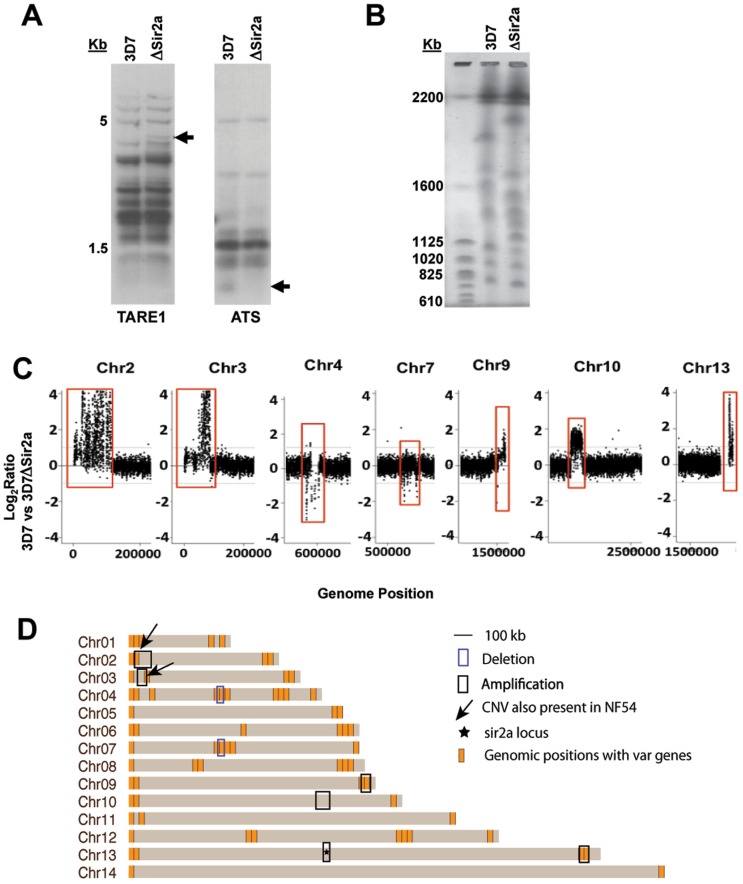
Plasmodium falciparum, the causative agent of severe human malaria, employs antigenic variation to avoid host immunity. Antigenic variation is achieved by transcriptional switching amongst polymorphic var genes, enforced by epigenetic modification of chromatin. The histone-modifying 'sirtuin' enzymes PfSir2a and PfSir2b have been implicated in this process. Disparate patterns of var expression have been reported in patient isolates as well as in cultured strains. We examined var expression in three commonly used laboratory strains (3D7, NF54 and FCR-3) in parallel. NF54 parasites express significantly lower levels of var genes compared to 3D7, despite the fact that 3D7 was originally a clone of the NF54 strain. To investigate whether this was linked to the expression of sirtuins, genetic disruption of both sirtuins was attempted in all three strains. No dramatic changes in var gene expression occurred in NF54 or FCR-3 following PfSir2b disruption, contrasting with previous observations in 3D7. In 3D7, complementation of the PfSir2a genetic disruption resulted in a significant decrease in previously-elevated var gene expression levels, but with the continued expression of multiple var genes. Finally, rearranged chromosomes were observed in the 3D7 PfSir2a knockout line. Our results focus on the potential for parasite genetic background to contribute to sirtuin function in regulating virulence gene expression and suggest a potential role for sirtuins in maintaining genome integrity.
Conflict of interest statement
Figures
Similar articles
-
Sir2 paralogues cooperate to regulate virulence genes and antigenic variation in Plasmodium falciparum.PLoS Biol. 2009 Apr 14;7(4):e84. doi: 10.1371/journal.pbio.1000084. PLoS Biol. 2009. PMID: 19402747 Free PMC article.
-
Febrile temperature causes transcriptional downregulation of Plasmodium falciparum Sirtuins through Hsp90-dependent epigenetic modification.Mol Microbiol. 2021 May;115(5):1025-1038. doi: 10.1111/mmi.14692. Epub 2021 Feb 13. Mol Microbiol. 2021. PMID: 33538363
-
The effect of Plasmodium falciparum Sir2a histone deacetylase on clonal and longitudinal variation in expression of the var family of virulence genes.Int J Parasitol. 2010 Jan;40(1):35-43. doi: 10.1016/j.ijpara.2009.06.012. Epub 2009 Aug 8. Int J Parasitol. 2010. PMID: 19666023
-
Plasmodium falciparum: epigenetic control of var gene regulation and disease.Subcell Biochem. 2013;61:659-82. doi: 10.1007/978-94-007-4525-4_28. Subcell Biochem. 2013. PMID: 23150271 Review.
-
Antigenic variation in Plasmodium falciparum.Annu Rev Microbiol. 2008;62:445-70. doi: 10.1146/annurev.micro.61.080706.093134. Annu Rev Microbiol. 2008. PMID: 18785843 Review.
Cited by
-
Heat Shock Protein 90 Regulates the Activity of Histone Deacetylase Sir2 in Plasmodium falciparum.mSphere. 2022 Oct 26;7(5):e0032922. doi: 10.1128/msphere.00329-22. Epub 2022 Sep 19. mSphere. 2022. PMID: 36121150 Free PMC article.
-
Epigenetic Regulation of Virulence Gene Expression in Parasitic Protozoa.Cell Host Microbe. 2016 May 11;19(5):629-40. doi: 10.1016/j.chom.2016.04.020. Cell Host Microbe. 2016. PMID: 27173931 Free PMC article. Review.
-
Patterns of Heterochromatin Transitions Linked to Changes in the Expression of Plasmodium falciparum Clonally Variant Genes.Microbiol Spectr. 2023 Feb 14;11(1):e0304922. doi: 10.1128/spectrum.03049-22. Epub 2022 Dec 14. Microbiol Spectr. 2023. PMID: 36515553 Free PMC article.
-
The Role of the Histone Methyltransferase PfSET10 in Antigenic Variation by Malaria Parasites: a Cautionary Tale.mSphere. 2021 Feb 3;6(1):e01217-20. doi: 10.1128/mSphere.01217-20. mSphere. 2021. PMID: 33536326 Free PMC article.
-
A nuclear redox sensor modulates gene activation and var switching in Plasmodium falciparum.Proc Natl Acad Sci U S A. 2022 Aug 16;119(33):e2201247119. doi: 10.1073/pnas.2201247119. Epub 2022 Aug 8. Proc Natl Acad Sci U S A. 2022. PMID: 35939693 Free PMC article.
References
-
- Baruch DI, Pasloske BL, Singh HB, Bi X, Ma XC, Feldman M, et al. Cloning the P. falciparum gene encoding PfEMP1, a malarial variant antigen and adherence receptor on the surface of parasitized human erythrocytes. Cell. 1995; 82: 77–87. - PubMed
-
- Su XZ, Heatwole VM, Wertheimer SP, Guinet F, Herrfeldt JA, Peterson DS, et al. The large diverse gene family var encodes proteins involved in cytoadherence and antigenic variation of Plasmodium falciparum-infected erythrocytes. Cell. 1995; 82: 89–100. - PubMed
-
- Bull PC, Marsh K. The role of antibodies to Plasmodium falciparum-infected-erythrocyte surface antigens in naturally acquired immunity to malaria. Trends Microbiol. 2002; 10: 55–58. - PubMed
Publication types
MeSH terms
Substances
Grants and funding
LinkOut - more resources
Full Text Sources
Other Literature Sources
Molecular Biology Databases
