Decreases in mitochondrial reactive oxygen species initiate GABA(A) receptor-mediated electrical suppression in anoxia-tolerant turtle neurons
- PMID: 25781154
- PMCID: PMC4457194
- DOI: 10.1113/JP270474
Decreases in mitochondrial reactive oxygen species initiate GABA(A) receptor-mediated electrical suppression in anoxia-tolerant turtle neurons
Abstract
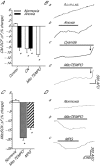
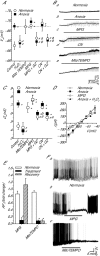
Anoxia induces hyper-excitability and cell death in mammalian brain but in the anoxia-tolerant western painted turtle (Chrysemys picta bellii) neuronal electrical activity is suppressed (i.e. spike arrest), adenosine triphosphate (ATP) consumption is reduced, and cell death does not occur. Electrical suppression is primarily the result of enhanced γ-aminobutyric acid (GABA) transmission; however, the underlying mechanism responsible for initiating oxygen-sensitive GABAergic spike arrest is unknown. In turtle cortical pyramidal neurons there are three types of GABA(A) receptor-mediated currents: spontaneous inhibitory postsynaptic currents (IPSCs), giant IPSCs and tonic currents. The aim of this study was to assess the effects of reactive oxygen species (ROS) scavenging on these three currents since ROS levels naturally decrease with anoxia and may serve as a redox signal to initiate spike arrest. We found that anoxia, pharmacological ROS scavenging, or inhibition of mitochondrial ROS generation enhanced all three types of GABA currents, with tonic currents comprising ∼50% of the total current. Application of hydrogen peroxide inhibited all three GABA currents, demonstrating a reversible redox-sensitive signalling mechanism. We conclude that anoxia-mediated decreases in mitochondrial ROS production are sufficient to initiate a redox-sensitive inhibitory GABA signalling cascade that suppresses electrical activity when oxygen is limited. This unique strategy for reducing neuronal ATP consumption during anoxia represents a natural mechanism in which to explore therapies to protect mammalian brain from low-oxygen insults.
© 2015 The Authors. The Journal of Physiology © 2015 The Physiological Society.
Figures


Similar articles
-
Oxygen-sensitive interneurons exhibit increased activity and GABA release during ROS scavenging in the cerebral cortex of the western painted turtle.J Neurophysiol. 2019 Aug 1;122(2):466-479. doi: 10.1152/jn.00104.2019. Epub 2019 May 29. J Neurophysiol. 2019. PMID: 31141433 Free PMC article.
-
Taurine activates glycine and GABAA receptor currents in anoxia-tolerant painted turtle pyramidal neurons.J Exp Biol. 2018 Nov 5;221(Pt 21):jeb181529. doi: 10.1242/jeb.181529. J Exp Biol. 2018. PMID: 30237241
-
Scavenging ROS dramatically increase NMDA receptor whole-cell currents in painted turtle cortical neurons.J Exp Biol. 2014 Sep 15;217(Pt 18):3346-55. doi: 10.1242/jeb.105825. Epub 2014 Jul 25. J Exp Biol. 2014. PMID: 25063855
-
Oxygen sensitive synaptic neurotransmission in anoxia-tolerant turtle cerebrocortex.Adv Exp Med Biol. 2012;758:71-9. doi: 10.1007/978-94-007-4584-1_10. Adv Exp Med Biol. 2012. PMID: 23080145 Review.
-
Review: A history and perspective of mitochondria in the context of anoxia tolerance.Comp Biochem Physiol B Biochem Mol Biol. 2022 Jun-Jul;260:110733. doi: 10.1016/j.cbpb.2022.110733. Epub 2022 Mar 12. Comp Biochem Physiol B Biochem Mol Biol. 2022. PMID: 35288242 Review.
Cited by
-
Impaired Autophagy of GABAergic Interneurons in Neuropathic Pain.Pain Res Manag. 2018 Sep 25;2018:9185368. doi: 10.1155/2018/9185368. eCollection 2018. Pain Res Manag. 2018. PMID: 30356379 Free PMC article. Review.
-
Dysfunction of inhibitory interneurons contributes to synaptic plasticity via GABABR-pNR2B signaling in a chronic migraine rat model.Front Mol Neurosci. 2023 May 26;16:1142072. doi: 10.3389/fnmol.2023.1142072. eCollection 2023. Front Mol Neurosci. 2023. PMID: 37324588 Free PMC article.
-
Adenosine and γ-aminobutyric acid partially regulate metabolic and ventilatory responses of Damaraland mole-rats to acute hypoxia.J Exp Biol. 2023 Oct 1;226(19):jeb246186. doi: 10.1242/jeb.246186. Epub 2023 Oct 6. J Exp Biol. 2023. PMID: 37694288 Free PMC article.
-
Alfaxalone does not have long-term effects on goldfish pyramidal neuron action potential properties or GABAA receptor currents.FEBS Open Bio. 2024 Apr;14(4):555-573. doi: 10.1002/2211-5463.13777. Epub 2024 Feb 11. FEBS Open Bio. 2024. PMID: 38342633 Free PMC article.
-
Oxygen-sensitive interneurons exhibit increased activity and GABA release during ROS scavenging in the cerebral cortex of the western painted turtle.J Neurophysiol. 2019 Aug 1;122(2):466-479. doi: 10.1152/jn.00104.2019. Epub 2019 May 29. J Neurophysiol. 2019. PMID: 31141433 Free PMC article.
References
-
- Adam-Vizi V. Production of reactive oxygen species in brain mitochondria: Contribution by electron transport chain and non-electron transport chain sources. Antioxid Redox Signal. 2005;7:1140–1149. - PubMed
-
- Archer S. Michelakis E. The mechanism(s) of hypoxic pulmonary vasoconstriction: potassium channels, redox O2 sensors, and controversies. News Physiol Sci. 2002;17:131–137. - PubMed
-
- Bai D, Zhu G, Pennefather P, Jackson MF, MacDonald JF. Orser BA. Distinct functional and pharmacological properties of tonic and quantal inhibitory postsynaptic currents mediated by γ-aminobutyric acidA receptors in hippocampal neurons. Mol Pharmacol. 2001;59:814–824. - PubMed
Publication types
MeSH terms
Substances
LinkOut - more resources
Full Text Sources

