

Antioxidant icariside II combined with insulin restores erectile function in streptozotocin-induced type 1 diabetic rats
- PMID: 25781208
- PMCID: PMC4420599
- DOI: 10.1111/jcmm.12480
Antioxidant icariside II combined with insulin restores erectile function in streptozotocin-induced type 1 diabetic rats
Abstract
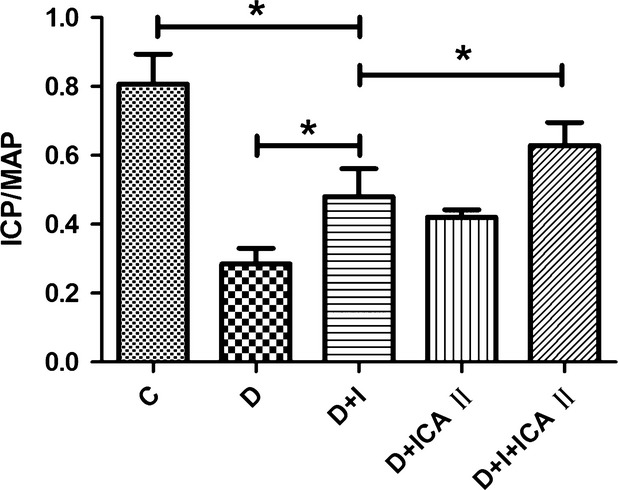
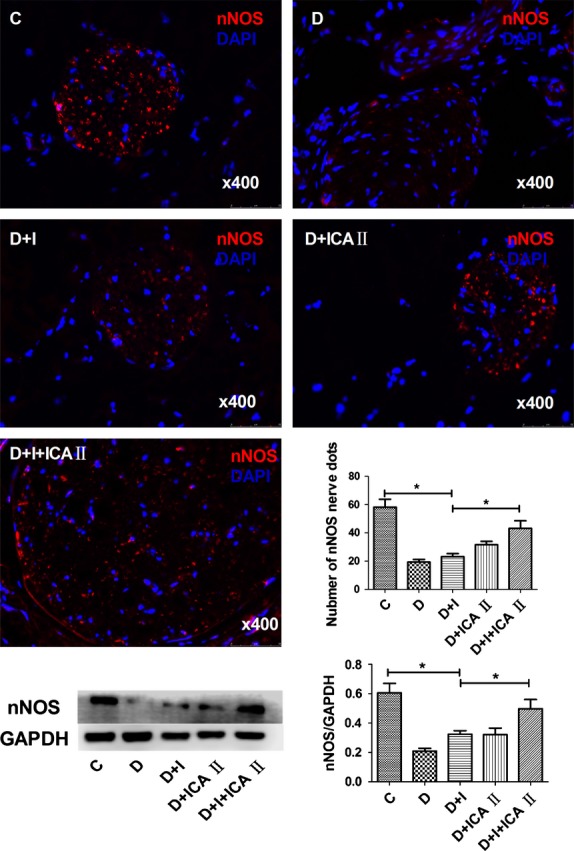
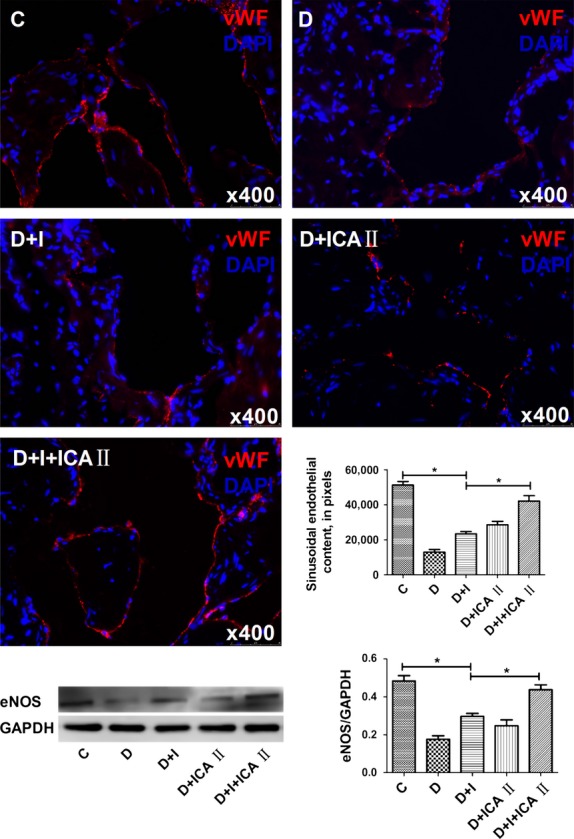
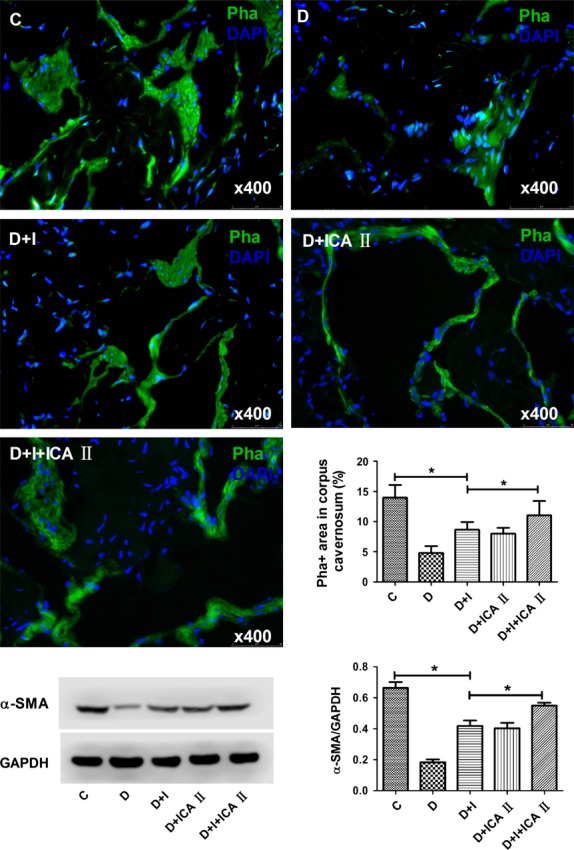
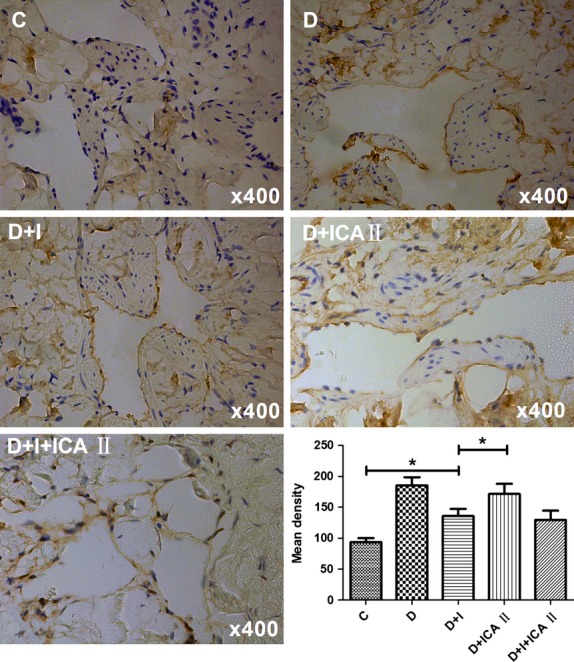
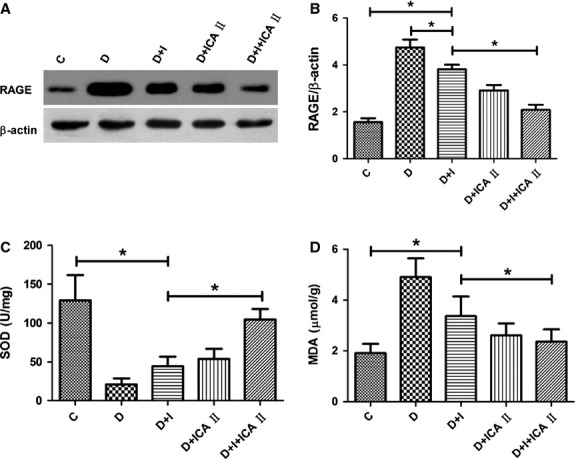
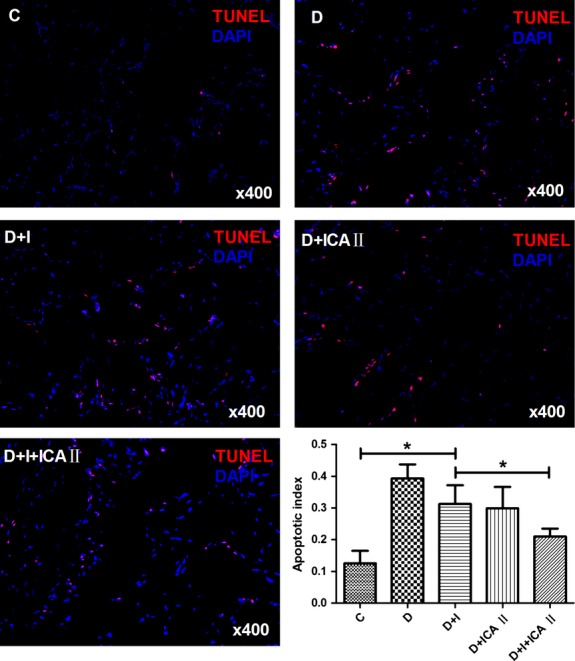
Erectile dysfunction (ED) worsens in patients with diabetes mellitus (DM) despite good control of blood glucose level with insulin. Recent studies imply that diabetic vascular stresses (e.g. oxidative stress) persist in spite of glucose normalization, which is defined as metabolic memory. Studies suggest that the interaction between advanced glycation end products (AGEs) and their receptor (RAGE) mediates the development of metabolic memory. To investigate the effects of the antioxidant icariside II plus insulin on erectile function in streptozotocin (STZ)- induced type 1 diabetic rats. Fifty 8-week-old Sprague-Dawley rats were randomly distributed into five groups: normal control, diabetic, insulin-treated diabetic, icariside II-treated diabetic, and insulin plus icariside II-treated diabetic. Diabetes was induced by a single intraperitoneal injection of STZ. Eight weeks after induction of diabetes, icariside II was administered by gastric lavage once a day (5 mg/kg) for 6 weeks; and 2-6 units of intermediate-acting insulin were given to maintain normal glycemia for 6 weeks. The main outcome measures were the ratio of intracavernous pressure (ICP) to mean arterial pressure (MAP); histology of penile endothelial cells and smooth muscle cells; neural nitric oxide synthase, AGEs and RAGE expression; malondialdehyde concentration; superoxide dismutase activity; and apoptosis index. Diabetic rats demonstrated a significantly lower ICP/MAP ratio, reduced penile endothelial cells, reduced smooth muscle cells, increased AGEs and RAGE, and increased apoptosis. Insulin and icariside II monotherapy partially restored erectile function and histological changes. However, the combination therapy group showed significantly better erectile parameters, cytological components and biochemistry, similar to those in the normal control group. These results suggest that, although insulin can effectively control glycemic levels, it does not completely alter the pathological changes in erectile tissues. Better efficacy could be expected with tight glycemic control plus the antioxidant icariside II. The proposed combination therapy might have the potential to eliminate metabolic memory by down-regulating the AGEs-RAGE-oxidative stress axis.
Keywords: diabetes mellitus; erectile dysfunction; icariside II; metabolic memory.
© 2015 The Authors. Journal of Cellular and Molecular Medicine published by John Wiley & Sons Ltd and Foundation for Cellular and Molecular Medicine.
Figures
Similar articles
-
AGE-breaker ALT-711 plus insulin could restore erectile function in streptozocin-induced type 1 diabetic rats.J Sex Med. 2014 Jun;11(6):1452-62. doi: 10.1111/jsm.12533. Epub 2014 Apr 28. J Sex Med. 2014. PMID: 24766706
-
Effects of icariside II on improving erectile function in rats with streptozotocin-induced diabetes.J Androl. 2012 Sep-Oct;33(5):832-44. doi: 10.2164/jandrol.111.015172. Epub 2012 Mar 8. J Androl. 2012. PMID: 22403279
-
Effect of chronic administration of PDE5 combined with glycemic control on erectile function in streptozotocin-induced diabetic rats.J Sex Med. 2015 Mar;12(3):600-10. doi: 10.1111/jsm.12752. Epub 2014 Nov 20. J Sex Med. 2015. PMID: 25411013
-
Melatonin prevents deterioration of erectile function in streptozotocin-induced diabetic rats via sirtuin-1 expression.Andrologia. 2020 Oct;52(9):e13639. doi: 10.1111/and.13639. Epub 2020 Jun 1. Andrologia. 2020. PMID: 32478903 Review.
-
Therapeutic effects of icariin and icariside II on diabetes mellitus and its complications.Crit Rev Food Sci Nutr. 2024;64(17):5852-5877. doi: 10.1080/10408398.2022.2159317. Epub 2023 Jan 2. Crit Rev Food Sci Nutr. 2024. PMID: 36591787 Review.
Cited by
-
Neuroprotective effects of melatonin on erectile dysfunction in streptozotocin-induced diabetic rats.Int Urol Nephrol. 2018 Nov;50(11):1981-1988. doi: 10.1007/s11255-018-1989-4. Epub 2018 Sep 21. Int Urol Nephrol. 2018. PMID: 30242548
-
Icariside II, a phosphodiesterase 5 inhibitor, attenuates cerebral ischaemia/reperfusion injury by inhibiting glycogen synthase kinase-3β-mediated activation of autophagy.Br J Pharmacol. 2020 Mar;177(6):1434-1452. doi: 10.1111/bph.14912. Epub 2020 Feb 16. Br J Pharmacol. 2020. PMID: 31658364 Free PMC article.
-
Icariin inhibits hyperglycemia-induced cell death in penile cavernous tissue and improves erectile function in type 1 diabetic rats.Sex Med. 2025 Mar 27;13(1):qfaf017. doi: 10.1093/sexmed/qfaf017. eCollection 2025 Feb. Sex Med. 2025. PMID: 40161546 Free PMC article.
-
Pharmacological and Therapeutic Potential of a Natural Flavonoid Icariside II in Human Complication.Curr Drug Targets. 2025;26(5):320-330. doi: 10.2174/0113894501329810241117231839. Curr Drug Targets. 2025. PMID: 39757637 Review.
-
A Novel Flavonoid Derivative of Icariside II (YS-10) Improves Erectile Dysfunction in a Diabetic Rat Model by Inhibiting Ferroptosis via Activation of the Nrf2/HO-1/GPX4 Pathway.Drug Des Devel Ther. 2025 May 28;19:4481-4500. doi: 10.2147/DDDT.S518992. eCollection 2025. Drug Des Devel Ther. 2025. PMID: 40453214 Free PMC article.
References
-
- Castro RP, Hernandez PC, Casilda RR, et al. Epidemiology of erectile dysfunction risk factors. Arch Esp Urol. 2010;63:637–9. - PubMed
-
- Ayta IA, McKinlay JB, Krane RJ. The likely worldwide increase in erectile dysfunction between 1995 and 2025 and some possible policy consequences. BJU Int. 1999;84:50–6. - PubMed
-
- Ponholzer A, Temml C, Mock K, et al. Prevalence and risk factors for erectile dysfunction in 2869 men using a validated questionnaire. Eur Urol. 2005;47:80–5. - PubMed
-
- Thorve VS, Kshirsagar AD, Vyawahare NS, et al. Diabetes-induced erectile dysfunction: epidemiology, pathophysiology and management. J Diabetes Complications. 2011;25:129–36. - PubMed
-
- Cheitlin MD. Erectile dysfunction: the earliest sign of generalized vascular disease? J Am Coll Cardiol. 2004;43:185–6. - PubMed
Publication types
MeSH terms
Substances
LinkOut - more resources
Full Text Sources
Other Literature Sources
Medical
