. 2015 Mar;20(3):035004.
doi: 10.1117/1.JBO.20.3.035004.

Monte Carlo modeling of light propagation in the human head for applications in sinus imaging

Affiliations

Monte Carlo modeling of light propagation in the human head for applications in sinus imaging

Albert E Cerussi et al. J Biomed Opt. 2015 Mar.

Abstract

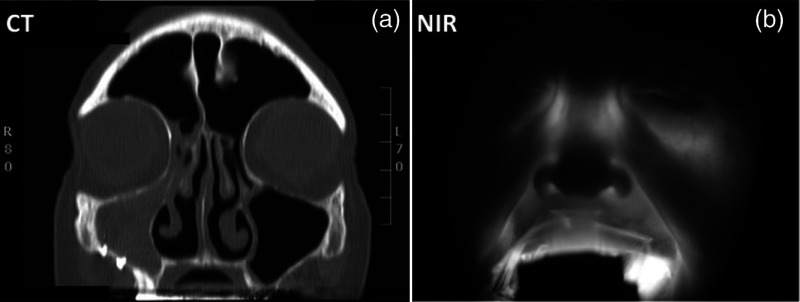
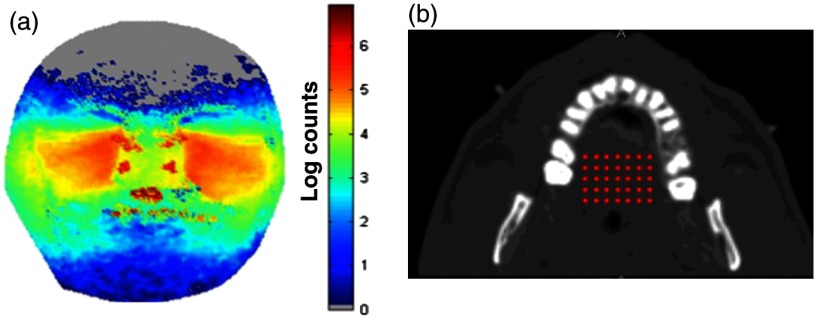
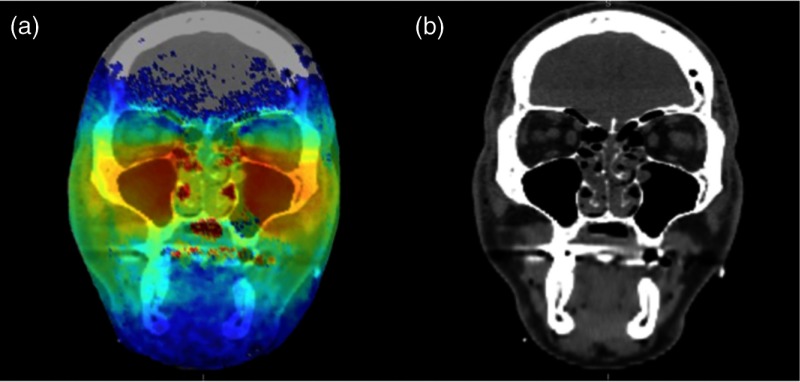
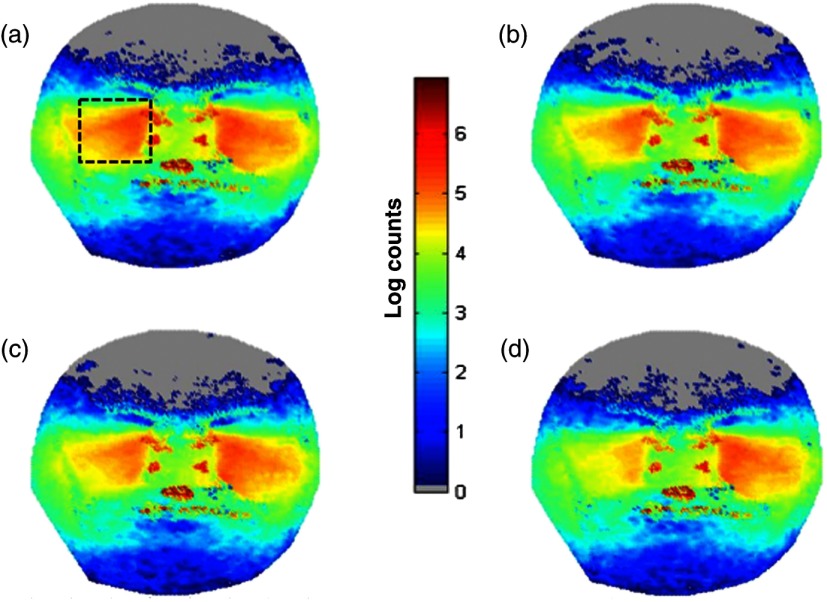
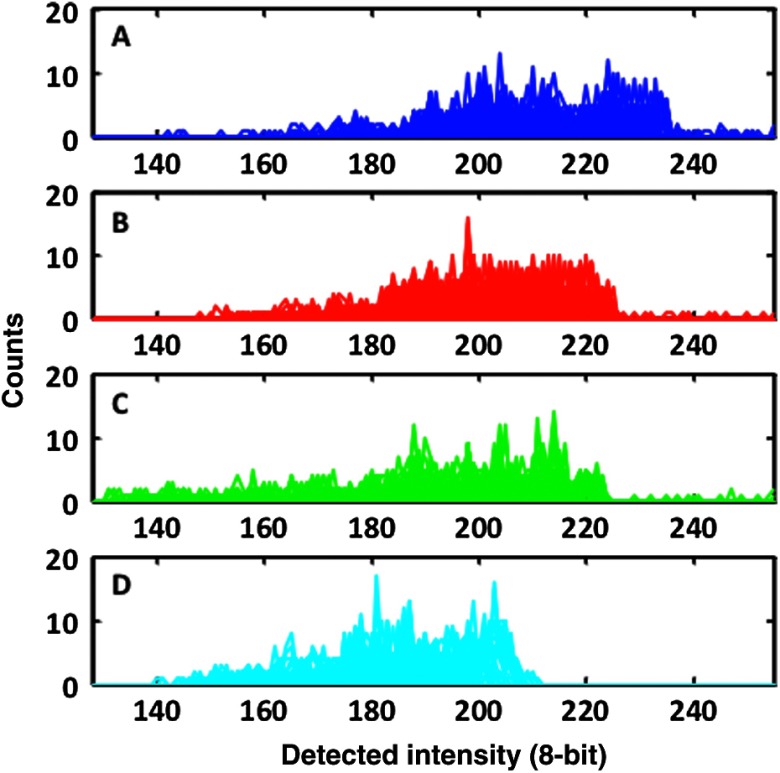
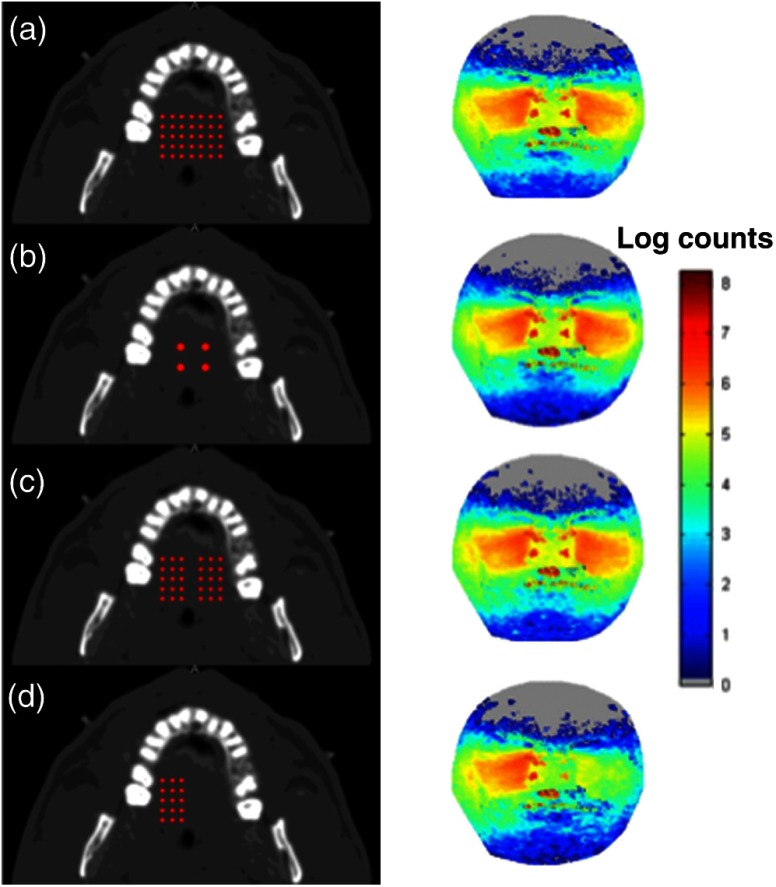
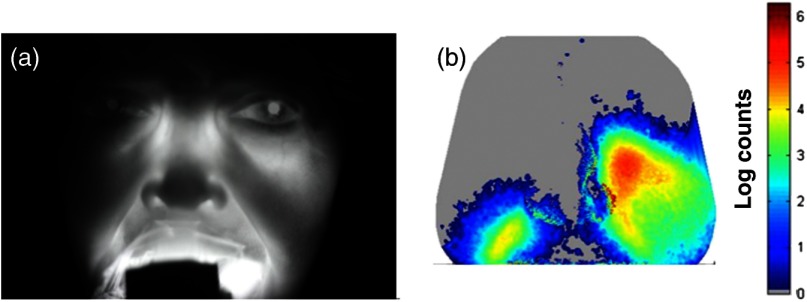
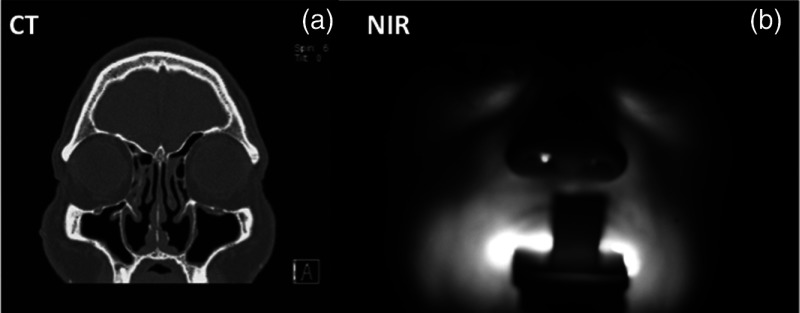
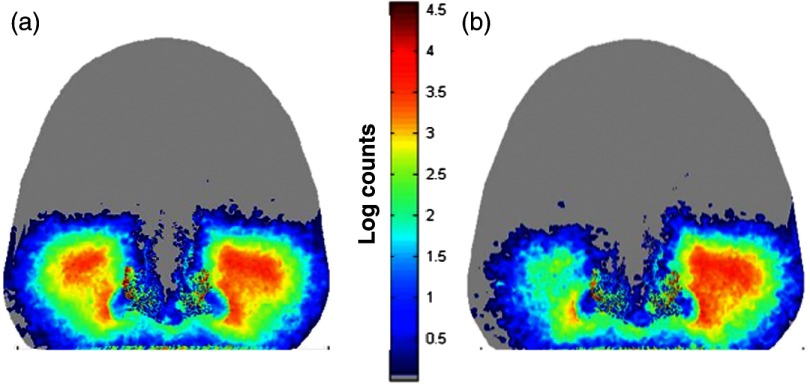
Sinus blockages are a common reason for physician visits, affecting one out of seven people in the United States, and often require medical treatment. Diagnosis in the primary care setting is challenging because symptom criteria (via detailed clinical history) plus objective imaging [computed tomography (CT) or endoscopy] are recommended. Unfortunately, neither option is routinely available in primary care. We previously demonstrated that low-cost near-infrared (NIR) transillumination correlates with the bulk findings of sinus opacity measured by CT. We have upgraded the technology, but questions of source optimization, anatomical influence, and detection limits remain. In order to begin addressing these questions, we have modeled NIR light propagation inside a three-dimensional adult human head constructed via CT images using a mesh-based Monte Carlo algorithm (MMCLAB). In this application, the sinus itself, which when healthy is a void region (e.g., nonscattering), is the region of interest. We characterize the changes in detected intensity due to clear (i.e., healthy) versus blocked sinuses and the effect of illumination patterns. We ran simulations for two clinical cases and compared simulations with measurements. The simulations presented herein serve as a proof of concept that this approach could be used to understand contrast mechanisms and limitations of NIR sinus imaging.


Figures

Fig. 1
Fig. 1
Example of near-infrared (NIR) optical imaging in the maxillary sinus. The patient presents a blocked right sinus as indicated in the computed tomography (CT) image slice (a). The patient’s left sinus is clear as shown by the thin white lining in the void region (black). The patient’s right sinus is completely filled (i.e., high opacity). The corresponding NIR image (b) mirrors the opacity of the CT image. The light source, composed of 850 nm LEDs, was placed inside the mouth to transilluminate the sinus. The bright aura around the mouth is due to source light leakage through the mouth area.
Fig. 2
Fig. 2
Representative Monte Carlo simulations of exiting photons through the three-dimensional (3-D)-generated mesh generated from CT data (a). In this geometry, an array of light sources (red dots) was placed onto the hard palate (b) as indicated in the transverse CT image. Each source (red dot) was considered to have equal strength (106  photons/source location).
Fig. 3
Fig. 3
Overlay of the detected photon counts onto a coronal CT slice of patient #1 (a). The CT image alone is provided as a reference (b).
Fig. 4
Fig. 4
Effect of blocked sinuses simulated in the “Adam” patient of the visible human project (patient #1). (a) The “normal” case as presented in Fig. 2. (b) Simulates a water-filled sinus. (c) Simulates increased mucosal thickening of an otherwise air-filled sinus. (d) Simulates a water plus debris-filled sinus with normal mucosal thickening. The dashed box in (a) is the approximate region of the sinus to be analyzed further in the next figure. See the text for details.
Fig. 5
Fig. 5
Histograms of the simulated changes in sinus cavity material provided in Fig. 4. Each simulation was converted into an 8-bit grayscale image. A histogram of the right sinus (indicated by the boxed area) is provided for each of the four cases. The mean and distribution of the histogram changes each time as the volume and contents of the sinus are changed.
Fig. 6
Fig. 6
Effect of source placement in patient #1. (a) Simulates an array of 35 light sources of equal intensity (106  photons/source). (b) Simulates a smaller four source array but of nearly the same total intensity (8×10⁶  photons/source). (c) The removal of the center line of sources from the array in (a) without changing the intensity (still 106  photons/source). (d) Further removes sources to illuminate only one side (still 106  photons/source) using a 3×5 array.
Fig. 7
Fig. 7
Computer simulation using 3-D CT scan and Monte Carlo model compared to experiment for a case of advanced sinusitis. The CT image for patient #2 is provided in Fig. 1 and reveals that the right maxillary sinus is completely blocked. The high opacity of the sinus is evident in the NIR image of the patient (a). Using the patient’s 3-D CT scan slices, we simulate what the clinical image should look like in (b). The main features of the image (low opacity on left, high opacity on right) are clearly visible. In this case, the illumination of the region near the ethmoid sinuses is not visible in the simulation.
Fig. 8
Fig. 8
Patient #3 with representative CT slice (a) and NIR image (b). Note that the patient’s right sinus cavity is slightly smaller in volume due to the thickening of the membranes observed near the bottom of the right maxillary sinus cavity.
Fig. 9
Fig. 9
Simulations showing progression of sinus disease. (a) The simulation of the case corresponding to the clinical image of patient #3 (Fig. 8). (b) A simulation of further disease progression where we increased mucosal thickening by an additional 3 mm. Note that the trend of asymmetry continues and becomes significantly visible with increased mucosal thickening. Light attenuation increases as a result of the reduced air volume in the sinus due to mucosal thickening.

Similar articles

References

    1. Mahmood U., et al. , “Near-infrared imaging of the sinuses: preliminary evaluation of a new technology for diagnosing maxillary sinusitis,” J. Biomed. Opt. 15, 036011 (2010).JBOPFO10.1117/1.3431718 - DOI - PMC - PubMed
    1. Rosenfeld R. M., et al. , “Clinical practice guideline: adult sinusitis,” Otolaryngol. Head Neck Surg. 137, S1–31 (2007).OHNSDL10.1016/j.otohns.2007.06.726 - DOI - PubMed
    1. Stankiewicz J. A., Chow J. M., “A diagnostic dilemma for chronic rhinosinusitis: definition accuracy and validity,” Am. J. Rhinol. 16, 199–202 (2002).AJRHE5 - PubMed
    1. Bhattacharyya N., “Clinical and symptom criteria for the accurate diagnosis of chronic rhinosinusitis,” Laryngoscope 116, 1–22 (2006).LARYA810.1097/01.mlg.0000224508.59725.19 - DOI - PubMed
    1. Kenny T. J., et al. , “Prospective analysis of sinus symptoms and correlation with paranasal computed tomography scan,” Otolaryngol. Head Neck Surg. 125, 40–43 (2001).OHNSDL10.1067/mhn.2001.116779 - DOI - PubMed

Publication types