. 2015 Mar 17;10(3):e0120504.
doi: 10.1371/journal.pone.0120504. eCollection 2015.

Altered microbiomes in bovine digital dermatitis lesions, and the gut as a pathogen reservoir

Affiliations

Altered microbiomes in bovine digital dermatitis lesions, and the gut as a pathogen reservoir

Martin Zinicola et al. PLoS One. .

Abstract

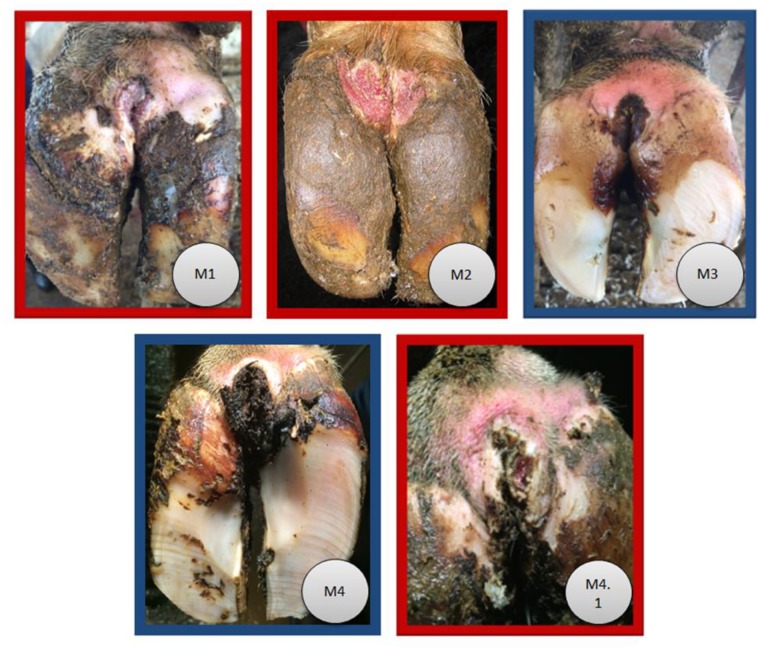
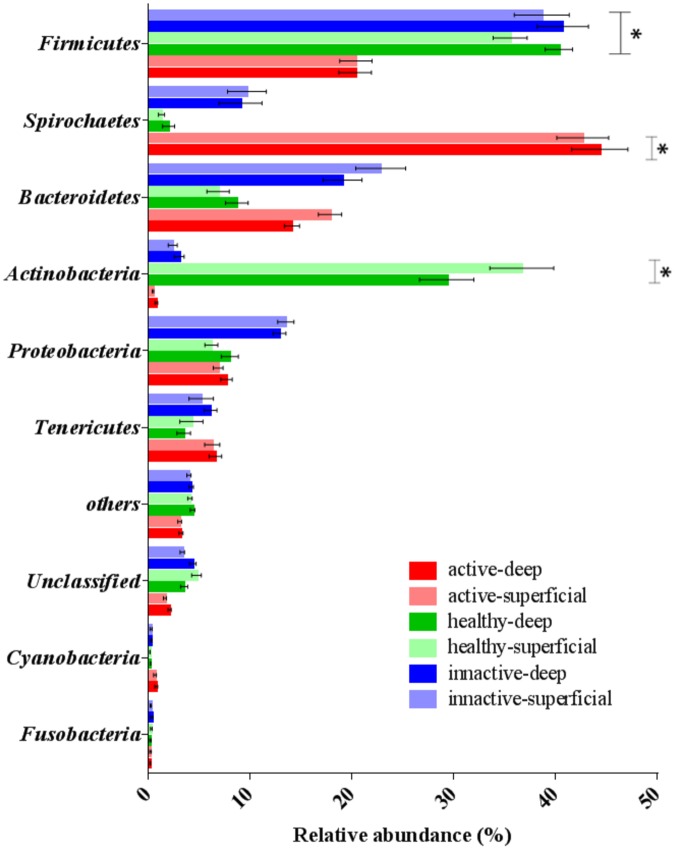
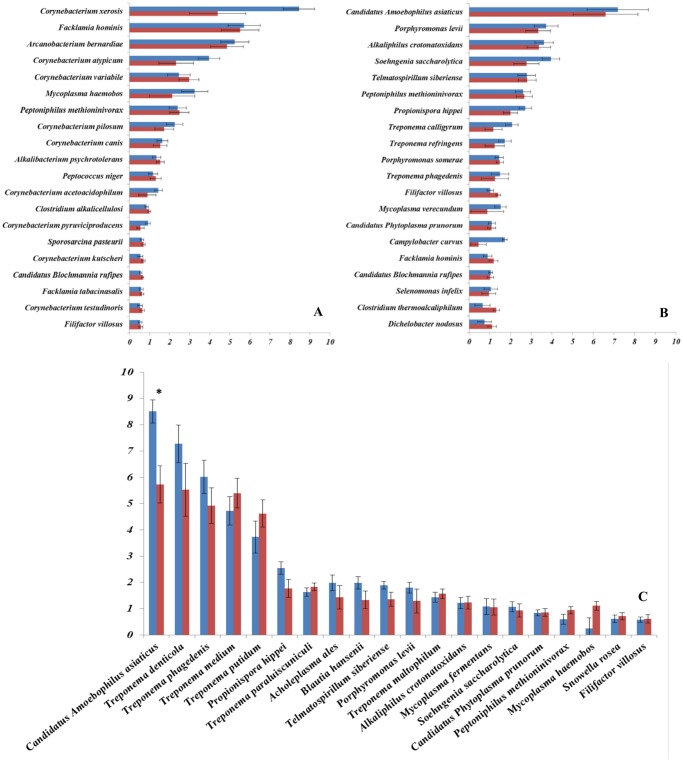
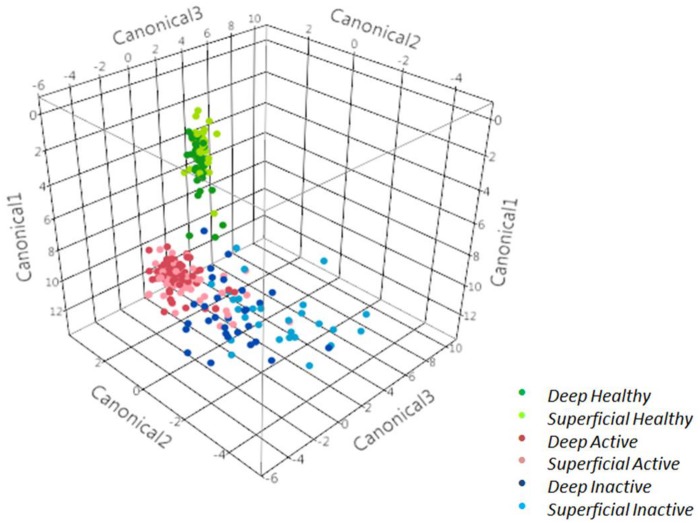
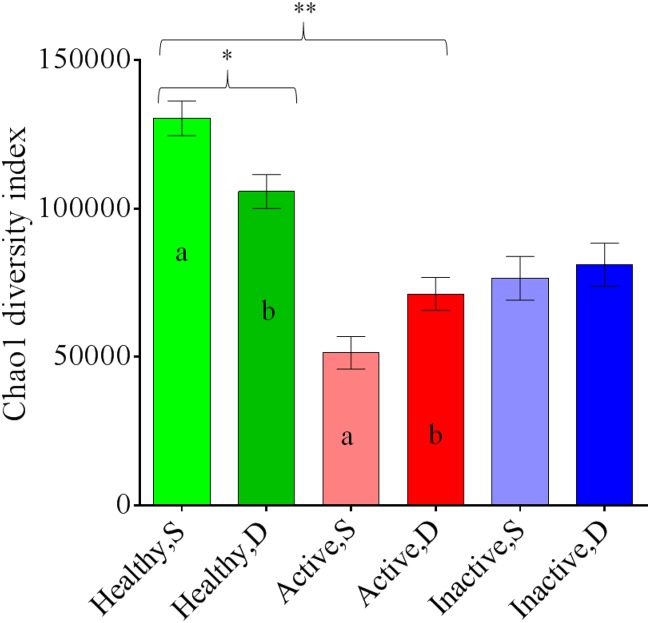
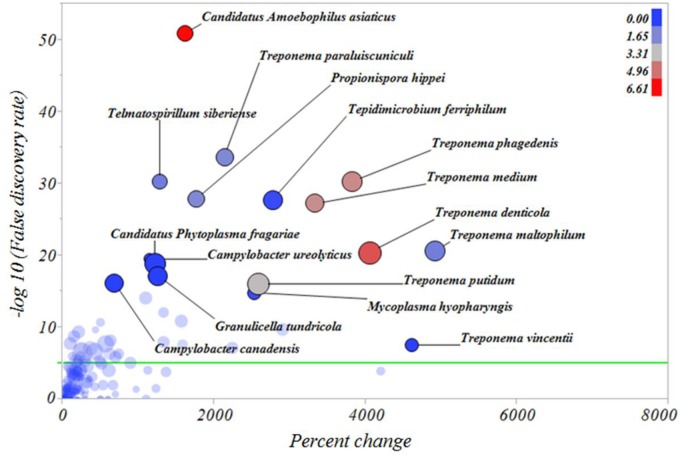
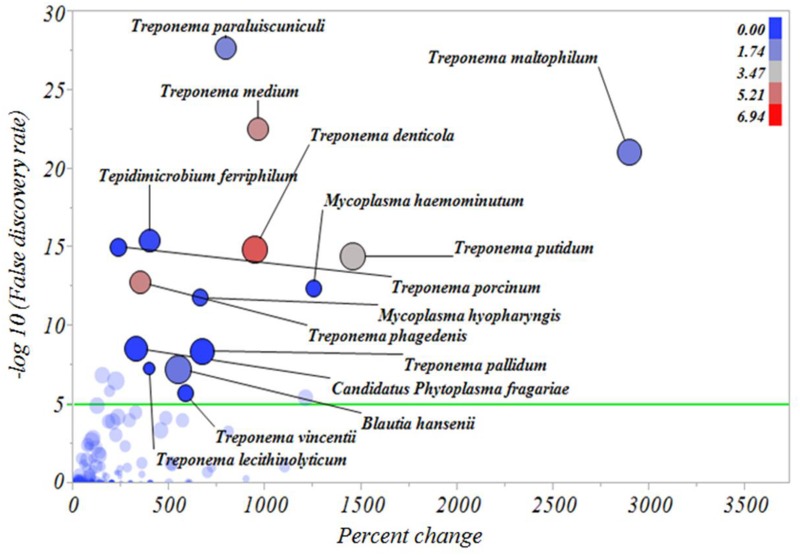
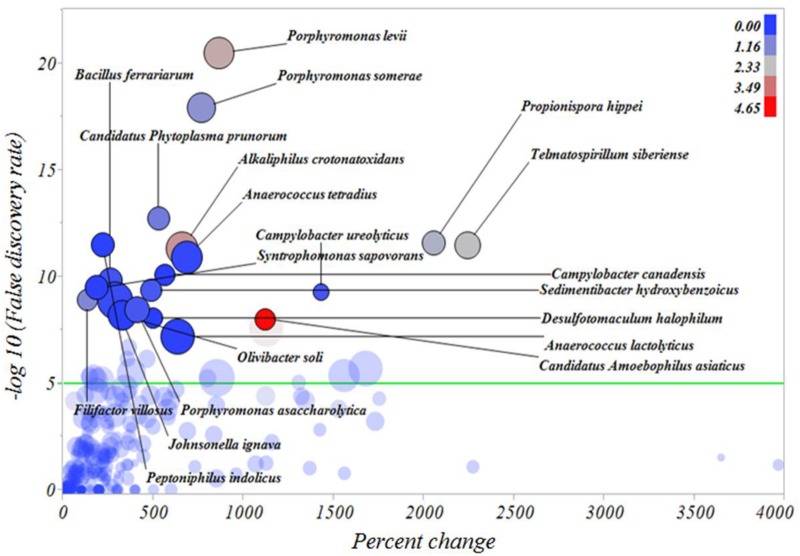
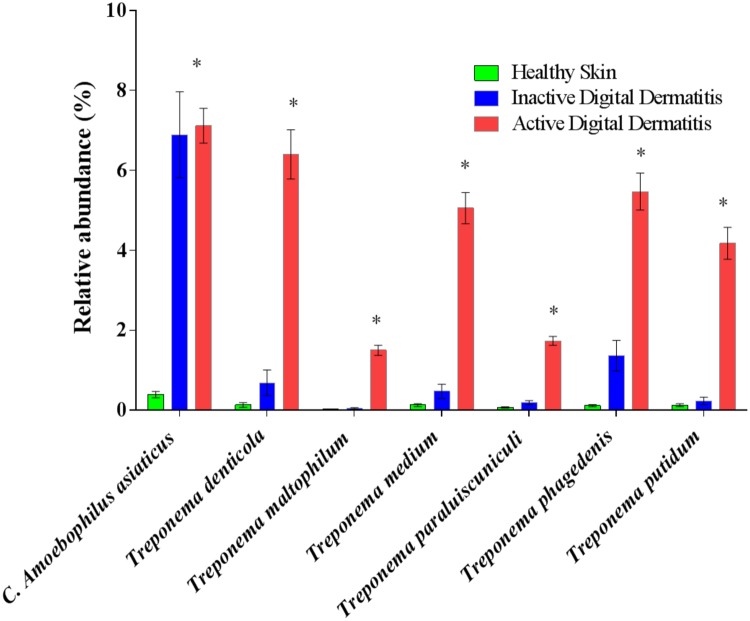
Bovine digital dermatitis (DD) is the most important infectious disease associated with lameness in cattle worldwide. Since the disease was first described in 1974, a series of Treponema species concurrent with other microbes have been identified in DD lesions, suggesting a polymicrobial etiology. However, the pathogenesis of DD and the source of the causative microbes remain unclear. Here we characterized the microbiomes of healthy skin and skin lesions in dairy cows affected with different stages of DD and investigated the gut microbiome as a potential reservoir for microbes associated with this disease. Discriminant analysis revealed that the microbiomes of healthy skin, active DD lesions (ulcerative and chronic ulcerative) and inactive DD lesions (healing and chronic proliferative) are completely distinct. Treponema denticola, Treponema maltophilum, Treponema medium, Treponema putidum, Treponema phagedenis and Treponema paraluiscuniculi were all found to be present in greater relative abundance in active DD lesions when compared with healthy skin and inactive DD lesions, and these same Treponema species were nearly ubiquitously present in rumen and fecal microbiomes. The relative abundance of Candidatus Amoebophilus asiaticus, a bacterium not previously reported in DD lesions, was increased in both active and inactive lesions when compared with healthy skin. In conclusion, our data support the concept that DD is a polymicrobial disease, with active DD lesions having a markedly distinct microbiome dominated by T. denticola, T. maltophilum, T. medium, T. putidum, T. phagedenis and T. paraluiscuniculi. Furthermore, these Treponema species are nearly ubiquitously found in rumen and fecal microbiomes, suggesting that the gut is an important reservoir of microbes involved in DD pathogenesis. Additionally, the bacterium Candidatus Amoebophilus asiaticus was highly abundant in active and inactive DD lesions.


Conflict of interest statement

Competing Interests: The authors have declared that no competing interests exist.

Figures

Fig 1
Fig 1. Digital dermatitis lesion scoring system modified from Döpfer et al. (1997) and Berry et al. (2012) [25],[29].
M1 is an early-stage ulcerative lesion (0–2 cm diameter); M2 is an ulcerative painful lesion with a diameter >2 cm; M3 is the healing stage with a lesion covered by a scab; M4 is the chronic stage characterized by dyskeratosis or surface proliferation; and M4.1 consists of a chronic lesion with a small area of ulceration. The highlight colors on the border of each image cluster the digital dermatitis lesions into two different types: active (red border) and inactive (blue border).
Fig 2
Fig 2. Relative abundance of phyla from superficial (light colors) and deep (dark colors) samples of healthy skin (green), active (red) and inactive (blue) digital dermatitis lesions.
Error bars represent standard error of the mean. The asterisks indicate significant differences between healthy skin and active or inactive digital dermatitis lesions. *P < 0.05.
Fig 3
Fig 3. Average relative abundance of the 20 most common bacteria detected in deep (red bars) and superficial (blue bars) samples of healthy skin (A), inactive digital dermatitis lesions (B) and active digital dermatitis lesions (C).
Error bars represent the standard error of the mean. The asterisk indicates a significant difference between superficial and deep samples. * = P < 0.05
Fig 4
Fig 4. Discriminant analysis of superficial and deep strata samples from healthy skin, inactive digital dermatitis lesions and active digital dermatitis lesions.
Fig 5
Fig 5. Bar graph illustrating the mean Chao1 index for superficial (S) and deep (D) strata samples of healthy skin, active digital dermatitis lesions, and inactive digital dermatitis lesions.
Error bars represent standard errors. One asterisk means a significant difference (*P < 0.01) between healthy skin and lesion types. Two asterisks mean a significant interaction (**P < 0.01) for sample and lesion types. Different letters (a, b) indicate significant differences between different strata within a sample type.
Fig 6
Fig 6. Percentage increase of bacterial types from healthy skin samples to active digital dermatitis lesions.
The Y axis represents the robust LogWorth of the false discovery rate and the X axis represents the percentage increase in relative abundance when comparing healthy skin samples to active digital dermatitis lesions. The sizes of the circles represent the effect size and the colors represent the relative abundance of each individual bacterial type in active digital dermatitis lesions (color legend upper right corner). Green line represents P < 0.00005.
Fig 7
Fig 7. Percentage increase of bacterial types from inactive digital dermatitis lesions to active digital dermatitis lesions.
The Y axis represents the robust LogWorth of the false discovery rate and the X axis represents the percentage increase in relative abundance when comparing inactive digital dermatitis lesions to active digital dermatitis lesions. The sizes of the circles represent the effect size and the colors represent the relative abundance of each individual bacterial type in active digital dermatitis lesions (color legend upper right corner). Green line represents P < 0.00005.
Fig 8
Fig 8. Percentage increase of bacterial types from healthy skin to inactive digital dermatitis lesions.
The Y axis represents the robust LogWorth of the false discovery rate and the X axis represents the percentage increase in relative abundance when comparing healthy skin samples to inactive digital dermatitis lesions. The sizes of the circles represent the effect size and the colors represent the relative abundance of each individual bacterial type in inactive digital dermatitis lesions (color legend upper right corner). Green line represents P < 0.00005.
Fig 9
Fig 9. Relative abundance of the major bacterial species associated with digital dermatitis (DD) in healthy skin, inactive DD lesions and active DD lesions.
Bacterial types were selected based on the top ranked robust LogWorth of the false discovery rate and average relative abundance of bacterial types in healthy skin, inactive DD lesions, and active DD lesions. Asterisks mean significance. *P < 0.05.
Fig 10
Fig 10. Linear correlation matrix illustrating the associations among all Treponema species that were highly associated with digital dermatitis.
Linear correlation line (red line) and respective 95% C.I. (shaded red) as well as correlation coefficients for each association (upper left corner) are provided. A nonparametric density contour was used to illustrate how healthy (red dots), inactive (green dots), and active digital dermatitis (blue dots) samples are concentrated on each graph.
Fig 11
Fig 11. Relative abundance of Treponema species in fecal samples from 14 lactating dairy cows.
Error bars represent standard error of the mean.
Fig 12
Fig 12. Relative abundance of Treponema species in rumen samples from 8 lactating dairy cows.

References

    1. Bruijnis MR, Beerda B, Hogeveen H, Stassen EN. (2012) Assessing the welfare impact of foot disorders in dairy cattle by a modeling approach. Animal 6: 962–970. 10.1017/S1751731111002606 - DOI - PubMed
    1. Garbarino EJ, Hernandez JA, Shearer JK, Risco CA, Thatcher WW. (2004) Effect of lameness on ovarian activity in postpartum holstein cows. J Dairy Sci 87: 4123–4131. - PubMed
    1. Losinger WC. (2006) Economic impacts of reduced milk production associated with papillomatous digital dermatitis in dairy cows in the USA. J Dairy Res 73: 244–256. - PubMed
    1. Ettema J, Ostergaard S, Kristensen AR. (2010) Modelling the economic impact of three lameness causing diseases using herd and cow level evidence. Prev Vet Med 95: 64–73. 10.1016/j.prevetmed.2010.03.001 - DOI - PubMed
    1. Cha E, Hertl JA, Bar D, Grohn YT. (2010) The cost of different types of lameness in dairy cows calculated by dynamic programming. Prev Vet Med 97: 1–8. 10.1016/j.prevetmed.2010.07.011 - DOI - PubMed

Publication types

Associated data

LinkOut - more resources