

Utility of a Noninvasive Serum Biomarker Panel for Diagnosis and Monitoring of Eosinophilic Esophagitis: A Prospective Study
- PMID: 25781367
- PMCID: PMC4578703
- DOI: 10.1038/ajg.2015.57
Utility of a Noninvasive Serum Biomarker Panel for Diagnosis and Monitoring of Eosinophilic Esophagitis: A Prospective Study
Abstract
Objectives: Noninvasive biomarkers would be valuable for diagnosis and monitoring of eosinophilic esophagitis (EoE). The aim of this study was to determine the utility of a panel of serum biomarkers for the diagnosis and management of EoE.
Methods: We conducted a prospective cohort study of consecutive adults undergoing outpatient esophagogastroduodenoscopy. Incident cases of EoE were diagnosed per consensus guidelines; controls had gastroesophageal reflux disease (GERD) or dysphagia and did not meet the EoE criteria. EoE cases were treated with topical steroids and had repeat endoscopy. Pre- and post-treatment serum samples were analyzed in a blinded manner for interleukin (IL)-4, IL-5, IL-6, IL-9, IL-13, transforming growth factor (TGF)-α, TGF-β, tumor necrosis factor-α, eotaxin-1, -2, and -3, thymic stromal lymphopoietin (TSLP), major basic protein, and eosinophil-derived neurotoxin. Cases and controls were compared at baseline, and pre- and post-treatment assays were compared in cases.
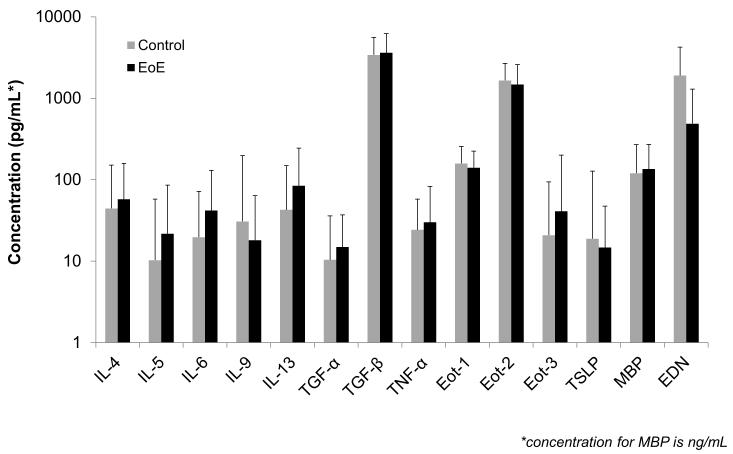
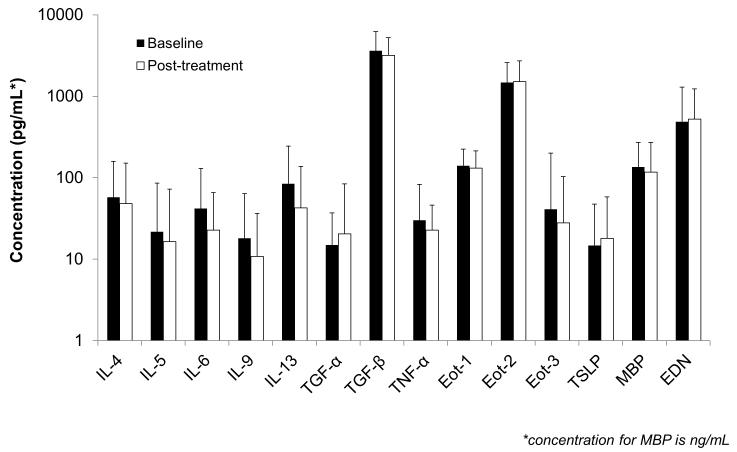
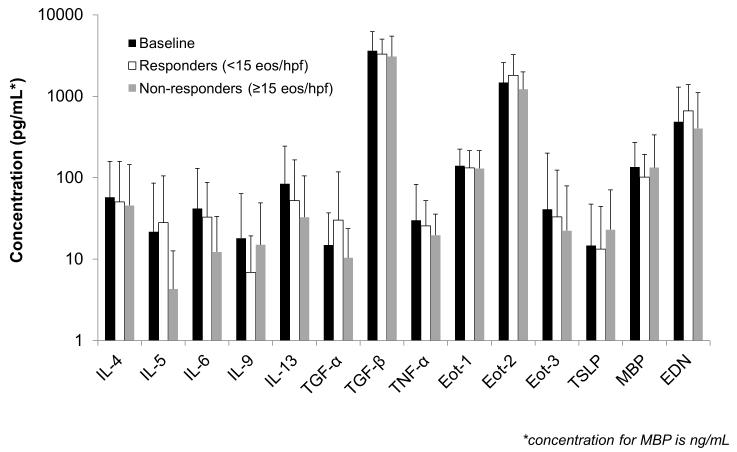
Results: A total of 61 incident EoE cases and 87 controls were enrolled; 51 EoE cases had post-treatment serum analyzed. There were no significant differences in any of the biomarkers between EoE cases and controls at baseline. IL-13 and eotaxin-3 for cases and controls were 85 ± 160 vs. 43 ± 161 pg/ml (P=0.12) and 41 ± 159 vs. 21 ± 73 (P=0.30). There were no significant differences in assay values among cases before and after treatment. There were also no differences after stratification by atopic status or treatment response.
Conclusions: A panel of inflammatory factors known to be associated with EoE pathogenesis were not increased in the serum, nor were they responsive to therapy. None of these biomarkers are likely candidates for a serum test for EoE. Histologic analysis for diagnosis and management of EoE continues to be necessary, and novel, less invasive, biomarkers are needed.
Figures
References
-
- Dellon ES, Gonsalves N, Hirano I, et al. ACG Clinical Guideline: Evidence based approach to the diagnosis and management of esophageal eosinophilia and eosinophilic esophagitis. Am J Gastroenterol. 2013;108:679–92. - PubMed
-
- Liacouras CA, Furuta GT, Hirano I, et al. Eosinophilic esophagitis: Updated consensus recommendations for children and adults. J Allergy Clin Immunol. 2011;128:3–20.e6. - PubMed
-
- Furuta GT, Liacouras CA, Collins MH, et al. Eosinophilic esophagitis in children and adults: a systematic review and consensus recommendations for diagnosis and treatment. Gastroenterology. 2007;133:1342–63. - PubMed
Publication types
MeSH terms
Substances
Grants and funding
LinkOut - more resources
Full Text Sources
Other Literature Sources
Medical
