

Multimodal Segmentation of Optic Disc and Cup From SD-OCT and Color Fundus Photographs Using a Machine-Learning Graph-Based Approach
- PMID: 25781623
- PMCID: PMC4560662
- DOI: 10.1109/TMI.2015.2412881
Multimodal Segmentation of Optic Disc and Cup From SD-OCT and Color Fundus Photographs Using a Machine-Learning Graph-Based Approach
Abstract
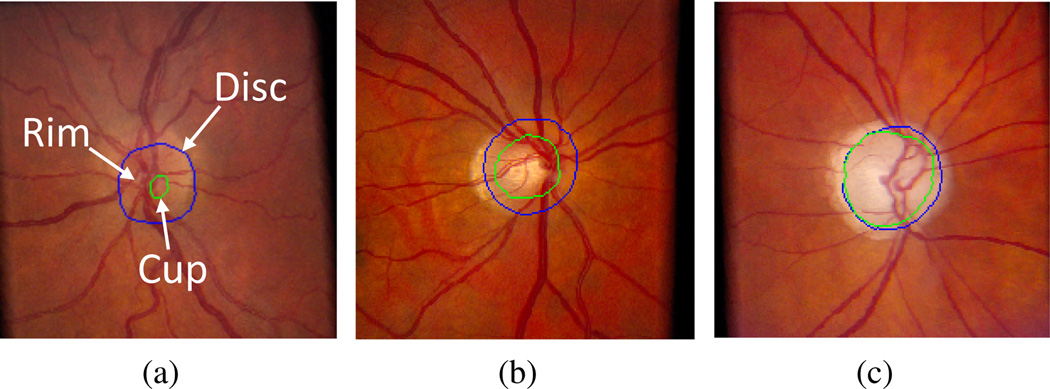
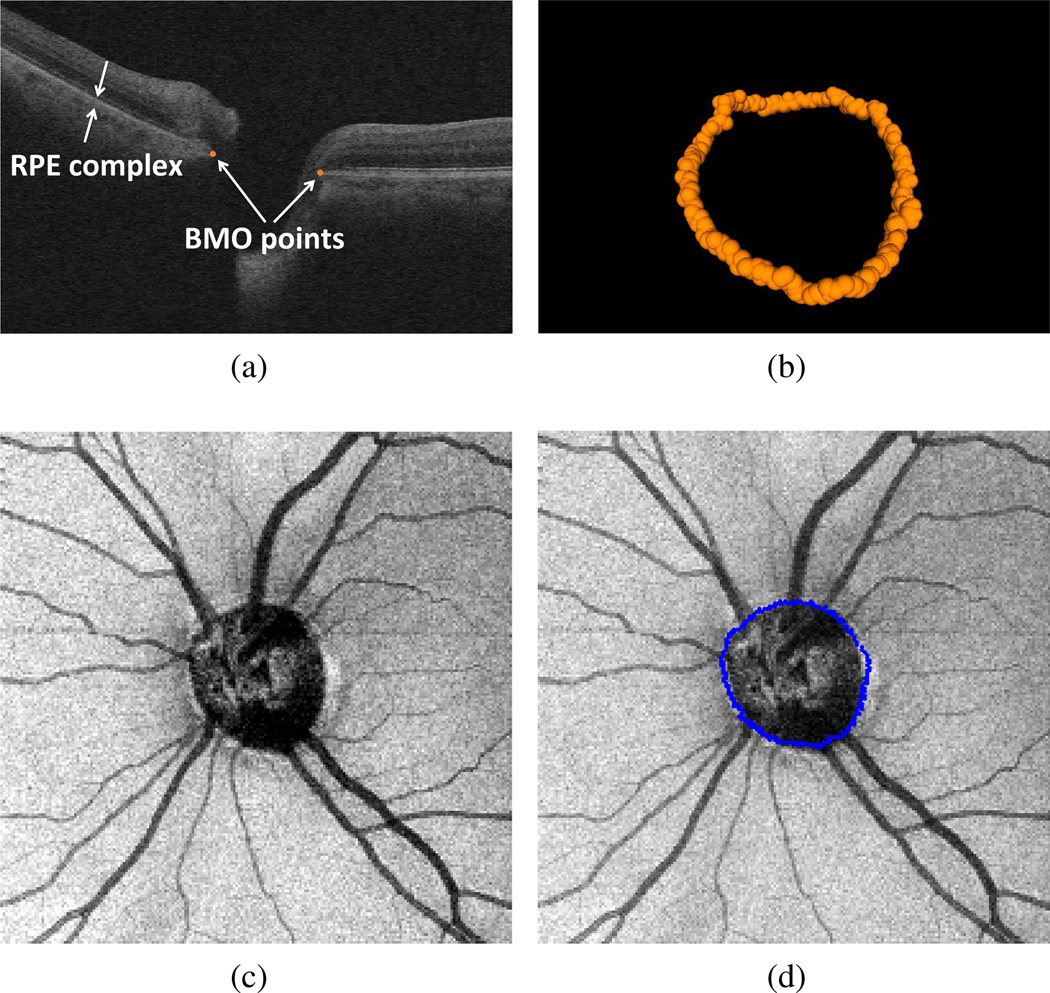
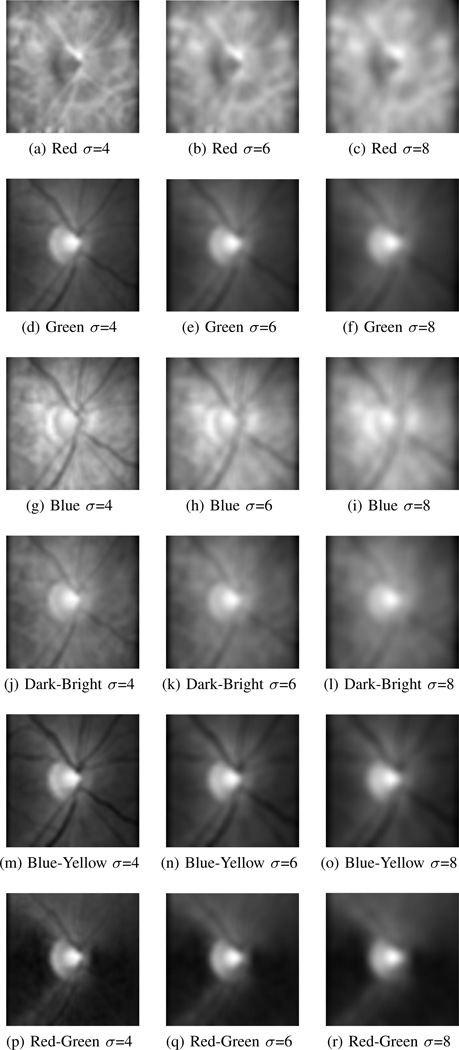
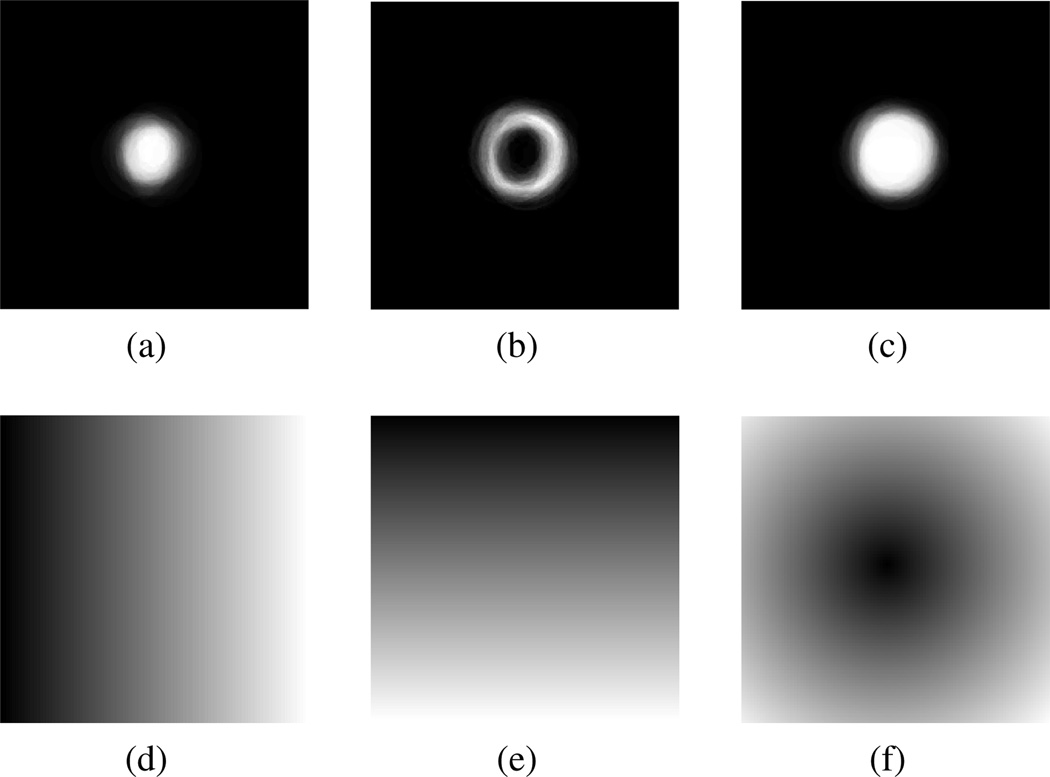
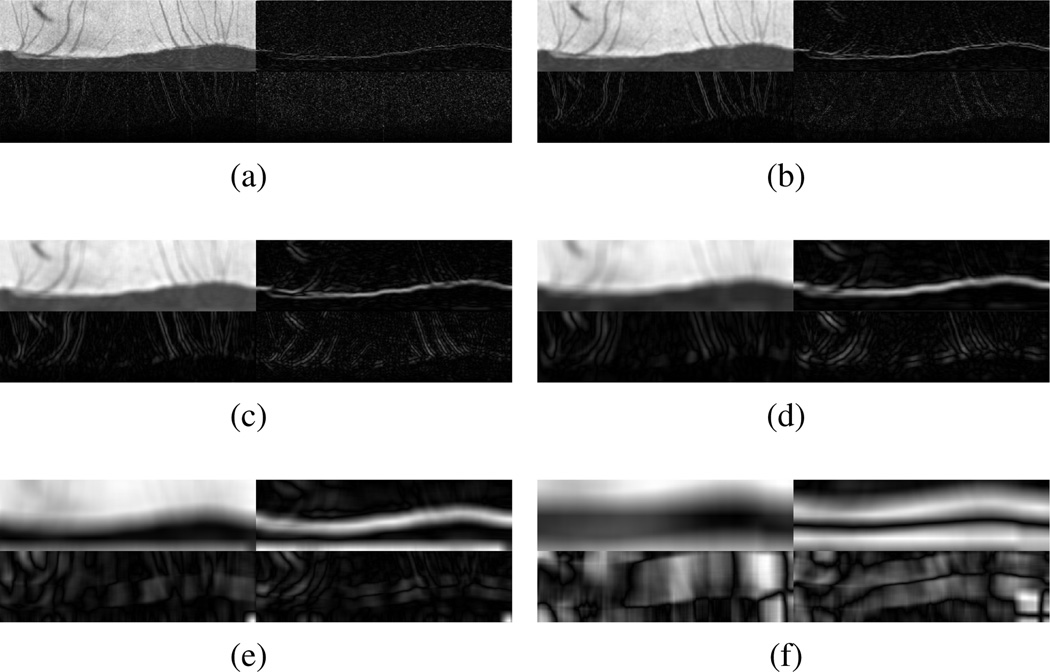
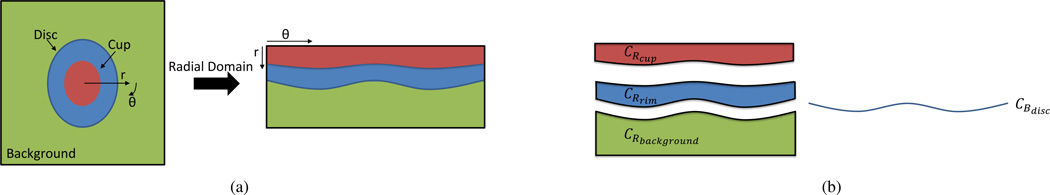
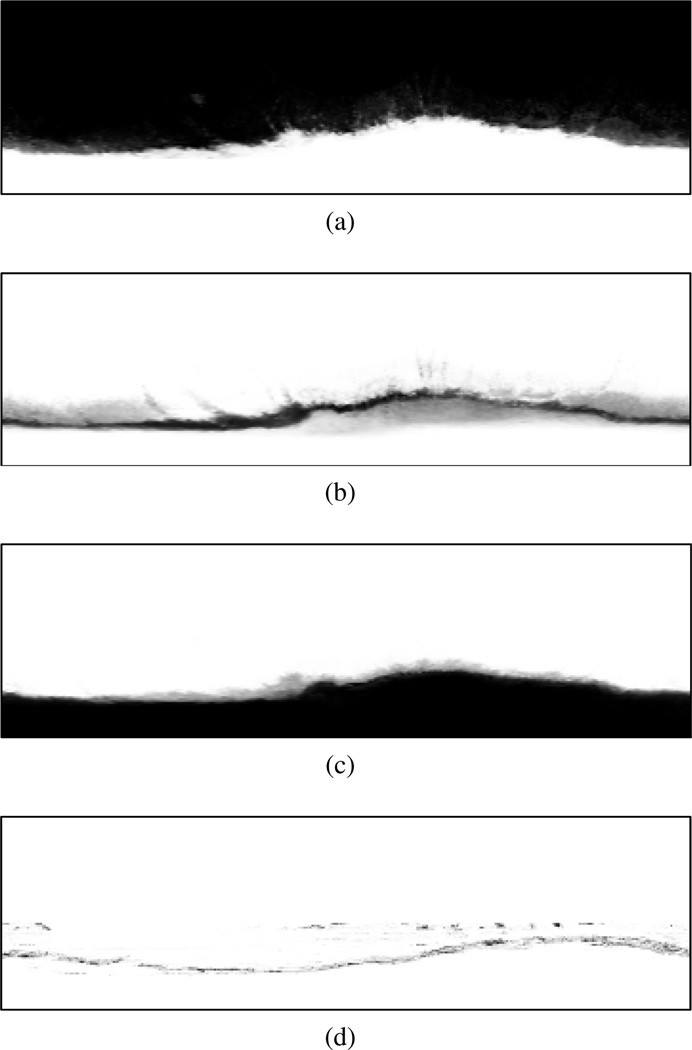
In this work, a multimodal approach is proposed to use the complementary information from fundus photographs and spectral domain optical coherence tomography (SD-OCT) volumes in order to segment the optic disc and cup boundaries. The problem is formulated as an optimization problem where the optimal solution is obtained using a machine-learning theoretical graph-based method. In particular, first the fundus photograph is registered to the 2D projection of the SD-OCT volume. Three in-region cost functions are designed using a random forest classifier corresponding to three regions of cup, rim, and background. Next, the volumes are resampled to create radial scans in which the Bruch's Membrane Opening (BMO) endpoints are easier to detect. Similar to in-region cost function design, the disc-boundary cost function is designed using a random forest classifier for which the features are created by applying the Haar Stationary Wavelet Transform (SWT) to the radial projection image. A multisurface graph-based approach utilizes the in-region and disc-boundary cost images to segment the boundaries of optic disc and cup under feasibility constraints. The approach is evaluated on 25 multimodal image pairs from 25 subjects in a leave-one-out fashion (by subject). The performances of the graph-theoretic approach using three sets of cost functions are compared: 1) using unimodal (OCT only) in-region costs, 2) using multimodal in-region costs, and 3) using multimodal in-region and disc-boundary costs. Results show that the multimodal approaches outperform the unimodal approach in segmenting the optic disc and cup.
Figures


Similar articles
-
A machine-learning graph-based approach for 3D segmentation of Bruch's membrane opening from glaucomatous SD-OCT volumes.Med Image Anal. 2017 Jul;39:206-217. doi: 10.1016/j.media.2017.04.007. Epub 2017 May 6. Med Image Anal. 2017. PMID: 28528295 Free PMC article.
-
Incorporation of gradient vector flow field in a multimodal graph-theoretic approach for segmenting the internal limiting membrane from glaucomatous optic nerve head-centered SD-OCT volumes.Comput Med Imaging Graph. 2017 Jan;55:87-94. doi: 10.1016/j.compmedimag.2016.06.007. Epub 2016 Jul 25. Comput Med Imaging Graph. 2017. PMID: 27507325 Free PMC article.
-
Multimodal retinal vessel segmentation from spectral-domain optical coherence tomography and fundus photography.IEEE Trans Med Imaging. 2012 Oct;31(10):1900-11. doi: 10.1109/TMI.2012.2206822. Epub 2012 Jun 29. IEEE Trans Med Imaging. 2012. PMID: 22759443 Free PMC article.
-
Congenital Optic Disc Anomalies: Insights from Multimodal Imaging.J Clin Med. 2024 Mar 6;13(5):1509. doi: 10.3390/jcm13051509. J Clin Med. 2024. PMID: 38592429 Free PMC article. Review.
-
Wide-Field Ex Vivo Dual Imaging Microscopy.Cornea. 2018 Jun;37 Suppl 1:S11-S13. doi: 10.1097/ICO.0000000000001644. Cornea. 2018. PMID: 29734205 Review. No abstract available.
Cited by
-
Region-segmentation strategy for Bruch's membrane opening detection in spectral domain optical coherence tomography images.Biomed Opt Express. 2019 Jan 14;10(2):526-538. doi: 10.1364/BOE.10.000526. eCollection 2019 Feb 1. Biomed Opt Express. 2019. PMID: 30800497 Free PMC article.
-
Joint optic disk and cup segmentation for glaucoma screening using a region-based deep learning network.Eye (Lond). 2023 Apr;37(6):1080-1087. doi: 10.1038/s41433-022-02055-w. Epub 2022 Apr 18. Eye (Lond). 2023. PMID: 35437003 Free PMC article.
-
Active contour method for ILM segmentation in ONH volume scans in retinal OCT.Biomed Opt Express. 2018 Nov 28;9(12):6497-6518. doi: 10.1364/BOE.9.006497. eCollection 2018 Dec 1. Biomed Opt Express. 2018. PMID: 31065445 Free PMC article.
-
Registration of fluorescein angiography and optical coherence tomography images of curved retina via scanning laser ophthalmoscopy photographs.Biomed Opt Express. 2020 Jun 2;11(7):3455-3476. doi: 10.1364/BOE.395784. eCollection 2020 Jul 1. Biomed Opt Express. 2020. PMID: 33014544 Free PMC article.
-
Automated segmentation of peripapillary retinal boundaries in OCT combining a convolutional neural network and a multi-weights graph search.Biomed Opt Express. 2019 Aug 1;10(8):4340-4352. doi: 10.1364/BOE.10.004340. eCollection 2019 Aug 1. Biomed Opt Express. 2019. PMID: 31453015 Free PMC article.
References
-
- Cheng J, Liu J, Xu Y, Yin F, Wong DWK, Tan N-M, Tao D, Cheng C-Y, Aung T, Wong TY. Superpixel classification based optic disc and optic cup segmentation for glaucoma screening. IEEE Trans. Med. Imag. 2013 Jun;32(6):1019–1032. - PubMed
-
- Xu J, Chutatape O, Sung E, Zheng C, Kuan PCT. Optic disk feature extraction via modified deformable model technique for glaucoma analysis. Patt. Rec. 2007 Jul;40(7):2063–2076.
-
- Yin F, Liu J, Ong SH, Sun Y, Wong DWK, Tan NM, Cheung C, Baskaran M, Aung T, Wong TY. Model-based optic nerve head segmentation on retinal fundus images; 33rd Ann. Int. Conf. IEEE EMBS; Aug. 2011; Boston, Massachusetts USA. pp. 2626–2629. - PubMed
