. 2015 Mar 17;10(3):e0118464.
doi: 10.1371/journal.pone.0118464. eCollection 2015.

Adaptive resistance in bacteria requires epigenetic inheritance, genetic noise, and cost of efflux pumps

Affiliations

Adaptive resistance in bacteria requires epigenetic inheritance, genetic noise, and cost of efflux pumps

Santiago Sandoval Motta et al. PLoS One. .

Abstract

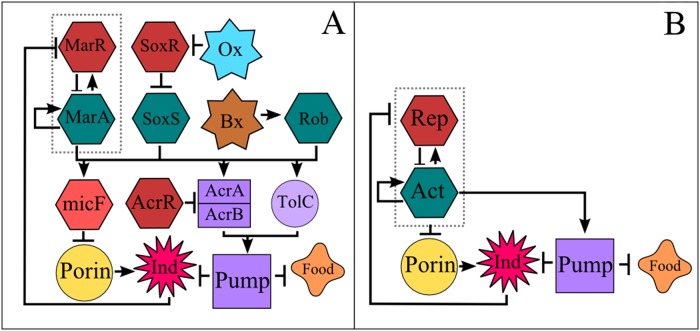
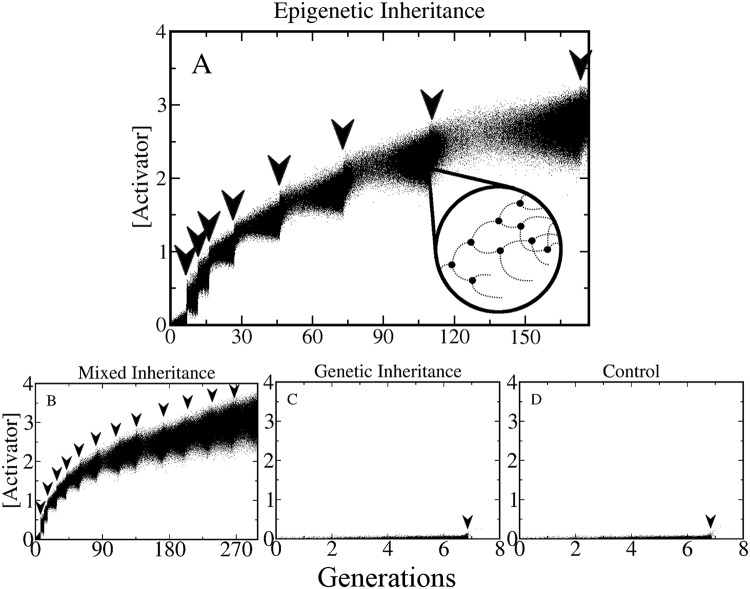
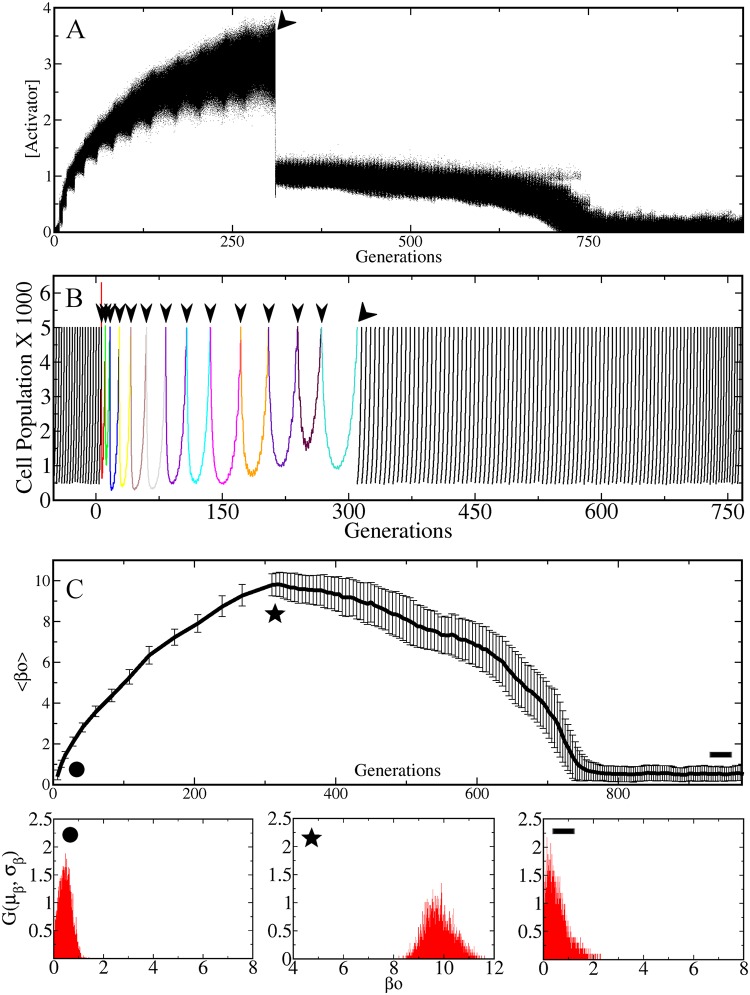
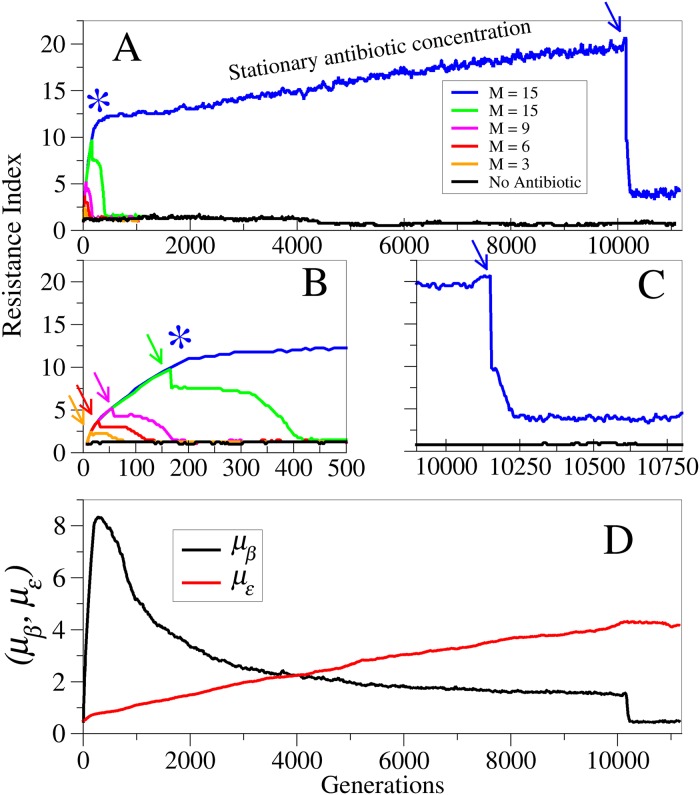
Adaptive resistance emerges when populations of bacteria are subjected to gradual increases of antibiotics. It is characterized by a rapid emergence of resistance and fast reversibility to the non-resistant phenotype when the antibiotic is removed from the medium. Recent work shows that adaptive resistance requires epigenetic inheritance and heterogeneity of gene expression patterns that are, in particular, associated with the production of porins and efflux pumps. However, the precise mechanisms by which inheritance and variability govern adaptive resistance, and what processes cause its reversibility remain unclear. Here, using an efflux pump regulatory network (EPRN) model, we show that the following three mechanisms are essential to obtain adaptive resistance in a bacterial population: 1) intrinsic variability in the expression of the EPRN transcription factors; 2) epigenetic inheritance of the transcription rate of EPRN associated genes; and 3) energetic cost of the efflux pumps activity that slows down cell growth. While the first two mechanisms acting together are responsible for the emergence and gradual increase of the resistance, the third one accounts for its reversibility. In contrast with the standard assumption, our model predicts that adaptive resistance cannot be explained by increased mutation rates. Our results identify the molecular mechanism of epigenetic inheritance as the main target for therapeutic treatments against the emergence of adaptive resistance. Finally, our theoretical framework unifies known and newly identified determinants such as the burden of efflux pumps that underlie bacterial adaptive resistance to antibiotics.


Conflict of interest statement

Competing Interests: The authors have declared that no competing interests exist.

Figures

Fig 1
Fig 1. Efflux Pump Regulatory Network.
Arrows indicate positive regulation. Blunt arrows indicate repression. A) Literature base reconstruction of the AcrAB-TolC efflux pump regulatory network of Escherichia coli as reported on [9]. B) Simplified version of the AcrAB-TolC efflux pump regulatory network (EPRN). The activator (Act) and repressor (Rep) are two Transcriptional Factors that belong to the same transcriptional unit (EPRN operon, indicated by the dashed line). When the repressor occupies its DNA binding site, the expression of the operon is restrained. Nonetheless, when the antibiotic (or inducer, Ind) enters the cell, it inactivates the repressor by binding to it, allowing the operon to be actively transcribed, promoting the production of pumps and decreasing the synthesis of porins (this last process is known to occur through an intermediary). Both food and inducer are expelled by the efflux pump system. In the population model, a reduction in food concentration implies an increase in the division time.
Fig 2
Fig 2. Emergence of the high resistance phenotype.
This figure shows tracking plots of populations growing in successively increasing concentrations of antibiotic. For each cell the concentration of Activator is plotted at constant time intervals (dots). The arrows indicate the times at which antibiotic shocks were applied, which happened every time the population reached a maximum size of N = 5000. The four panels correspond to the four different inheritance scenarios mentioned in the main text. (A) Only epigenetic inheritance is implemented. (B) Mixed Inheritance. (C) Only genetic inheritance and (D) control (no inheritance). The inset in (A) shows a zoomed in representation of the tracking plot, where one cell lineage is followed as it goes through several cell divisions and deaths. Since dead cells are removed immediately from the population, their expression is no longer visible and their curves terminate abruptly (causing a step-like structure). Note that high levels of resistance can be achieved only when there is epigenetic inheritance (A and B). Otherwise, the entire population dies after the first shock (C and D). The unit of time corresponds to one cell cycle for β0 = 1 and with no antibiotic (see S6 Fig.).
Fig 3
Fig 3. Reversibility of the resistance phenotype.
(A) This tracking plot shows that the expression of the activator increases while the antibiotic shocks are applied as in Fig. 2. Then, when the antibiotic is removed (indicated by the tilted black arrow), the expression of the activator decreases abruptly and eventually reaches its basal level. (B) Size of the population as a function of time for the same simulation as in A. After each antibiotic shock (small black arrows) the population size decreases exponentially and the recovery time becomes longer with each shock. After the antibiotic is removed (tilted black arrow) the population comes back again to its wild-type (WT) growth rate. To carry out the simulations in the antibiotic-free phase, every time the population reached the maximum size N = 5000, we took a random sample of 10% of the cells and made them grow without antibiotic, until the population reached again this maximum size, and so on. (C) Average transcription rate μβ = ⟨β0⟩ in the population as a function of time. Note that the average increases while the shocks are applied and then gradually comes back to small values when the antibiotic is removed. Error bars indicate the standard deviation. It can be observed that the standard deviation increases with the antibiotic stress. The panels below show the full distribution G (μβ, σβ) at three different times: before any antibiotic is introduced (circle); after several antibiotic shocks (star); after a long period of time without antibiotic (line). Time is measured generations, being one generation the time it takes for a cell with β0 = 1 to reach θF starting from F = 0.
Fig 4
Fig 4. Genetic Assimilation occurs at longer time scales.
(A) Resistance Index (RI) as a function of time for populations induced with M antibiotic shocks. The different curves correspond to different values of M, except by the black one which corresponds to a control population growing with no antibiotic. (B) Blow up showing the first 500 generations. For each curve, the corresponding arrow indicates the time at which the antibiotic is removed. In the case of the blue curve, the asterisk indicates the time at which the last antibiotic shock is applied, after which the antibiotic concentration is kept constant. (C) Blow up of the last part of the simulation showing the point at which the antibiotic is removed from the population corresponding to the blue curve. It can be observed that in this case the final stationary value of the RI is about five times higher than that of the control population. (D) Evolution of the average transcription rate μβ and the average pump efficiency με for the population corresponding to the blue curve. Notice that as soon as the antibiotic concentration is kept constant, μβ starts decreasing whereas με keeps rising until the antibiotic is completely removed. This shows that the evolutionary process does not reach a stationary state (or fixed point) in the presence of antibiotic.

References

    1. Adam M, Murali B, Glenn NO, Potter SS. Epigenetic inheritance based evolution of antibiotic resistance in bacteria. BMC Evol Biol. 2008. Nov. - PMC - PubMed
    1. Cohen SP, McMurry LM, Hooper DC, Wolfson JS, Levy SB. Cross-resistance to fluoroquinolones in multiple-antibiotic-resistant (Mar) Escherichia coli selected by tetracycline or chloramphenicol: decreased drug accumulation associated with membrane changes in addition to OmpF reduction Antimicrob Agents Chemother 1989. May. - PMC - PubMed
    1. George AM, Levy SB. Amplifiable resistance to tetracycline, chloramphenicol, and other antibiotics in Escherichia coli: involvement of a non-plasmid-determined efflux of tetracycline. J Bacteriol 1983, August Vol. 155 No. 2 p. 531–540 - PMC - PubMed
    1. Braoudaki M, Hilton AC. Adaptive resistance to biocides in Salmonella enterica and Escherichia coli O157 and cross-resistance to antimicrobial agents. J Clin Microbiol 2004. Jan. - PMC - PubMed
    1. Mazzariol A, Tokue Y, Kanegawa TM, Cornaglia G, Nikaido H. High-Level Fluoroquinolone-Resistant Clinical Isolates of Escherichia coli Overproduce Multidrug Efflux Protein AcrA. Antimicrob. Agents Chemother. 2000. Dic. - PMC - PubMed

Publication types

MeSH terms

Substances

LinkOut - more resources