. 2015 Mar 17;11(3):e1005012.
doi: 10.1371/journal.pgen.1005012. eCollection 2015 Mar.

Gene networks underlying convergent and pleiotropic phenotypes in a large and systematically-phenotyped cohort with heterogeneous developmental disorders

Affiliations

Gene networks underlying convergent and pleiotropic phenotypes in a large and systematically-phenotyped cohort with heterogeneous developmental disorders

Tallulah Andrews et al. PLoS Genet. .

Abstract

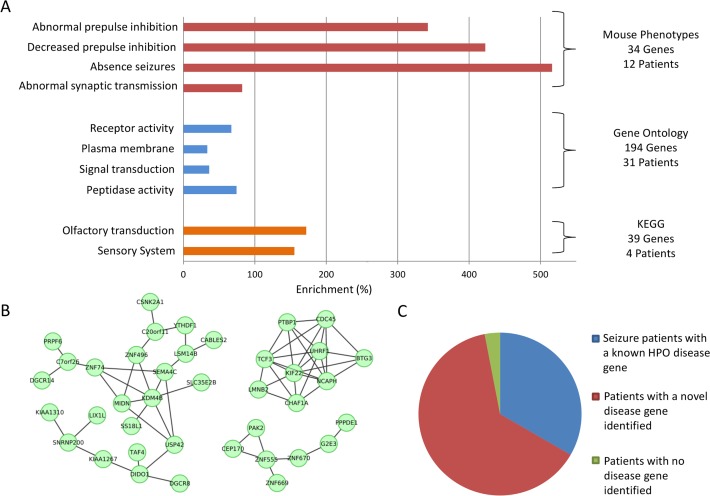
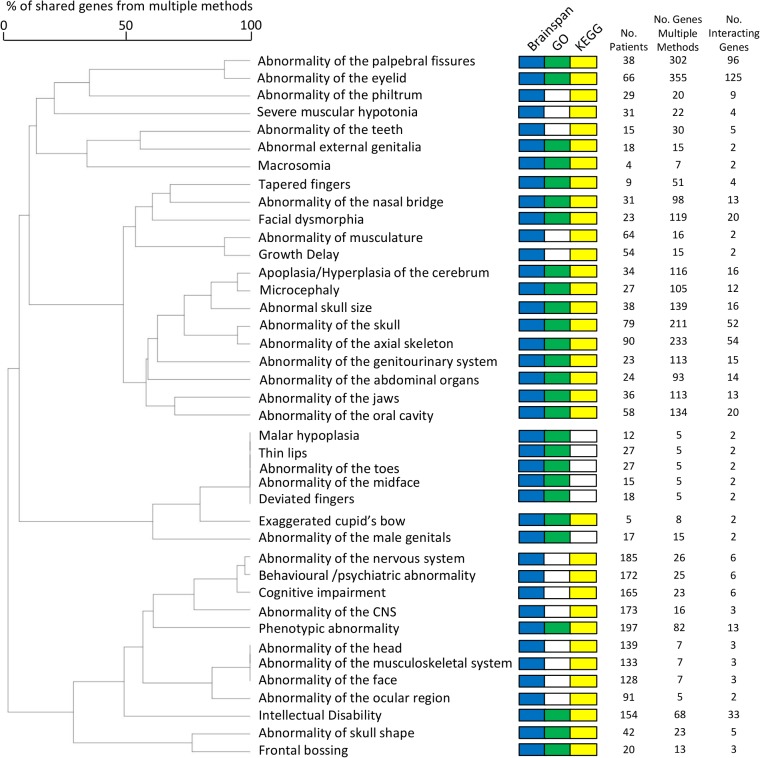
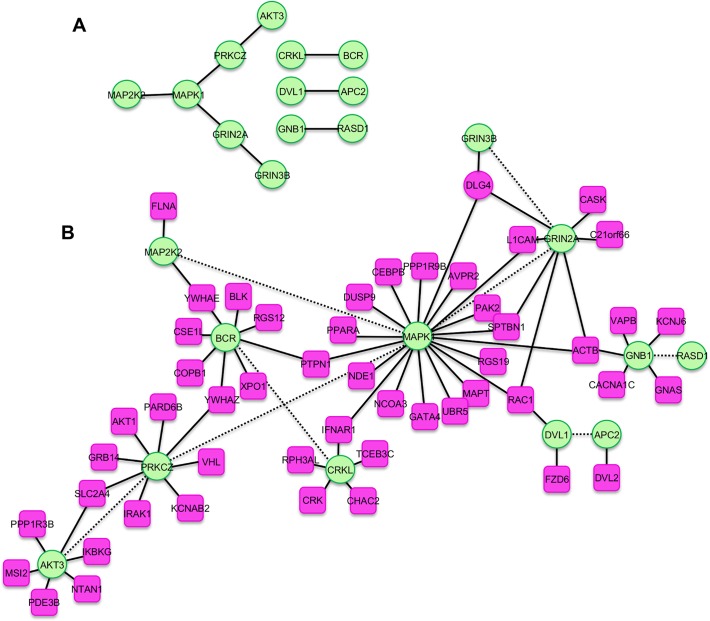
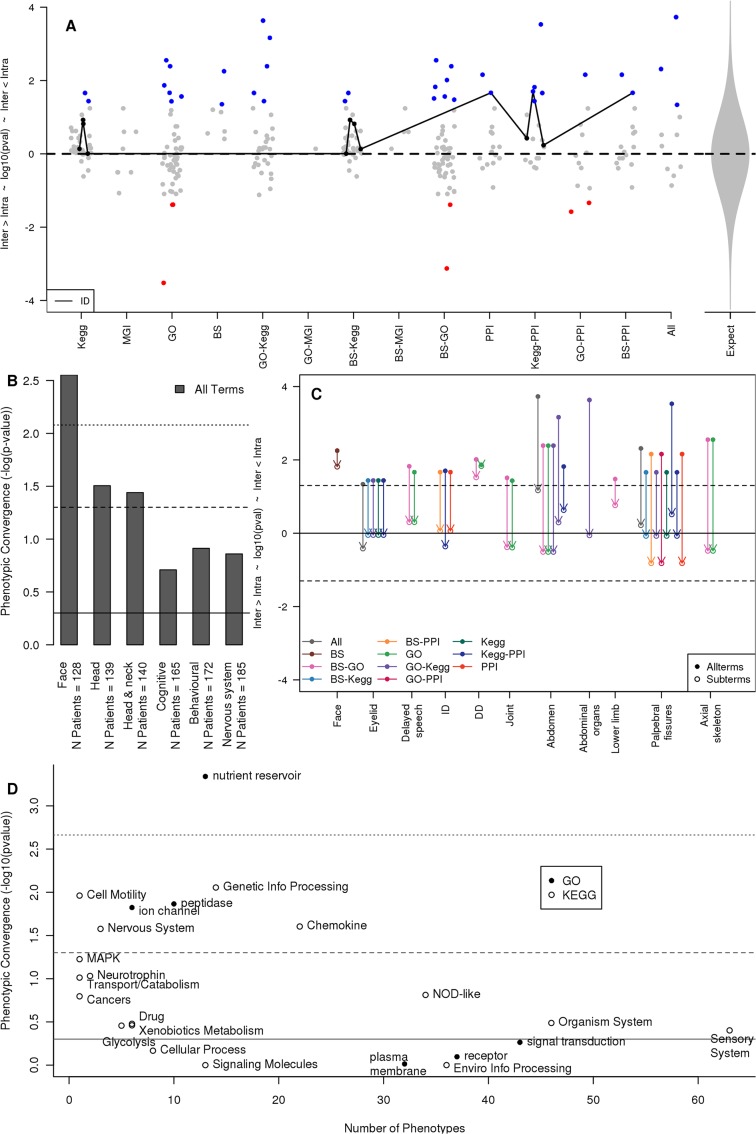
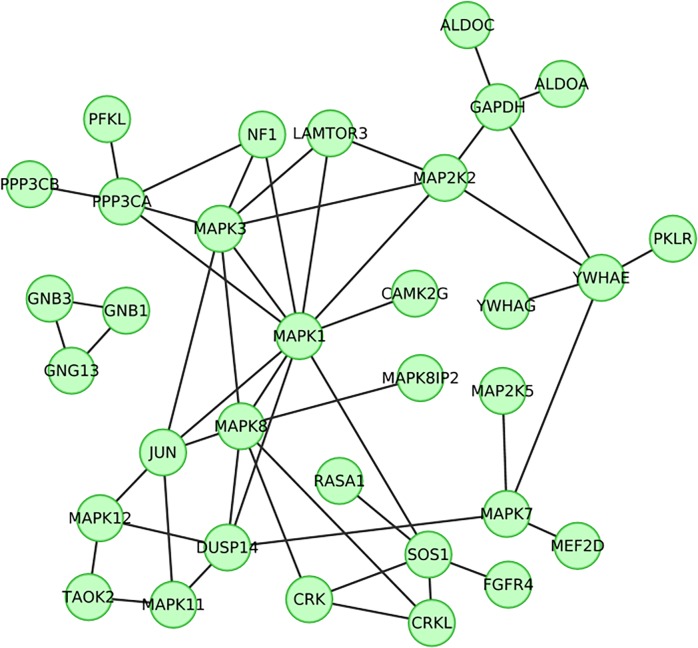
Readily-accessible and standardised capture of genotypic variation has revolutionised our understanding of the genetic contribution to disease. Unfortunately, the corresponding systematic capture of patient phenotypic variation needed to fully interpret the impact of genetic variation has lagged far behind. Exploiting deep and systematic phenotyping of a cohort of 197 patients presenting with heterogeneous developmental disorders and whose genomes harbour de novo CNVs, we systematically applied a range of commonly-used functional genomics approaches to identify the underlying molecular perturbations and their phenotypic impact. Grouping patients into 408 non-exclusive patient-phenotype groups, we identified a functional association amongst the genes disrupted in 209 (51%) groups. We find evidence for a significant number of molecular interactions amongst the association-contributing genes, including a single highly-interconnected network disrupted in 20% of patients with intellectual disability, and show using microcephaly how these molecular networks can be used as baits to identify additional members whose genes are variant in other patients with the same phenotype. Exploiting the systematic phenotyping of this cohort, we observe phenotypic concordance amongst patients whose variant genes contribute to the same functional association but note that (i) this relationship shows significant variation across the different approaches used to infer a commonly perturbed molecular pathway, and (ii) that the phenotypic similarities detected amongst patients who share the same inferred pathway perturbation result from these patients sharing many distinct phenotypes, rather than sharing a more specific phenotype, inferring that these pathways are best characterized by their pleiotropic effects.


Conflict of interest statement

The authors have declared that no competing interests exist.

Figures

Fig 1
Fig 1. Functional genomics enrichments significantly enriched in genes affected by de novo CNVs in 33 patients presenting with seizures.
(A) Significant functional genomics enrichments. Many of these functions have links to seizures or associated phenomena (synaptic deficits, receptor signaling, gustatory aura[73]) but also to regions prone to copy number variation[74]. (B) Genes disrupted by short CNVs in patients were also observed to cluster significantly in a brain-specific gene co-expression network. Here we display the strongest clusters (r > 0.92 for all co-expression similarities) of genes from seizure patients from this network. (C) Overall, the functional enrichments identified known (HPO-defined) seizure genes for 11 of the 33 patients, and proposed causal genes for 21 of the remaining 22 patients.
Fig 2
Fig 2. Forty non-exclusive patient groups, each group’s patients sharing the same HPO term, amongst whom individual copy number variant candidate genes were each recurrently identified by multiple functional genomics methods and whose recurrently-identified candidate genes demonstrated a significant number of protein-protein interactions.
The dendrogram displays the relationship between categories based upon the number of candidate genes identified by multiple methods that are shared between the phenotype-group patients. Categories are marked if there were significant enrichments using clustering in a gene expression network (Blue), GO (Green) or KEGG (yellow). No phenotype-grouped patients with candidate genes meeting these criteria were identified use mouse KO phenotype (MGI) associations.
Fig 3
Fig 3. Molecular pathways serially identified among patients with microcephaly phenotypes in two large cohorts.
(A) 12 copy variant genes drawn from 14 of 27 Nijmegen patients with Microcephaly that were identified using multiple functional genomics methods (KEGG, Gene Expression and GO) and cluster strongly (p = 0.04) in the Dapple protein-protein interaction network. (B) Genes (n = 51; Red)) that were copy number variant in 30 of 71 Decipher patients with Microcephaly were found to possess a significant number of interactions with the genes from panel A (Green) (p = 0.04), forming an extensive and intertwined microcephaly-associated molecular network.
Fig 4
Fig 4. Phenotypic concordances amongst patients whose copy number variant genes contribute to the same functional associations and molecular pathways.
(A) Overall, patients with genes that contribute to the same functional association are phenotypically similar (p = 1 x 10⁻⁴). The Y-axis gives the significance of the overall phenotypic similarity amongst patients within a patient-phenotype group whose variant genes contribute to a functional association (Intra) as compared to those patients in the same phenotype group who do not contribute (Inter), with higher values indicating increasing relative similarity amongst association-contributing patients. Each point represents a single significant patient-phenotype group association, while the methods used to identify the association are shown on the X-axis (KEGG, MGI mouse KO phenotypes, GO, BS BrainSpan gene co-expression). Combinations of methods (e.g. GO-KEGG) illustrate the relative phenotypic similarity amongst patients possessing copy variant genes that individually contribute to multiple functional associations (see Results). “PPI” values are those among patients contributing the interacting molecular networks identified in Fig. 2 (see Results). Dots coloured blue or red indicate nominally significantly phenotypic similarity or dissimilarity, respectively. The black line connects all enrichments associated with the intellectual disability (ID) patient-phenotype group. (B) BrainSpan (BS) was the only pathway-resource to consistently identify phenotypically similar subgroups through a shared molecular association. Detail on the phenotypic similarities shown in Panel A. Solid line: p = 0.5, dashed line: p = 0.05, dotted line: p = 0.007 conferring significance after a Bonferroni correction. (C) The significant phenotypic similarities amongst patients who contribute to the same functional association are not derived from these patients presenting more specific subphenotypes of the original phenotype. Y-axis as in panel A. For all nominally significant enrichments in panel A (top, solid points) we recalculated the patient phenotypic similarities considering only child terms of the original HPO phenotype (open points connected to their respective solid point by an arrow). Points are grouped horizontally by HPO and coloured by enrichment-type. Solid line: p = 0.5, dashed line: p = 0.05. (D) In general, the fewer patient-phenotype groups that a functional enrichment term was associated with, the more phenotypically similar the patients associated with that functional term were. Patient-phenotype groups associated with the same KEGG pathway or GO term were combined and for each association the phenotypic similarity amongst those patients whose variant genes contributed to the given association was compared to those who did not contribute. Y-axis as in panel A. The number of patient-phenotype groups each functional association is associated with is given on the X-axis.
Fig 5
Fig 5. Clusters of 33 genes whose products have known protein-protein interactions copy changed among 34 (22%) of 154 patients with intellectual disability.
These genes were those identified using two or more methods (from KEGG, GO and Gene Expression clustering) and that were found to contribute to a significant enrichment of interactions identified by the Dapple protein-protein interaction network (p < 1x10⁻⁴).

References

    1. Dolk H, Loane M, Garne E (2010) The prevalence of congenital anomalies in Europe. Adv Exp Med Biol 686: 349–364. 10.1007/978-90-481-9485-8_20 - DOI - PubMed
    1. Schaaf CP, Wiszniewska J, Beaudet AL (2011) Copy number and SNP arrays in clinical diagnostics. Annu Rev Genomics Hum Genet 12: 25–51. 10.1146/annurev-genom-092010-110715 - DOI - PubMed
    1. van Zelst-Stams WA, Scheffer H, Veltman JA (2014) Clinical exome sequencing in daily practice: 1,000 patients and beyond. Genome Med 6: 2 10.1186/gm521 - DOI - PMC - PubMed
    1. de Ligt J, Willemsen MH, van Bon BW, Kleefstra T, Yntema HG, et al. (2012) Diagnostic exome sequencing in persons with severe intellectual disability. N Engl J Med 367: 1921–1929. 10.1056/NEJMoa1206524 - DOI - PubMed
    1. Robinson PN (2012) Deep phenotyping for precision medicine. Hum Mutat 33: 777–780. 10.1002/humu.22080 - DOI - PubMed

Publication types