Comparative Study
. 2015 Mar 17;10(3):e0117692.
doi: 10.1371/journal.pone.0117692. eCollection 2015.

Head-to-head comparison of two popular cortical thickness extraction algorithms: a cross-sectional and longitudinal study

Affiliations
Comparative Study

Head-to-head comparison of two popular cortical thickness extraction algorithms: a cross-sectional and longitudinal study

Alberto Redolfi et al. PLoS One. .

Abstract

Background and purpose: The measurement of cortical shrinkage is a candidate marker of disease progression in Alzheimer's. This study evaluated the performance of two pipelines: Civet-CLASP (v1.1.9) and Freesurfer (v5.3.0).

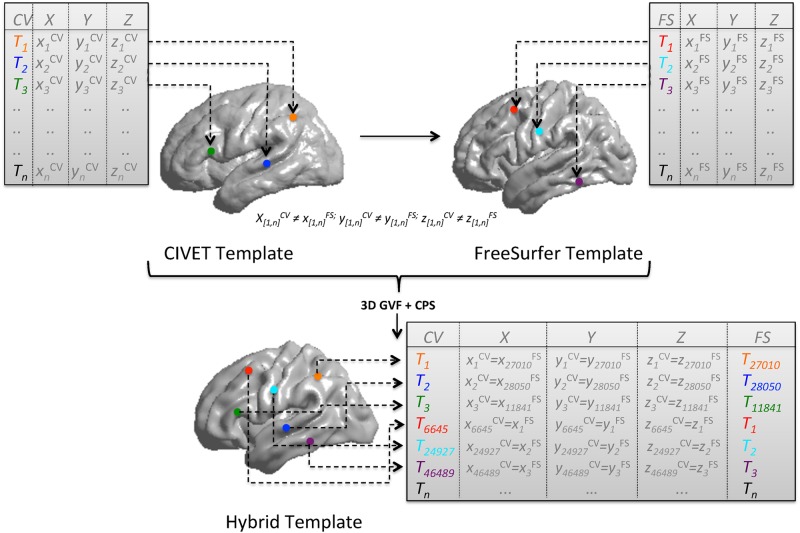
Methods: Images from 185 ADNI1 cases (69 elderly controls (CTR), 37 stable MCI (sMCI), 27 progressive MCI (pMCI), and 52 Alzheimer (AD) patients) scanned at baseline, month 12, and month 24 were processed using the two pipelines and two interconnected e-infrastructures: neuGRID (https://neugrid4you.eu) and VIP (http://vip.creatis.insa-lyon.fr). The vertex-by-vertex cross-algorithm comparison was made possible applying the 3D gradient vector flow (GVF) and closest point search (CPS) techniques.

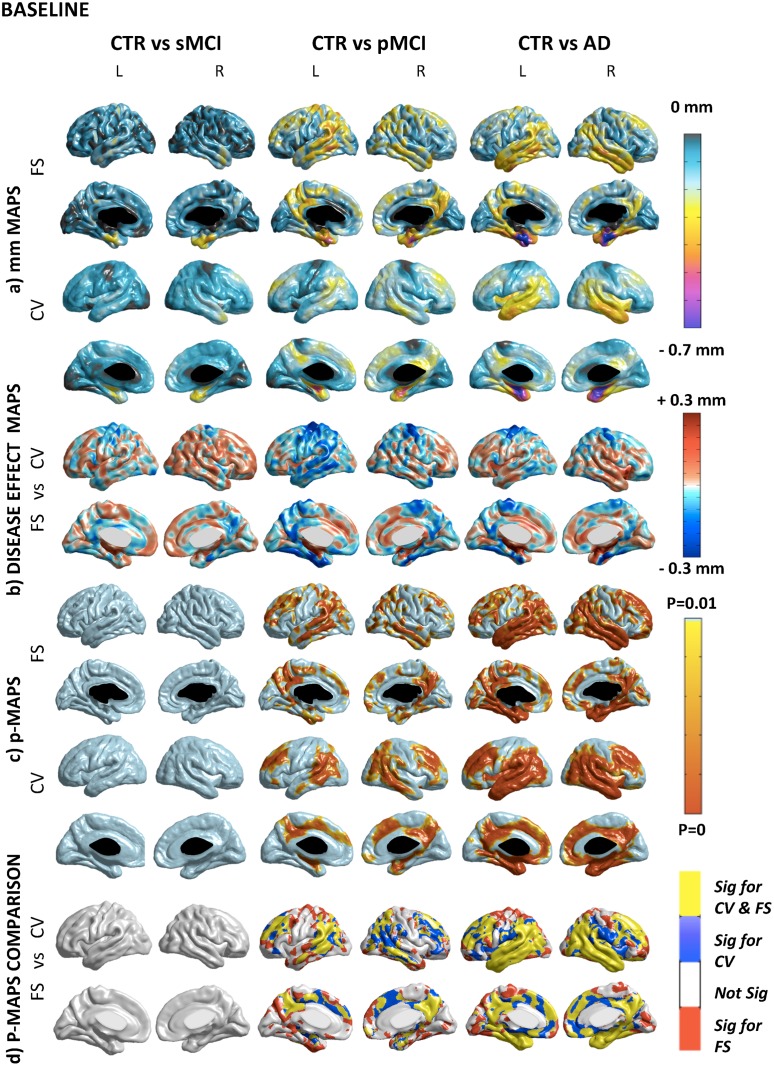
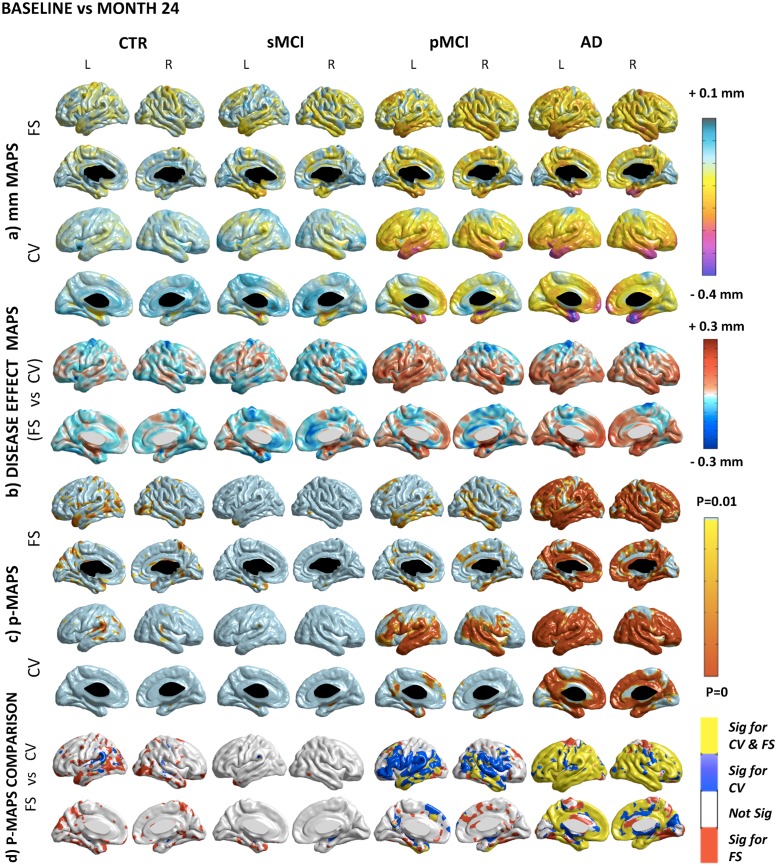
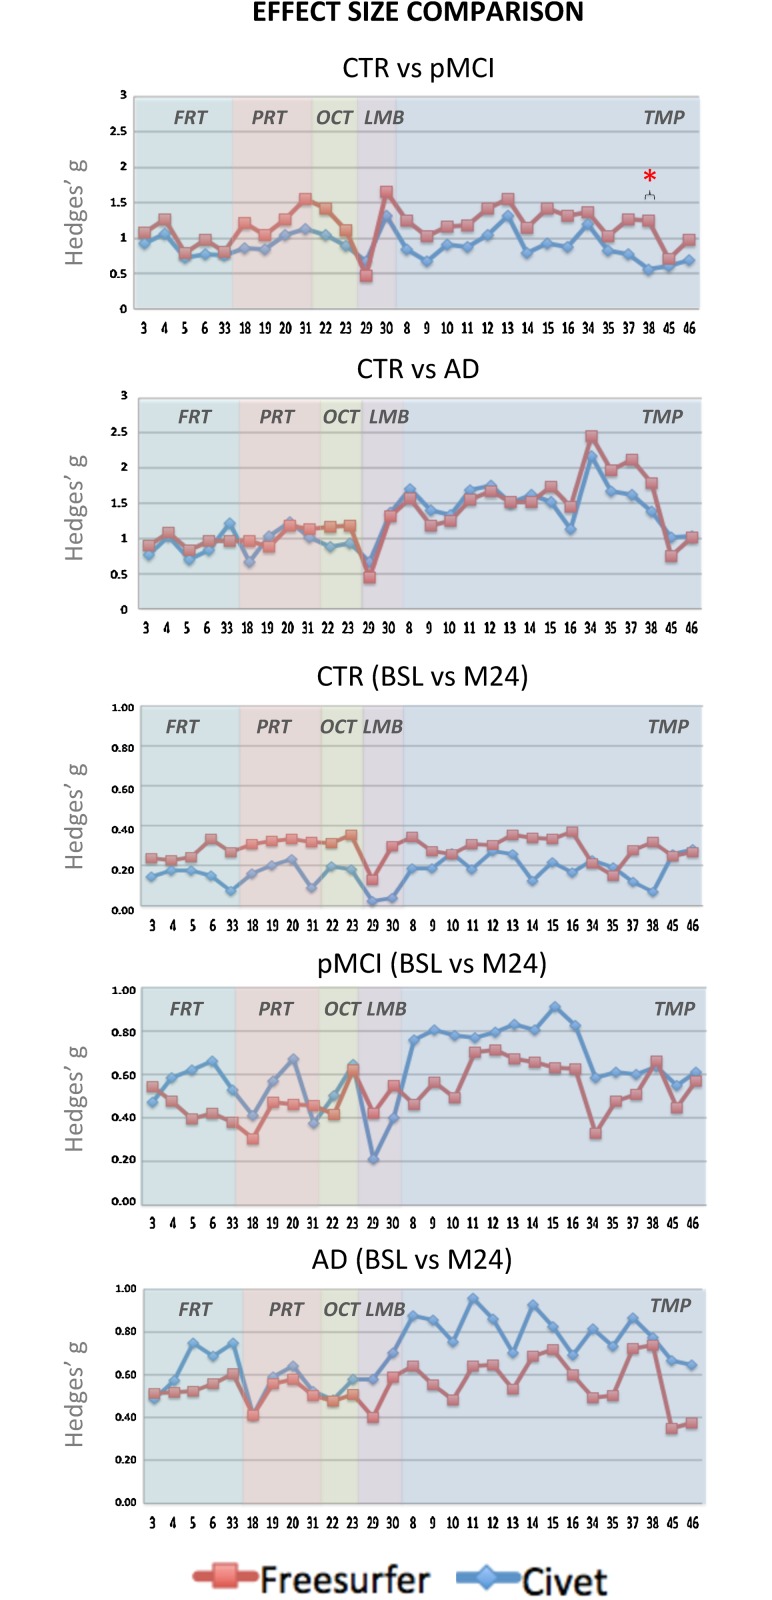
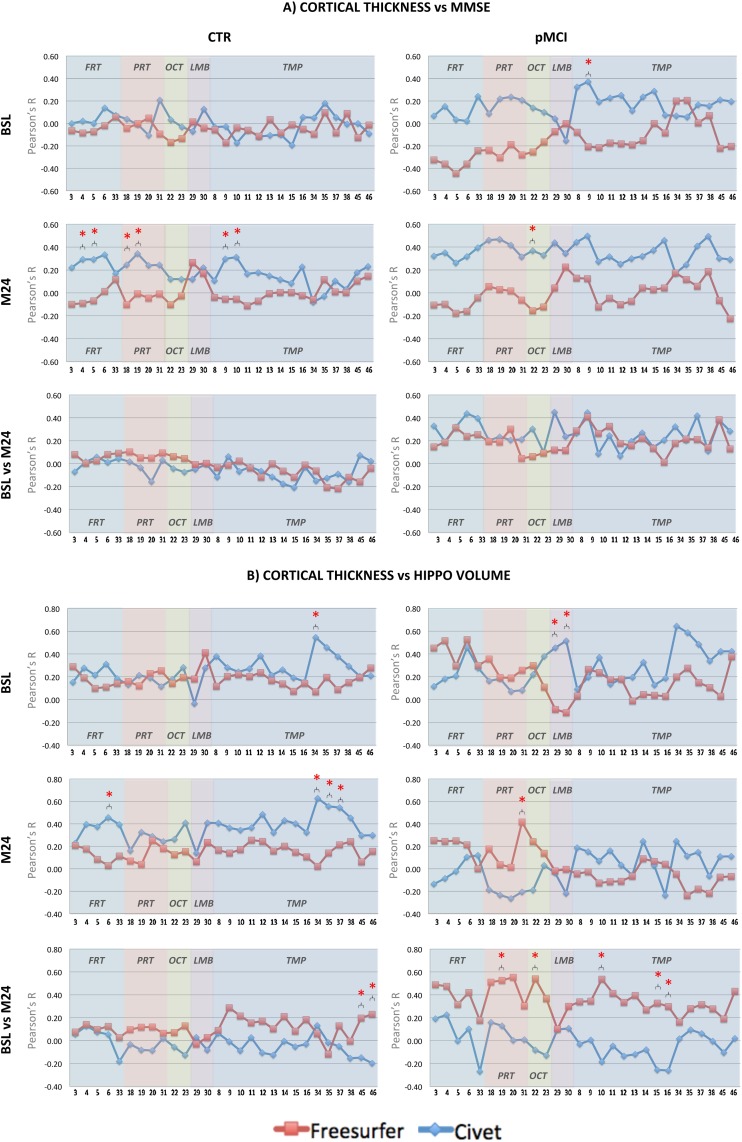
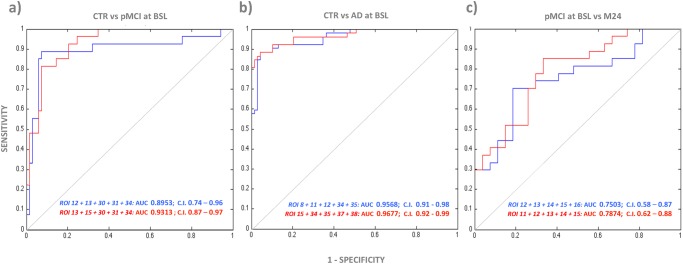
Results: The cortical thickness measured with Freesurfer was systematically lower by one third if compared to Civet's. Cross-sectionally, Freesurfer's effect size was significantly different in the posterior division of the temporal fusiform cortex. Both pipelines were weakly or mildly correlated with the Mini Mental State Examination score (MMSE) and the hippocampal volumetry. Civet differed significantly from Freesurfer in large frontal, parietal, temporal and occipital regions (p<0.05). In a discriminant analysis with cortical ROIs having effect size larger than 0.8, both pipelines gave no significant differences in area under the curve (AUC). Longitudinally, effect sizes were not significantly different in any of the 28 ROIs tested. Both pipelines weakly correlated with MMSE decay, showing no significant differences. Freesurfer mildly correlated with hippocampal thinning rate and differed in the supramarginal gyrus, temporal gyrus, and in the lateral occipital cortex compared to Civet (p<0.05). In a discriminant analysis with ROIs having effect size larger than 0.6, both pipelines yielded no significant differences in the AUC.

Conclusions: Civet appears slightly more sensitive to the typical AD atrophic pattern at the MCI stage, but both pipelines can accurately characterize the topography of cortical thinning at the dementia stage.


Conflict of interest statement

Competing Interests: The author D. Manset is an employee of/affiliated with Gnúbila France. This does not alter the authors' adherence to all PLOS ONE policies on sharing data and materials.

Figures

Fig 1
Fig 1. Registration of templates and surface points correspondence.
Source template is Civet’s surface while target template is the Freesurfer’ surface template. Starting from two averaged surfaces (previously created from the same set of 10 CTR, 10 sMCI, and 10 AD brains) the hybrid template (characterized by 81924 vertices and 163840 faces) is derived after 15 GFV iterations. In GVF, deformations are achieved by tuning an underlying set of control points (187×187×187) in the source surface. Control point displacements are then interpolated to obtain a continuous transformation through basis spline functions. To keep the contour smooth, a membrane and percentage thin plate energy was used as regularization. The parameters defining the attraction to edges and energy surfaces were empirically determined. Finally, the CPS step defined the mutual correspondence of Civet and Freesurfer thickness values for each vertex. CV: Civet; FS: Freesurfer; X-Y-Z: value of the vertex space coordinates; T: value of the cortical thickness for each vertex; n: number of vertices (min = 0; max = 81924); 3D GVF: 3D gradient vector flow; CPS: Closest point search.
Fig 2
Fig 2. Cross-sectional comparison.
A) Absolute difference maps (mm) in Freesurfer and Civet. The degree of atrophy ranges between 0.1 and 0.7 mm in the different areas of the cortical mantle. B) Disease effect maps. There is a consistent delta (±0.3 mm) among the compared groups. Negative value means higher disease effect for Freesurfer (i.e.: parietal-temporal and precuneus areas); positive value means higher disease effect for Civet (i.e.: association areas and limbic parts of the cortex). C) Statistical difference maps (p<0.01 FDR-corrected). No significant voxels were found comparing CTR to sMCI. Atrophic areas were found contrasting pMCI with CTR (i.e.: the posterior cingulate, temporal lobe and frontal gyrus) with both tools. Comparing CTR versus AD the statistical significance extended (i.e.: medial temporal, retrosplenial, and lateral temporal regions). D) Overlapping and not-overlapping atrophic regions are shown. Significant voxels detected by both pipelines are in yellow; voxels detected only by Civet are in blue; voxels detected only by Freesurfer are in red. CV: Civet; FS: Freesurfer; L: Left hemisphere; R: Right hemisphere; CTR: Normal elderly controls; sMCI: stable MCI; pMCI: progressive MCI; AD: Alzheimer’s Disease.
Fig 3
Fig 3. Longitudinal comparison.
A) Absolute difference maps (mm) in each group. In CTR and sMCI, both pipelines report a very mild and widespread cortical thinning rate in the motor, somatosensory, verbal and visual association cortex. In pMCI, the atrophy peaks at rates around 0.3 mm in the medial temporal cortex, temporal-parietal-frontal neocortices, with sparing of the sensorimotor strip and of the visual cortex. In AD, the atrophy in the same areas accelerates beyond 0.4 mm. B) Disease effect maps. The mean estimate of the longitudinal disease effect in CTR and sMCI as computed by Freesurfer is greater, although Civet shows higher results in few scattered areas. Furthermore, in the entire disease spectrum, Freesurfer exhibited higher disease effect in the motor cortex. In pMCI, Civet exhibits a greater disease effect except for the cingulate gyrus, while in the AD group the exception is represented by the precuneus. C) Statistical difference maps (p<0.01 FDR-corrected). In CTR, Civet detects an atrophic cluster in the angular gyrus; while Freesurfer in the precuneus and in the temporo-occipital lobe. The pattern in sMCI was more reduced than in CTR. In pMCI Freesurfer was not able to find many regions detected by Civet with the same significance and extension (i.e.: orbital, triangulal, and opercular portion of the inferior frontal gyrus, transverse-temporal and mesial part of the superior frontal cortex, inferior parietal cortex, the superior temporal gyrus). Freesurfer was more sensitive in few scattered expected and unexpected regions. For both pipelines, the longitudinal AD shrinkage showed significant areas throughout the temporal, frontal and parietal lobes, consistently with the progression of the disease. Some shrivelling differences were detected in the anterior division of the cingulate, in the limbic lobe and in the cuneus. D) Overlapping and not-overlapping atrophic regions are shown. Significant voxels detected by both pipelines are in yellow; voxels detected only by Civet are in blue; voxels detected only by Freesurfer are in red. CV: Civet; FS: Freesurfer; L: Left hemisphere; R: Right hemisphere; CTR: Normal elderly controls; sMCI: stable MCI; pMCI: progressive MCI; AD: Alzheimer’s Disease.
Fig 4
Fig 4. Hedges’ g effect size graphs in the different ROI areas.
The first two panels represent the cross-sectional effect sizes comparing the overall trend of CTR versus pMCI, and of CTR versus AD. The remaining three panels represent the longitudinal effect sizes between the baseline and month 24 in CTR, pMCI, and AD groups. The * symbol stands for p<0.05.
Fig 5
Fig 5. Pearson’s r coefficient of cortical thickness versus MMSE scores (panel A).
In the CTR group, no significant differences between ROIs were detected in the two pipelines at BSL. At M24, significant differences between the two pipelines were found in the: middle frontal gyrus; inferior frontal gyrus—pars triangularis; superior parietal lobule; anterior division of the supramarginal gyrus; anterior and posterior division of the superior temporal gyrus. Longitudinally, no significant differences between ROIs were detected in the two pipelines. In the pMCI group, significant difference between the two pipelines was found at BSL in the: anterior division of the superior temporal gyrus. At M24, significant difference between the two pipelines was found in the: superior division of the lateral occipital cortex. Longitudinally, no significant differences between ROIs were detected in the two pipelines. Pearson’s r coefficient of cortical thickness versus NeuroQuant hippocampal volume (panel B): In the CTR group, significant difference between the two pipelines at BSL was found in the: anterior division of the parahippocampal gyrus. At M24, significant differences between the two pipelines were found in the: inferior frontal gyrus—pars opercularis; anterior and posterior division of the parahippocampal gyrus; anterior division of the temporal fusiform cortex. Longitudinally, significant differences between the two pipelines were found in the: Heschl’s gyrus and temporal planum. In the pMCI group, significant difference between the two pipelines was found at BSL in the: precuneus cortex. Longitudinally, significant differences between the two pipelines were found in the: anterior division of the supramarginal gyrus, superior division of the lateral occipital cortex, posterior division of the superior temporal gyrus, posterior division of the inferior temporal gyrus, temporo-occipital part of the inferior temporal gyrus. In panels A and B, * symbol stands for p<0.05 (Steiger’s z-test). Red coloured lines represent the trends in Freesurfer, blue lines in Civet. CTR.: CTR: Normal elderly controls; sMCI: stable MCI; pMCI: progressive MCI; AD: Alzheimer’s disease; BSL: baseline; M24: month 24; FRT: Frontal; PRT: Parietal; OCT: Occipital; LIMB: Limbic; TMP: Temporal.
Fig 6
Fig 6. Receiving Operator Characteristic (ROC) curves showing the performances of Civet and Freesurfer in classifying: A) CTR versus pMCI at baseline; B) CTR versus AD at baseline; and C) pMCI at baseline from month 24.
AUC with 95% CIs are reported for both Freesurfer in red and Civet in blue. CTR: Normal elderly controls; sMCI: stable MCI; pMCI: progressive MCI; AD: Alzheimer’s Disease; BSL: baseline; M24: month 24; AUC: Area Under the Curve; C.I: Confidence Interval; ROI 8: temporal pole; ROI 11: anterior division of the middle temporal gyrus; ROI 12: posterior division of the middle temporal gyrus; ROI 13: temporo-occipital part of middle temporal gyrus; ROI 15: posterior division of inferior temporal gyrus; ROI 16: temporo-occipital part of inferior temporal gyrus; ROI 30: posterior division of the cingulate gyrus; ROI 31: Precuneus Cortex; ROI 34: anterior division of the parahippocampal gyrus; ROI 35: posterior division of the parahippocampal gyrus; ROI 37: anterior division of the temporal fusiform cortex; ROI 38: posterior division of the temporal fusiform cortex.

References

    1. Fox NC, Kennedy J (2009) Structural imaging markers for therapeutic trials in Alzheimer’s disease. J Nutr 13(4): 350–352. - PubMed
    1. Jack CR Jr, Shiung MM, Gunter JL, O’Brien PC, Weigand SD, et al. (2004) Comparison of different MRI brain atrophy rate measures with clinical disease progression in AD. Neurology 62(4): 591–600. - PMC - PubMed
    1. Fox NC, Black RS, Gilman S, Rossor MN, Griffith SG, et al. (2005) Effects of Abeta immunization (AN1792) on MRI measures of cerebral volume in Alzheimer disease. Neurology 64(9): 1563–1572. - PubMed
    1. Thompson P, Hayashi KM, Zubicaray G, Janke AL, Rose SE, et al. (2003) Dynamics of gray matter loss in Alzheimer’s disease. J Neurosci 23: 994–1005. - PMC - PubMed
    1. Han X, Jovicich J, Salat D, van der Kouwe A, Quinn B, et al. (2006) Reliability of MRI-derived measurements of human cerebral cortical thickness: the effects of field strength, scanner upgrade and manufacturer. Neuroimage 32(1): 180–94. - PubMed

Publication types

MeSH terms