. 2015 Mar 13;16(3):5922-44.
doi: 10.3390/ijms16035922.

Ameliorative effects of PACAP against cartilage degeneration. Morphological, immunohistochemical and biochemical evidence from in vivo and in vitro models of rat osteoarthritis

Affiliations

Ameliorative effects of PACAP against cartilage degeneration. Morphological, immunohistochemical and biochemical evidence from in vivo and in vitro models of rat osteoarthritis

Salvatore Giunta et al. Int J Mol Sci. .

Erratum in

Abstract

Osteoarthritis (OA); the most common form of degenerative joint disease, is associated with variations in pro-inflammatory growth factor levels, inflammation and hypocellularity resulting from chondrocyte apoptosis. Pituitary adenylate cyclase-activating polypeptide (PACAP) is a neuropeptide endowed with a range of trophic effects in several cell types; including chondrocytes. However; its role in OA has not been studied. To address this issue, we investigated whether PACAP expression is affected in OA cartilage obtained from experimentally-induced OA rat models, and then studied the effects of PACAP in isolated chondrocytes exposed to IL-1β in vitro to mimic the inflammatory milieu of OA cartilage. OA induction was established by histomorphometric and histochemical analyses. Changes in PACAP distribution in cartilage, or its concentration in synovial fluid (SF), were assessed by immunohistochemistry and ELISA. Results showed that PACAP abundance in cartilage tissue and SF was high in healthy controls. OA induction decreased PACAP levels both in affected cartilage and SF. In vitro, PACAP prevented IL-1β-induced chondrocyte apoptosis, as determined by MTT assay; Hoechst staining and western blots of apoptotic-related proteins. These changes were also accompanied by decreased i-NOS and COX-2 levels, suggesting an anti-inflammatory effect. Altogether, these findings support a potential role for PACAP as a chondroprotective agent for the treatment of OA.


Figures

Figure 1
Figure 1
Graph A, Kraus’ modified Mankin score. Kraus’ modified Mankin score among groups. Results are presented as the mean ± SEM. One-way ANOVA followed by Tukey’s post-hoc test was used to evaluate statistical significance of the results. ** p < 0.01 when compared to the control groups; Graph B, Histopathology OARSI system. Histopathology OARSI system among groups. Results are presented as the mean ± SEM. One-way ANOVA followed by Tukey’s post-hoc test was used to evaluate statistical significance of the results. ** p < 0.01 when compared to the control groups.
Figure 2
Figure 2
Histological and histochemical evaluation. (A,B) Histology (H&E staining) demonstrated the absence of structural alterations in control groups (without anterior cruciate ligament transection (ACLT)). In the superficial zone, cells appear flat and small; in the middle and deep zone, cells are organized in columns. Magnification ×20; Scale bars: 100 µm; (C) Histology (H&E staining) demonstrated evidence of structural alterations in cartilage with moderate signs of OA (with ACLT). The structural alterations included a reduction of cartilage thickness in the superficial and the middle zones. The tidemark is no longer intact and the subchondral bone shows fibrillation. Magnification ×20; Scale bars: 100 µm; (D) Histology (H&E staining) demonstrated signs of structural alterations in severe Osteoarthritis (OA) (with ACLT). Severe OA cartilage shows deep surface clefts, disappearance of cells from the superficial zone, cloning, and a lack of cells in the intermediate and deep zone, which are not arranged in columns. The cartilage layers (superficial zone, middle and deep zone) are completely absent. Magnification ×20; Scale bars: 100 µm; (E,F) Histochemistry (toluidine blue staining) showed an absence of structural alterations and preserved GAG, in control groups (without ACLT), as indicated by the intense toluidine blue staining. Magnification ×20; Scale bars: 100 µm; (G) Histochemistry (toluidine blue staining) demonstrated signs of structural alterations in moderate and severe OA cartilage and loss of proteoglycans as evidenced by poor GAG preservation in the OA group (with ACLT), showing reduced toluidine blue staining. Magnification ×20; Scale bars: 100 µm.
Figure 3
Figure 3
Pituitary adenylate cyclase-activating polypeptide (PACAP) immunoreactivity in healthy and OA cartilage tissue. (A,B) PACAP immunohistochemistry in control cartilage (without ACLT) exhibited a very strong (ES = ++++; IS = 4) immunostaining in chondrocytes from rat femoral articular cartilage (superficial and middle zone). Magnification ×20; Scale bars: 100 µm; (C) PACAP immunohistochemistry in moderate/severe OA cartilage (with ACLT) exhibited a weak/absent (ES = +; IS = 1) immunostaining in chondrocytes from rat femoral articular cartilage (superficial and middle zone). Magnifications ×20; Scale bars: 100 µm; (D) No immunostaining was observed in the negative control (ES = 0; IS = 0) treated with PBS in place of the primary antibody. Magnifications ×20; Scale bars: 100 µm; (E) Immunohistochemistry: percentage of PACAP positive cells out of the total number of cells counted in control groups and in OA group. Results are presented as the mean ± SEM. One-way ANOVA followed by Tukey’s post-hoc test was applied to evaluate the statistical significance of the results. ** p < 0.01 vs. control groups.
Figure 4
Figure 4
PACAP and IL-1β concentration in the SF collected from the articular cavity of the knee joint from healthy and ACLT-induced OA rats. PACAP and IL-1β concentration in the SF was measured by ELISA method both in controls, sham-operated and OA rat groups. The concentration of PACAP and IL-1β in the box and whisker plots represent the lower and the upper quartile; the open circle in the middle of the box represents the median and the ends of the lines extend to the smallest and largest data point ≤1.5 IQR (interquartile range). (* p < 0.05, vs. control and sham).
Figure 5
Figure 5
Effects of PACAP on IL-1β induced chondrocyte apoptosis. Chondrocytes were exposed to either vehicle or interleukin 1-β (IL-1β) for 24h at indicated concentrations and cell viability (A), DNA damage (B) as well as the expression of apoptotic-related proteins (Bcl-2, BAX and Cleaved Caspase-3, respectively) were analyzed as detailed in “Materials and Methods”; (A) MTT analyses. Values are expressed as mean optical densities (ODs) ± SEM, obtained from three separate batches of cells, each run in duplicate; (* p < 0.05 or ** p < 0.01 vs. untreated cells; # p < 0.05 vs. vehicle); (B) Hoechst 33258 nuclear staining. Cells were stained with the fluorescent nuclear dye Hoechst 33258 and viewed at ×40 magnification; Scale bar = 50 μm. At least three randomly selected fields from five independent cultures on cover slips were assessed; (C) Western blot analyses of Bcl-2, BAX and Cleaved Caspase-3. Bands were quantified using ImageQuantTL software. BAX/Bcl-2 ratio and Cleaved Caspase-3 normalized values were plotted in the bar graph shown on the right of the representative blots. Quantification of band intensities was performed using the freely available Image J software. Results are reported as average values ± SEM, (* p < 0.05 or ** p < 0.01 vs. untreated cells). Each experiment was performed at least three times using three different batches of cells (n = 3).
Figure 6
Figure 6
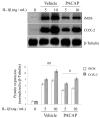
Effects of PACAP on IL-1β induced iNOS and COX-2 expression levels. Chondrocytes were exposed to IL-1β for 24 h at indicated concentrations and changes in iNOS and COX-2 protein levels were measured by Western blot analyses; Bands were quantified using ImageQuantTL software and normalized values were plotted in the histogram shown. Each value represents the mean band densities ± SEM from each group. (# p < 0.05 or ## p < 0.01 vs. vehicle). Experiments were repeated at least three times with similar results.
Figure 7
Figure 7
Schematic illustration depicting PACAP regulation in the proposed model of OA and its beneficial effects in isolated chondrocytes after IL-1β insult. Upon anterior cruciate ligament transection (ACLT), rats progressively develop clinical signs of OA, including cartilage deterioration and local inflammatory response [55,56]. In this scenario, PACAP immunoreactivity, which was detectable at high intensities in chondrocytes localized in the outer regions of the healthy cartilage is significantly reduced by experimental induction of OA. Such an event is accompanied by the reduction of PACAP concentration in the synovial fluid and a remarkable increase in intra-articular presence of the pro-inflammatory cytokine IL-1β, suggestive of an active inflammatory process. To assess whether PACAP contributed to prevent chondrocyte death, these cells were isolated through enzymatic digestion and challenged with IL-1β, to partly mimic the inflammatory milieu observed in vivo. Results show that PACAP treatment ameliorated most of the detrimental effects of the cytokine, acting both as a chondroprotective and anti-inflammatory molecule. PACAP conc. = PACAP concentration; PACAP-IR = PACAP immunoreactivity.

References

    1. Musumeci G., Trovato F.M., Loreto C., Leonardi R., Szychlinska M.A., Castorina S., Mobasheri A. Lubricin expression in human osteoarthritic knee meniscus and synovial fluid: A morphological, immunohistochemical and biochemical study. Acta Histochem. 2014;116:965–972. doi: 10.1016/j.acthis.2014.03.011. - DOI - PubMed
    1. Di Rosa M., Szychlinska M.A., Tibullo D., Malaguarnera L., Musumeci G. Expression of CHI3L1 and CHIT1 in osteoarthritic rat cartilage model. A morphological study. Eur. J. Histochem. 2014;58:213–221. doi: 10.1007/s00418-013-1152-3. - DOI - PMC - PubMed
    1. Musumeci G., Loreto C., Carnazza M.L., Cardile V., Leonardi R. Acute injury affects lubricin expression in knee menisci: An immunohistochemical study. Ann. Anat. 2013;195:151–158. doi: 10.1016/j.aanat.2012.07.010. - DOI - PubMed
    1. Musumeci G., Trovato F.M., Pichler K., Weinberg A.M., Loreto C., Castrogiovanni P. Extra-virgin olive oil diet and mild physical activity prevent cartilage degeneration in an osteoarthritis model. An “in vivo” and “in vitro” study on lubricin expression. J. Nutr. Biochem. 2013;24:2064–2075. doi: 10.1016/j.jnutbio.2013.07.007. - DOI - PubMed
    1. Johnstone B., Alini M., Cucchiarini M., Dodge G.R., Eglin D., Guilak F., Madry H., Mata A., Mauck R.L., Semino C.E., et al. Tissue engineering for articular cartilage repair-the state of the art. Eur. Cell Mater. 2013;2:248–267. - PubMed

Publication types

MeSH terms

Substances