

TPN-associated intestinal epithelial cell atrophy is modulated by TLR4/EGF signaling pathways
- PMID: 25782989
- PMCID: PMC4478799
- DOI: 10.1096/fj.14-269480
TPN-associated intestinal epithelial cell atrophy is modulated by TLR4/EGF signaling pathways
Abstract
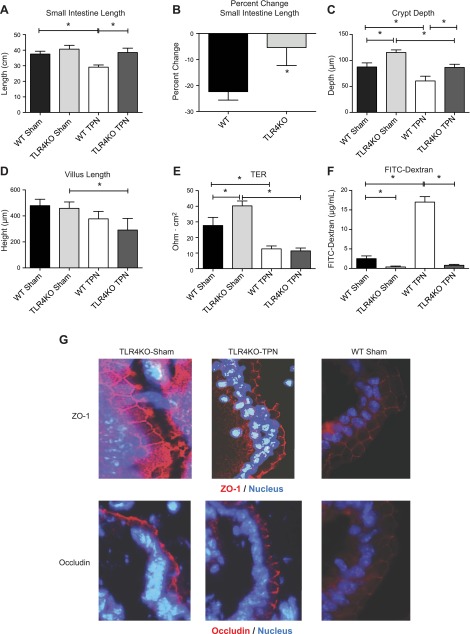
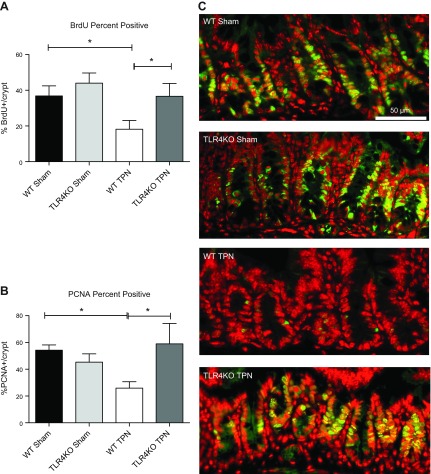
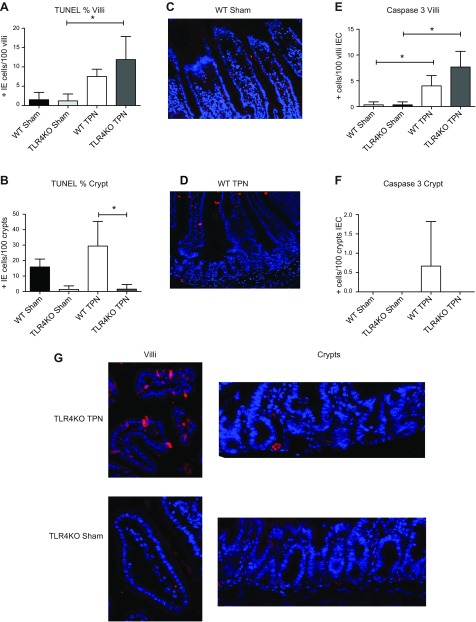
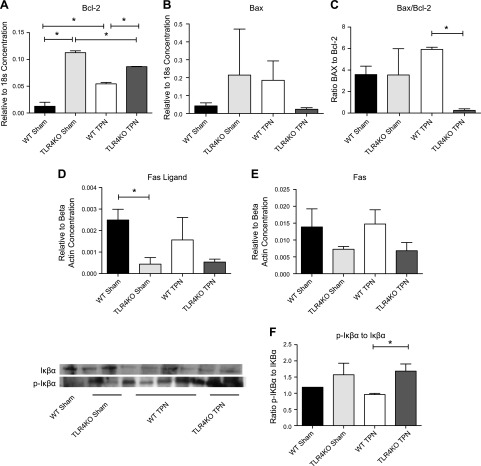
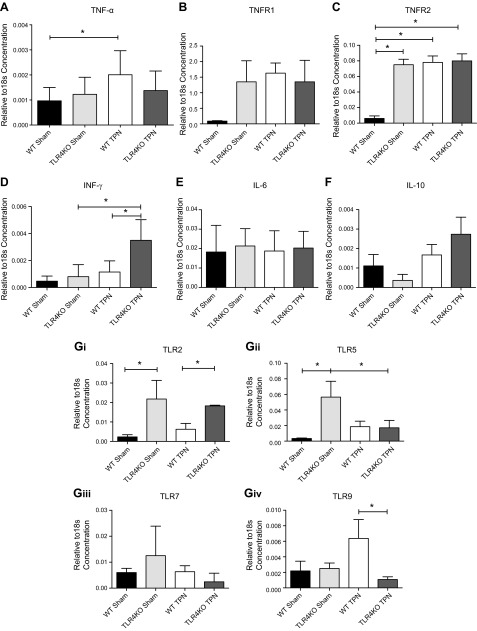
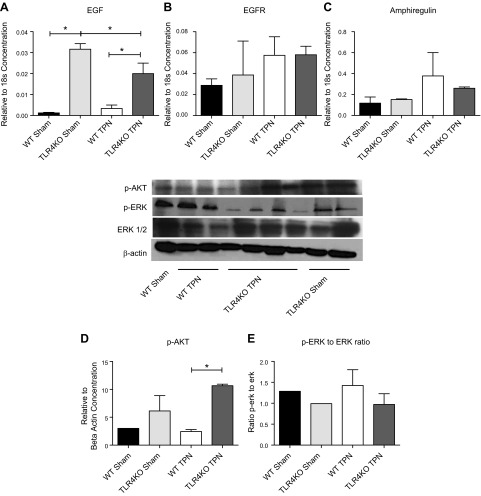
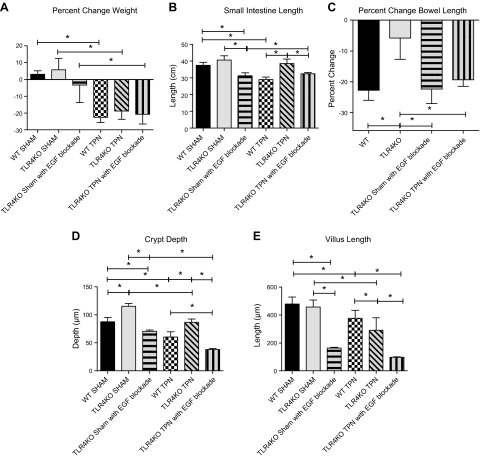
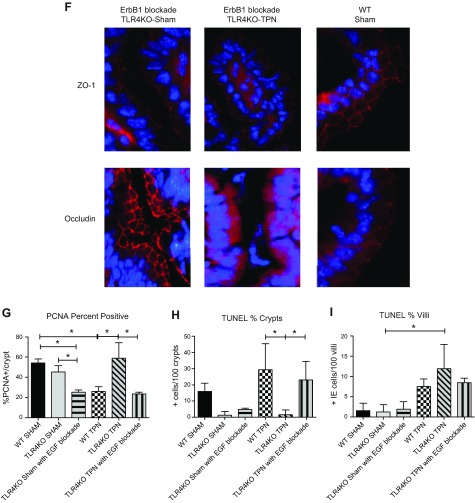
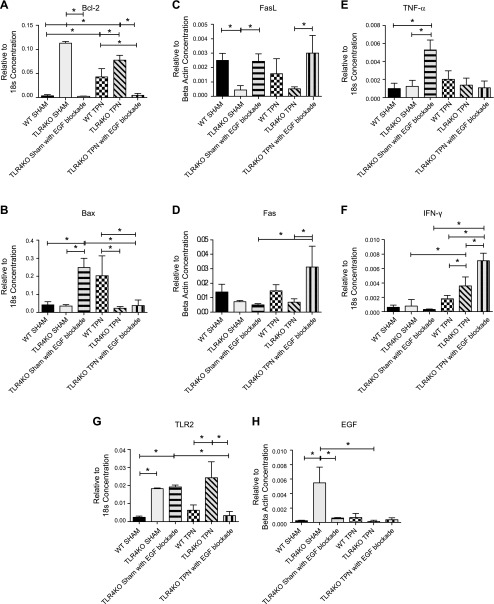
Recent studies suggest a close interaction between epidermal growth factor (EGF) and TLR signaling in the modulation of intestinal epithelial cell (IEC) proliferation; however, how these signaling pathways adjust IEC proliferation is poorly understood. We utilized a model of total parenteral nutrition (TPN), or enteral nutrient deprivation, to study this interaction as TPN results in mucosal atrophy due to decreased IEC proliferation and increased apoptosis. We identified the novel finding of decreased mucosal atrophy in TLR4 knockout (TLR4KO) mice receiving TPN. We hypothesized that EGF signaling is preserved in TLR4KO-TPN mice and prevents mucosal atrophy. C57Bl/6 and strain-matched TLR4KO mice were provided either enteral feeding or TPN. IEC proliferation and apoptosis were measured. Cytokine and growth factor abundances were detected in both groups. To examine interdependence of these pathways, ErbB1 pharmacologic blockade was used. The marked decline in IEC proliferation with TPN was nearly prevented in TLR4KO mice, and intestinal length was partially preserved. EGF was significantly increased, and TNF-α decreased in TLR4KO-TPN versus wild-type (WT)-TPN mice. Apoptotic positive crypt cells were 15-fold higher in WT-TPN versus TLR4KO-TPN mice. Bcl-2 was significantly increased in TLR4KO-TPN mice, while Bax decreased 10-fold. ErbB1 blockade prevented this otherwise protective effect in TLR4KO-sTPN mice. TLR4 blockade significantly prevented TPN-associated atrophy by preserving proliferation and preventing apoptosis. This is driven by a reduction in TNF-α abundance and increased EGF. Potential manipulation of this regulatory pathway may have significant clinical potential to prevent TPN-associated atrophy.
Keywords: apoptosis; epidermal growth factor; epithelial cell proliferation; mucosal atrophy; total parenteral nutrition.
© FASEB.
Figures
Similar articles
-
Epidermal growth factor/TNF-α transactivation modulates epithelial cell proliferation and apoptosis in a mouse model of parenteral nutrition.Am J Physiol Gastrointest Liver Physiol. 2012 Jan 15;302(2):G236-49. doi: 10.1152/ajpgi.00142.2011. Epub 2011 Nov 10. Am J Physiol Gastrointest Liver Physiol. 2012. PMID: 22075779 Free PMC article.
-
Loss of ADAM17-Mediated Tumor Necrosis Factor Alpha Signaling in Intestinal Cells Attenuates Mucosal Atrophy in a Mouse Model of Parenteral Nutrition.Mol Cell Biol. 2015 Nov;35(21):3604-21. doi: 10.1128/MCB.00143-15. Epub 2015 Aug 17. Mol Cell Biol. 2015. PMID: 26283731 Free PMC article.
-
Interdependency of EGF and GLP-2 Signaling in Attenuating Mucosal Atrophy in a Mouse Model of Parenteral Nutrition.Cell Mol Gastroenterol Hepatol. 2017 Jan 17;3(3):447-468. doi: 10.1016/j.jcmgh.2016.12.005. eCollection 2017 May. Cell Mol Gastroenterol Hepatol. 2017. PMID: 28462383 Free PMC article.
-
Intestinal epithelial cell apoptosis and loss of barrier function in the setting of altered microbiota with enteral nutrient deprivation.Front Cell Infect Microbiol. 2013 Dec 23;3:105. doi: 10.3389/fcimb.2013.00105. eCollection 2013. Front Cell Infect Microbiol. 2013. PMID: 24392360 Free PMC article. Review.
-
Total parenteral nutrition: potion or poison?Am J Clin Nutr. 2001 Aug;74(2):160-3. doi: 10.1093/ajcn/74.2.160. Am J Clin Nutr. 2001. PMID: 11470715 Review.
Cited by
-
Supplementary choline attenuates olive oil lipid emulsion-induced enterocyte apoptosis through suppression of CELF1/AIF pathway.J Cell Mol Med. 2018 Mar;22(3):1562-1573. doi: 10.1111/jcmm.13430. Epub 2017 Nov 6. J Cell Mol Med. 2018. PMID: 29105957 Free PMC article.
-
RNA-Binding Protein HuR Regulates Paneth Cell Function by Altering Membrane Localization of TLR2 via Post-transcriptional Control of CNPY3.Gastroenterology. 2019 Sep;157(3):731-743. doi: 10.1053/j.gastro.2019.05.010. Epub 2019 May 17. Gastroenterology. 2019. PMID: 31103627 Free PMC article.
-
Spleen Regulates Hematopoietic Stem/Progenitor Cell Functions Through Regulation of EGF in Cirrhotic Hypersplenism.Dig Dis Sci. 2018 Jul;63(7):1860-1867. doi: 10.1007/s10620-018-5091-7. Epub 2018 May 3. Dig Dis Sci. 2018. PMID: 29721775
-
Intestine, immunity, and parenteral nutrition in an era of preferred enteral feeding.Curr Opin Clin Nutr Metab Care. 2015 Sep;18(5):496-500. doi: 10.1097/MCO.0000000000000208. Curr Opin Clin Nutr Metab Care. 2015. PMID: 26154279 Free PMC article. Review.
-
Mechanisms of Parenteral Nutrition-Associated Liver and Gut Injury.Nutr Clin Pract. 2020 Feb;35(1):63-71. doi: 10.1002/ncp.10461. Epub 2019 Dec 23. Nutr Clin Pract. 2020. PMID: 31872510 Free PMC article. Review.
References
-
- Braga M., Ljungqvist O., Soeters P., Fearon K., Weimann A., Bozzetti F.; ESPEN (2009) ESPEN guidelines on parenteral nutrition: surgery. Clin. Nutr. 28, 378–386 - PubMed
-
- Duro D., Kamin D., Duggan C. (2008) Overview of pediatric short bowel syndrome. J. Pediatr. Gastroenterol. Nutr. 47(Suppl 1), S33–S36 - PubMed
-
- Wildhaber B. E., Lynn K. N., Yang H., Teitelbaum D. H. (2002) Total parenteral nutrition–induced apoptosis in mouse intestinal epithelium: regulation by the Bcl-2 protein family. Pediatr. Surg. Int. 18, 570–575 - PubMed
-
- Yang H., Kiristioglu I., Fan Y., Forbush B., Bishop D. K., Antony P. A., Zhou H., Teitelbaum D. H. (2002) Interferon-gamma expression by intraepithelial lymphocytes results in a loss of epithelial barrier function in a mouse model of total parenteral nutrition. Ann. Surg. 236, 226–234 - PMC - PubMed
Publication types
MeSH terms
Substances
Grants and funding
LinkOut - more resources
Full Text Sources
Other Literature Sources
Molecular Biology Databases
Research Materials
Miscellaneous
