. 2015 May;168(1):18-28.
doi: 10.1104/pp.15.00119. Epub 2015 Mar 17.

In vivo chemical and structural analysis of plant cuticular waxes using stimulated Raman scattering microscopy

Affiliations

In vivo chemical and structural analysis of plant cuticular waxes using stimulated Raman scattering microscopy

George R Littlejohn et al. Plant Physiol. 2015 May.

Abstract

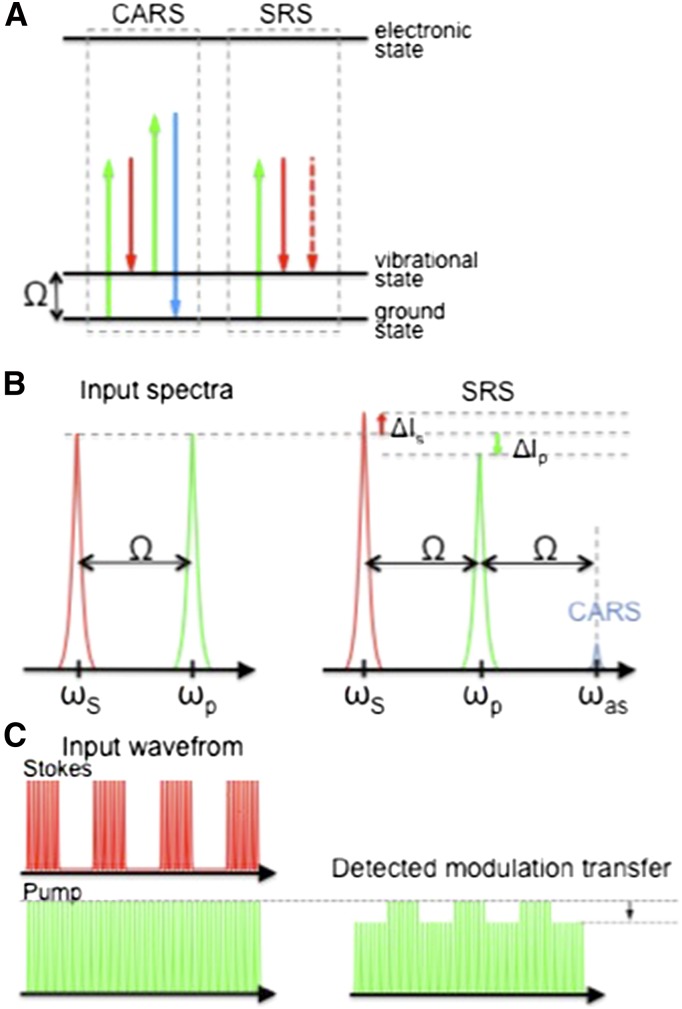
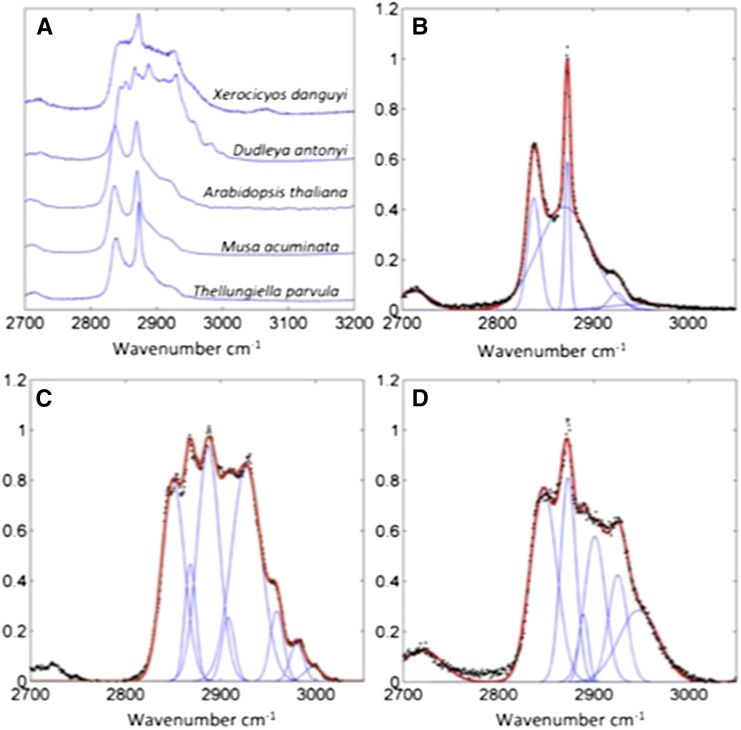
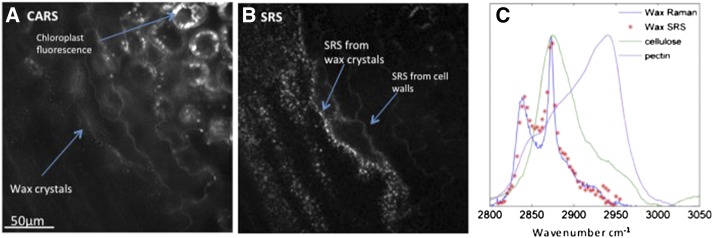
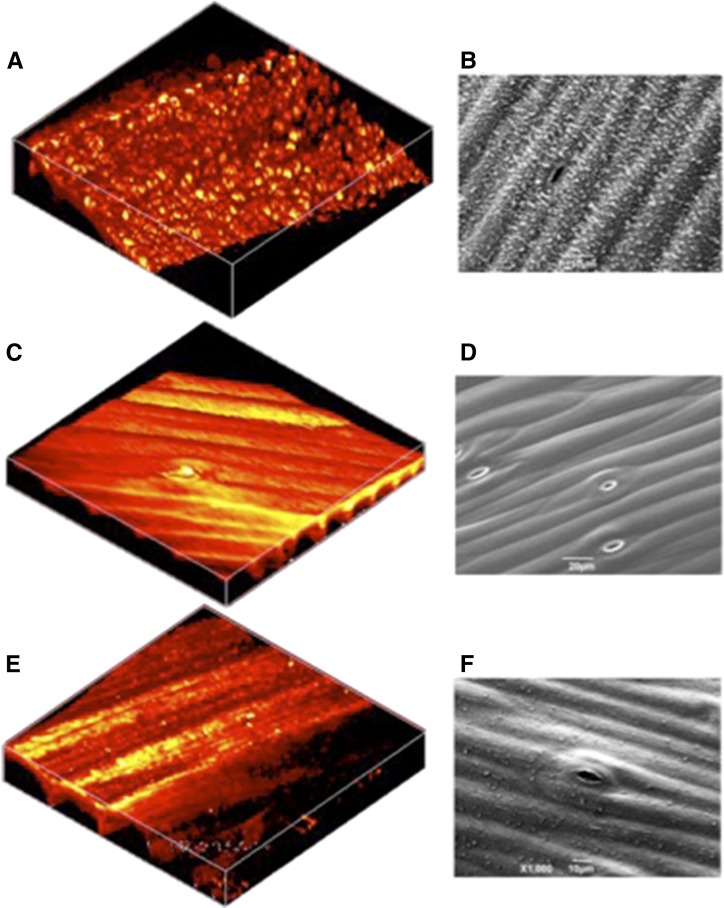
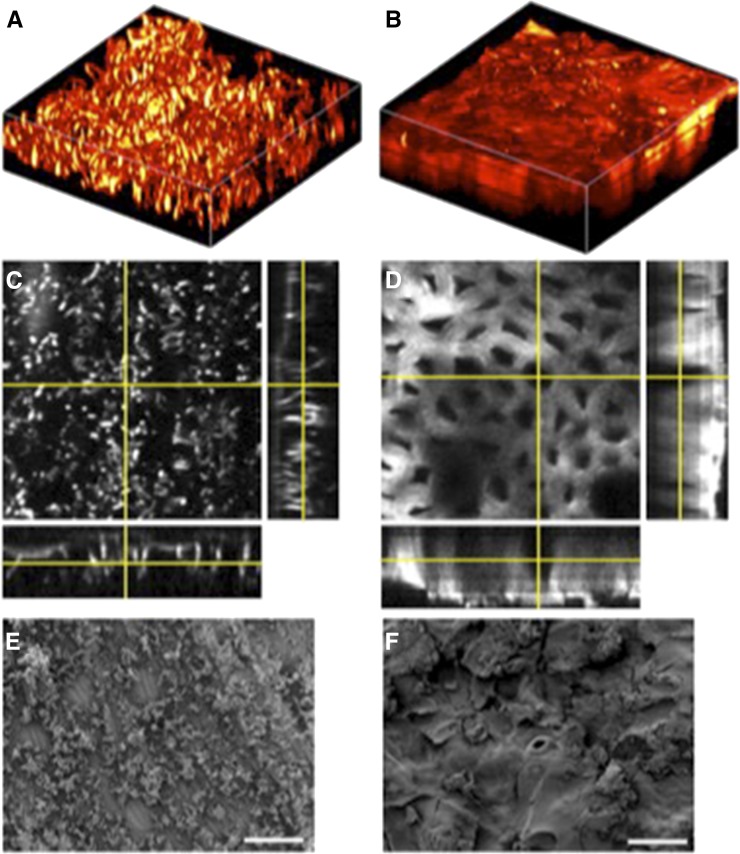
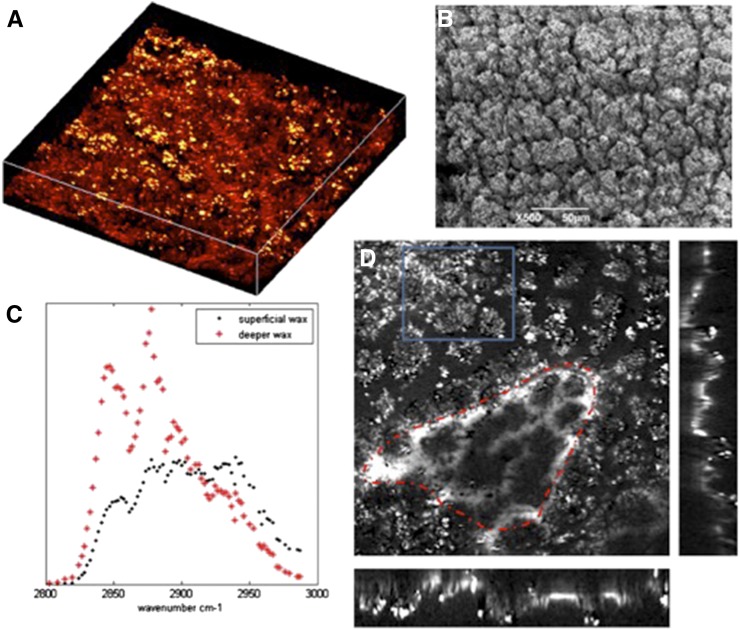
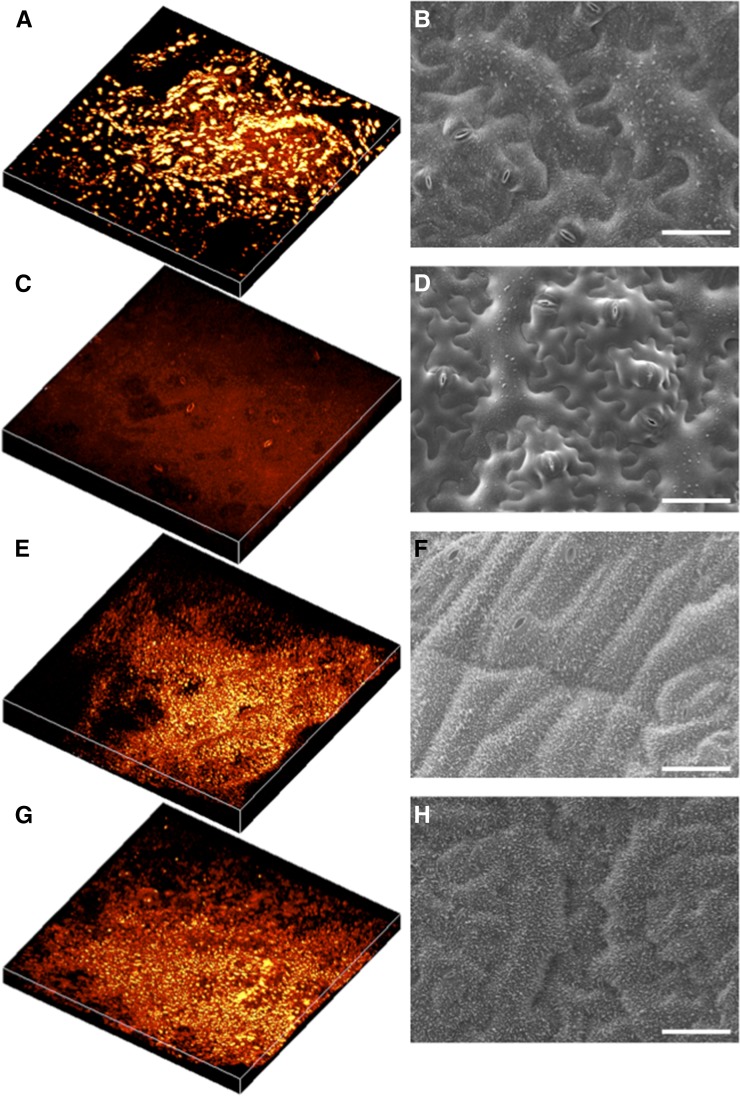
The cuticle is a ubiquitous, predominantly waxy layer on the aerial parts of higher plants that fulfils a number of essential physiological roles, including regulating evapotranspiration, light reflection, and heat tolerance, control of development, and providing an essential barrier between the organism and environmental agents such as chemicals or some pathogens. The structure and composition of the cuticle are closely associated but are typically investigated separately using a combination of structural imaging and biochemical analysis of extracted waxes. Recently, techniques that combine stain-free imaging and biochemical analysis, including Fourier transform infrared spectroscopy microscopy and coherent anti-Stokes Raman spectroscopy microscopy, have been used to investigate the cuticle, but the detection sensitivity is severely limited by the background signals from plant pigments. We present a new method for label-free, in vivo structural and biochemical analysis of plant cuticles based on stimulated Raman scattering (SRS) microscopy. As a proof of principle, we used SRS microscopy to analyze the cuticles from a variety of plants at different times in development. We demonstrate that the SRS virtually eliminates the background interference compared with coherent anti-Stokes Raman spectroscopy imaging and results in label-free, chemically specific confocal images of cuticle architecture with simultaneous characterization of cuticle composition. This innovative use of the SRS spectroscopy may find applications in agrochemical research and development or in studies of wax deposition during leaf development and, as such, represents an important step in the study of higher plant cuticles.


Figures

Figure 1.
Figure 1.
Schematic representation of the two CRS processes: CARS and SRS. A, Energy level diagrams for the CARS and SRS processes, showing the pump (green), Stokes (red), and anti-Stokes (blue) photon energies. B, Diagrammatic representation of the input and output spectra for CARS and SRS, showing the gain and loss in the pump (red) and Stokes (green) beams, respectively. ΔIS, Change in Stokes beam intensity; ΔIp, change in pump beam intensity. C, Diagrammatic representation of the modulation transfer detection scheme used to detect stimulated Raman gain and loss with high sensitivity.
Figure 2.
Figure 2.
Raman spectra and curve fits of plant leaf waxes. A, Raman spectra of cuticle waxes purified from silver dollar plant, D. anthonyi, Arabidopsis, banana, and T. parvula. Peak fitting to the Raman spectra of T. parvula (B), D. anthonyi (C), and silver dollar plant (D).
Figure 3.
Figure 3.
CARS and SRS images of the T. parvulaleaf surface. The surface of a leaf from T. parvula was simultaneously imaged using CARS microscopy (A) and SRS microscopy (B). Both images were acquired at a 2,845 cm–1 CH2 symmetric stretch. The CARS image (A) is dominated by autofluorescence, and only the largest wax crystals are visible against the background. Conversely, the SRS image (B) is almost background free, enabling the cell walls and wax crystals to be clearly visualized. C shows the spectral scan of the SRS (red crosses) from the wax crystals in situ overlaid onto the spontaneous Raman spectra of purified T. parvula wax (blue line), purified cellulose (green line), and purified pectin (purple line).
Figure 4.
Figure 4.
SRS images and scanning electron micrographs of Arabidopsis cuticle. The surface of Arabidopsis stems were imaged using SRS microscopy (A, C, and D) and SEM (B, D, and E). A and B, The surface of the untreated stem of wild-type Arabidopsis, ecotype Landsberg erecta, with the structure of cuticle wax crystals clearly visible. C and D, The surface of the wild-type Arabidopsis stem following a wash in hexane that dissolved the cuticle waxes. E and F, The surface of the stem from a cer1 Arabidopsis mutant. A, C, and E were generated from three-dimensional stacks taken of a 64- × 64-µm field of view and are displayed in false color.
Figure 5.
Figure 5.
SRS images and scanning electron micrographs of cuticle of banana and of silver dollar plant. The surface of banana and of silver dollar plant leaves were imaged using SRS microscopy (A–D) and SEM (E and F). A, An SRS image of the adaxial leaf surface of surface banana constructed from an image stack from a 64- × 64-µm field of view. B, An SRS image of silver dollar plant leaf reconstructed from an image stack from a 126- × 126-µm field of view. C and D, Orthogonal views projected from the image stacks presented in A and B, respectively, showing the depth profile of cuticles. E and F, SEM images of the cuticles of banana and silver dollar plant leaves, respectively.
Figure 6.
Figure 6.
SRS spectral images of D. anthonyi cuticle. SRS spectral imaging of D. anthonyi cuticle waxes shows changes in chemical composition with depth. A and B, The SRS and SEM images, respectively, of D. anthonyi leaf showing the crystalline structure of cuticle wax deposits on the adaxial surface. The image in A is a three-dimensional reconstruction of an image stack taken from a 126- × 126-µm field of view at the 2,840 cm–1 Raman shift. C, SRS spectral scans taken from the more superficial and deeper wax areas indicated on D. Blue rectangle, An area of superficial wax; red line, an area deeper in the cuticle. The imagess on the right and bottom of the main image in D are from the orthogonal views through the stack showing the depth profile image of the cuticle wax.
Figure 7.
Figure 7.
SRS images and scanning electron micrographs of the cuticle of T. salsuginea following cold-induced wax biogenesis. T. salsuginea leaves were imaged using SRS spectral imaging and SEM before and after cold treatment. A, C, E, and G, Three-dimensional reconstructions of image stacks from a 250- × 250-µm field of view at the 2,840 cm–1 Raman shift. B, D, F, and H, SEM images. A to D are, respectively, from the adaxial and abaxial leaf surfaces of plants grown at 20°C for 8 weeks. E to H are, respectively, from adaxial and abaxial leaf surfaces of plants grown at 20°C for 4 weeks and then at 4°C for 2 weeks and at 20°C for an additional 2 weeks. Bars = 50 µm.

References

    1. Aarts MG, Keijzer CJ, Stiekema WJ, Pereira A (1995) Molecular characterization of the CER1 gene of Arabidopsis involved in epicuticular wax biosynthesis and pollen fertility. Plant Cell 7: 2115–2127 - PMC - PubMed
    1. Amtmann A. (2009) Learning from evolution: Thellungiella generates new knowledge on essential and critical components of abiotic stress tolerance in plants. Mol Plant 2: 3–12 - PMC - PubMed
    1. Baker EA, Holloway PJ (1971) Scanning electron microscopy of waxes on plant surfaces. Micron 2: 364–380
    1. Barthlott W, Neinhuis C (1997) Purity of the sacred lotus, or escape from contamination in biological surfaces. Planta 202: 1–8
    1. Barthlott W, Neinhuis C, Cutler D, Ditsch F, Meusel I, Theisen I, Wilhelmi H (2008) Classification and terminology of plant epicuticular waxes. Bot J Linn Soc 126: 237–260

Publication types

MeSH terms

LinkOut - more resources