

Small-for-gestational age and large-for-gestational age thresholds to predict infants at risk of adverse delivery and neonatal outcomes: are current charts adequate? An observational study from the Born in Bradford cohort
- PMID: 25783424
- PMCID: PMC4368928
- DOI: 10.1136/bmjopen-2014-006743
Small-for-gestational age and large-for-gestational age thresholds to predict infants at risk of adverse delivery and neonatal outcomes: are current charts adequate? An observational study from the Born in Bradford cohort
Abstract
Objectives: Construct an ethnic-specific chart and compare the prediction of adverse outcomes using this chart with the clinically recommended UK-WHO and customised birth weight charts using cut-offs for small-for-gestational age (SGA: birth weight <10th centile) and large-for-gestational age (LGA: birth weight >90th centile).
Design: Prospective cohort study.
Setting: Born in Bradford (BiB) study, UK.
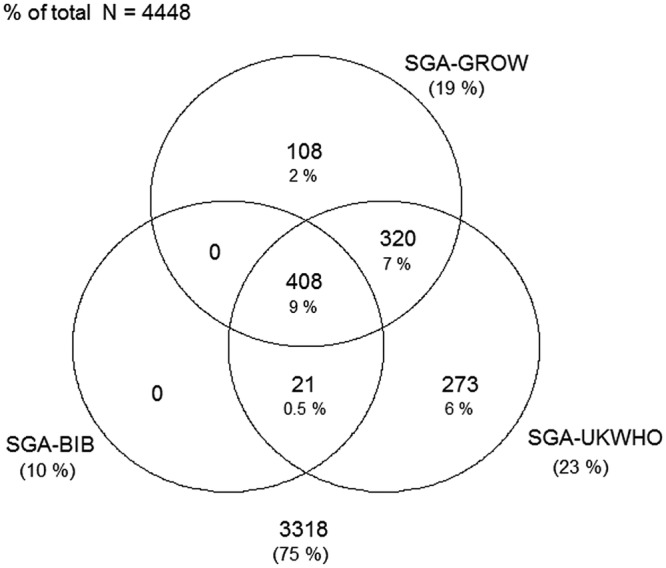
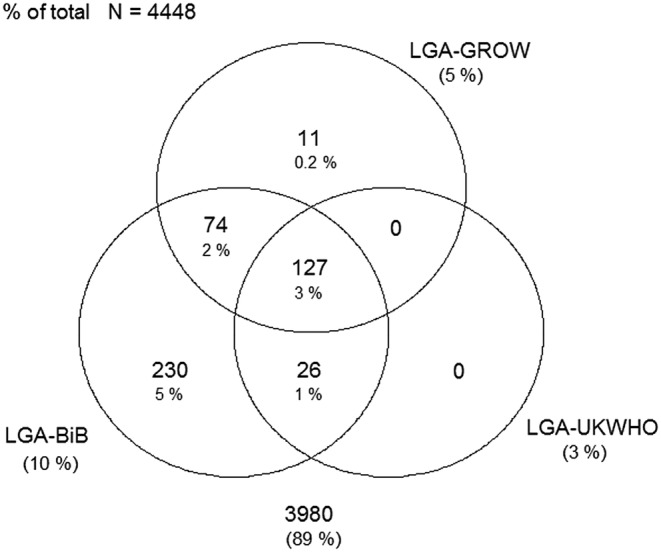
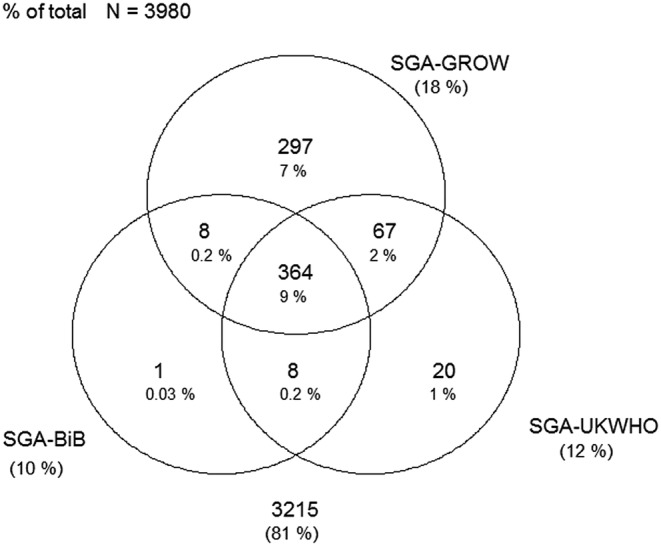
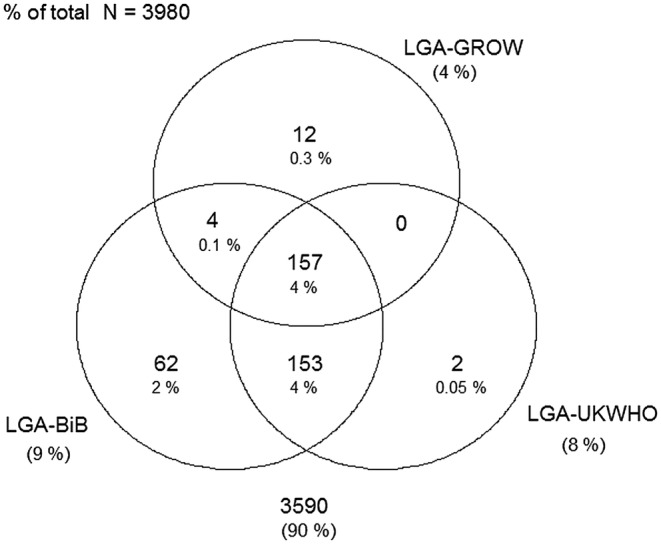
Participants: 3980 White British and 4448 Pakistani infants with complete data for gestational age, birth weight, ethnicity, maternal height, weight and parity.
Main outcome measures: Prevalence of SGA and LGA, using the three charts and indicators of diagnostic utility (sensitivity, specificity and area under the receiver operating characteristic (AUROC)) of these chart-specific cut-offs to predict delivery and neonatal outcomes and a composite outcome.
Results: In White British and Pakistani infants, the prevalence of SGA and LGA differed depending on the chart used. Increased risk of SGA was observed when using the UK-WHO and customised charts as opposed to the ethnic-specific chart, while the opposite was apparent when classifying LGA infants. However, the predictive utility of all three charts to identify adverse clinical outcomes was poor, with only the prediction of shoulder dystocia achieving an AUROC>0.62 on all three charts.
Conclusions: Despite being recommended in national clinical guidelines, the UK-WHO and customised birth weight charts perform poorly at identifying infants at risk of adverse neonatal outcomes. Being small or large may increase the risk of an adverse outcome; however, size alone is not sensitive or specific enough with current detection to be useful. However, a significant amount of missing data for some of the outcomes may have limited the power needed to determine true associations.
Keywords: EPIDEMIOLOGY; NEONATOLOGY; PERINATOLOGY.
Published by the BMJ Publishing Group Limited. For permission to use (where not already granted under a licence) please go to http://group.bmj.com/group/rights-licensing/permissions.
Figures
Similar articles
-
Determination of birth-weight centile thresholds associated with adverse perinatal outcomes using population, customised, and Intergrowth charts: A Swedish population-based cohort study.PLoS Med. 2019 Sep 20;16(9):e1002902. doi: 10.1371/journal.pmed.1002902. eCollection 2019 Sep. PLoS Med. 2019. PMID: 31539391 Free PMC article.
-
Identification of the optimal growth charts for use in a preterm population: An Australian state-wide retrospective cohort study.PLoS Med. 2019 Oct 4;16(10):e1002923. doi: 10.1371/journal.pmed.1002923. eCollection 2019 Oct. PLoS Med. 2019. PMID: 31584941 Free PMC article.
-
Association between perinatal mortality and morbidity and customised and non-customised birthweight centiles in Denmark, Finland, Norway, Wales, and England: comparative, population based, record linkage study.BMJ Med. 2023 Aug 30;2(1):e000521. doi: 10.1136/bmjmed-2023-000521. eCollection 2023. BMJ Med. 2023. PMID: 37663045 Free PMC article.
-
Biochemical tests of placental function versus ultrasound assessment of fetal size for stillbirth and small-for-gestational-age infants.Cochrane Database Syst Rev. 2019 May 14;5(5):CD012245. doi: 10.1002/14651858.CD012245.pub2. Cochrane Database Syst Rev. 2019. PMID: 31087568 Free PMC article.
-
Birth-weight charts and immigrant populations: A critical review.Best Pract Res Clin Obstet Gynaecol. 2016 Apr;32:69-76. doi: 10.1016/j.bpobgyn.2015.09.001. Epub 2015 Sep 14. Best Pract Res Clin Obstet Gynaecol. 2016. PMID: 26453476 Review.
Cited by
-
Neighborhood Socioeconomic Disadvantage and Abnormal Birth Weight.Obstet Gynecol. 2023 Nov 1;142(5):1199-1207. doi: 10.1097/AOG.0000000000005384. Epub 2023 Sep 28. Obstet Gynecol. 2023. PMID: 37769319 Free PMC article.
-
Occupational chemical exposures in pregnancy and fetal growth: evidence from the Born in Bradford Study.Scand J Work Environ Health. 2020 Jul 1;46(4):417-428. doi: 10.5271/sjweh.3878. Epub 2020 Jan 23. Scand J Work Environ Health. 2020. PMID: 31970422 Free PMC article.
-
Factors associated with small- and large-for-gestational-age in socioeconomically vulnerable individuals in the 100 Million Brazilian Cohort.Am J Clin Nutr. 2021 Jul 1;114(1):109-116. doi: 10.1093/ajcn/nqab033. Am J Clin Nutr. 2021. PMID: 33826704 Free PMC article.
-
Machine learning prediction of non-attendance to postpartum glucose screening and subsequent risk of type 2 diabetes following gestational diabetes.PLoS One. 2022 Mar 7;17(3):e0264648. doi: 10.1371/journal.pone.0264648. eCollection 2022. PLoS One. 2022. PMID: 35255105 Free PMC article.
-
Impact of London's road traffic air and noise pollution on birth weight: retrospective population based cohort study.BMJ. 2017 Dec 5;359:j5299. doi: 10.1136/bmj.j5299. BMJ. 2017. PMID: 29208602 Free PMC article.
References
-
- de Onis M, Garza C, Victora CG et al. . The WHO Multicentre Growth Reference Study: planning, study design, and methodology. Food Nutr Bull 2004;25(Supple 1):15S–26S. - PubMed
-
- SACN/RCPCH Expert Group. Application of WHO Growth Standards in UK 2007.
-
- West J, Lawlor DA, Fairley L et al. . UK-born Pakistani-origin infants are relatively more adipose than white British infants: findings from 8704 mother-offspring pairs in the Born-in-Bradford prospective birth cohort. J Epidemiol Community Health 2013;67:544–51. 10.1136/jech-2012-201891 - DOI - PMC - PubMed
Publication types
MeSH terms
Grants and funding
LinkOut - more resources
Full Text Sources
Other Literature Sources
Medical