. 2015 May;25(5):667-78.
doi: 10.1101/gr.187237.114. Epub 2015 Mar 17.

Full-genome evolutionary histories of selfing, splitting, and selection in Caenorhabditis

Affiliations

Full-genome evolutionary histories of selfing, splitting, and selection in Caenorhabditis

Cristel G Thomas et al. Genome Res. 2015 May.

Abstract

The nematode Caenorhabditis briggsae is a model for comparative developmental evolution with C. elegans. Worldwide collections of C. briggsae have implicated an intriguing history of divergence among genetic groups separated by latitude, or by restricted geography, that is being exploited to dissect the genetic basis to adaptive evolution and reproductive incompatibility; yet, the genomic scope and timing of population divergence is unclear. We performed high-coverage whole-genome sequencing of 37 wild isolates of the nematode C. briggsae and applied a pairwise sequentially Markovian coalescent (PSMC) model to 703 combinations of genomic haplotypes to draw inferences about population history, the genomic scope of natural selection, and to compare with 40 wild isolates of C. elegans. We estimate that a diaspora of at least six distinct C. briggsae lineages separated from one another approximately 200,000 generations ago, including the "Temperate" and "Tropical" phylogeographic groups that dominate most samples worldwide. Moreover, an ancient population split in its history approximately 2 million generations ago, coupled with only rare gene flow among lineage groups, validates this system as a model for incipient speciation. Low versus high recombination regions of the genome give distinct signatures of population size change through time, indicative of widespread effects of selection on highly linked portions of the genome owing to extreme inbreeding by self-fertilization. Analysis of functional mutations indicates that genomic context, owing to selection that acts on long linkage blocks, is a more important driver of population variation than are the functional attributes of the individually encoded genes.


Figures

Figure 1.
Figure 1.
Patterns of genetic diversity depend on genomic architecture. (A) Nucleotide polymorphism of silent sites in 20-kb windows is depressed in chromosome centers (and tips) compared to arm domains for Tropical strains (median of 20-kb windows on arms πsil = 0.165%; centers πsil = 0.041%; Wilcoxon χ2 = 1996.3; P < 0.0001). However, absolute divergence (Dxy) between Tropical and the distant Kerala group strains is largely insensitive to chromosomal domain. The recombination-associated domain structure of the X chromosome is less pronounced than for autosomes (Cutter and Choi 2010; Ross et al. 2011). (B) Chromosome centers also show more skew in the site frequency spectrum, indicative of an excess of rare alleles, which is expected to result from the interaction of selection and linkage. These qualitative patterns are consistent with analysis restricted to synonymous sites (Supplemental Fig. 10), indicating that differential constraint in noncoding regions does not drive the observed genomic patterns of polymorphism.
Figure 2.
Figure 2.
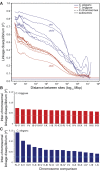
The decay of linkage disequilibrium (r2) is more rapid in C. briggsae than C. elegans along every chromosome. The sex chromosome is not distinctive relative to autosomes in terms of linkage disequilibrium (LD) decay in either species (A), although C. elegans Chromosomes I and IV have elevated LD, and C. briggsae Chromosome II shows reduced LD compared to other chromosomes. The interchromosomal LD for C. briggsae (B) spans a narrower range of mean values among chromosome pairs than C. elegans (C), although both species have more LD between chromosomes than expected (horizontal lines). Horizontal lines indicate the background LD expected given the sample size (Weir and Hill 1980). C. briggsae strains include 25 Tropical strains (excluding reference strain AF16); C. elegans includes 39 strains (excluding Hawaiian CB4846). LD calculations exclude singleton polymorphisms.
Figure 3.
Figure 3.
Diverse genomic analyses affirm the genetic distinctiveness of phylogeographic groups within C. briggsae. A neighbor network for all chromosomes (A) discriminates phylogeographic groups of strains, corresponding to the pan-global “Tropical” clade (red and pink strain labels), pan-global “Temperate” clade (blue), and genomic haplotype groups that exhibit restricted geographic origins around the globe: (Quebec) purple; (Nairobi) black; (Hubei) orange; (Taiwan) yellow; (Kerala) green. (B) The ADMIXTURE program minimizes the cross-validation error of ancestral relationships when it identifies four genetic clusters in this data set. (C) Permitting migration in the genomic ancestry of the 37 C. briggsae strains with TreeMix suggests multiple plausible instances of migration, although incomplete sorting of ancestral polymorphism provides an alternate interpretation. Heatmap above the genealogy indicates residual fit to a model with five migration events. (D) Haplotype clustering of the phylogeographic groups is recapitulated in a similar manner in ChromoPainter's genome-wide coancestry matrix (Euclidean log2). Dendrogram on left indicates strain clustering with the unlinked model; top dendrogram indicates strain clustering with the linked model. All analyses used the set of 439,139 SNPs with allele information present in all strains.
Figure 4.
Figure 4.
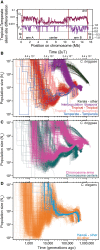
Demographic history of C. briggsae and C. elegans populations. (A) Relative measures of population differentiation (FST) are greater in chromosome centers between Temperate and Tropical phylogeographic groups. In contrast, the Dxy measure of absolute divergence between populations shows the opposite trend, indicative of selection at linked sites being stronger in the low recombination chromosome centers (Pease and Hahn 2013; Cruickshank and Hahn 2014). Window of 20 kb for silent sites along Chromosome I is shown as an exemplar of all chromosomes (Supplemental Fig. 2). Iterated pairwise sequential Markovian coalescent (PSMC) analysis of all C. briggsae (B,C) and C. elegans (D) genomes show the history of population size change and population splitting. Each line represents the change in population size (Ne) through time inferred for a pair of genomes, with all pairs of haploid genomes among the 37 strains of C. briggsae and 40 strains of C. elegans superimposed to indicate biological replication in the inference of demographic patterns. PSMC curve profiles restricted to the upper right in B illustrate the deep divergence of Kerala strains to all others (approximately 2 million generations ago; green) and the more recent “diaspora” of several genetically distinct strain groups from each other nearly simultaneously 300,000–500,000 generations (Kgen) ago (purple). PSMC profiles within each of the Tropical (red, pink) and Temperate phylogeographic groups show Ne fluctuations in their past, with larger Ne in the distant past and a recent population split within the Tropical group (pink versus red). Only analyses of chromosome center domains are shown in B. PSMC profiles of C. briggsae strain pairs from within a phylogeographic group other than Temperate and Tropical are not shown. Rapid recent time Ne increases likely reflect an artifact of the PSMC algorithm in estimating Ne on short timescales (Li and Durbin 2011). (C) PSMC profiles involving Tropical strain comparisons with all other strains partitioned according to chromosomal domain: (cyan) center domain; (magenta) arm domain. Low recombination chromosome centers have lower Ne and more recent coalescence, and the ancestral polymorphism that generates heterogeneity in the PSMC profiles of the “diaspora” differentiation of phylogeographic groups 300–500 Kgen ago is more constricted for chromosome centers. (D) PSMC analysis of C. elegans indicates a split of the Hawaiian CB4856 strain (blue; 30–50 Kgen ago) with all other strains in the sample (orange), and an overall strong decline in population time since then. Analyses of chromosome centers are shown, with analysis of arm regions in Supplemental Figure 8, excluding 14 of 703 C. briggsae strain pairs and 10 of 780 C. elegans strain pairs owing to spurious PSMC profiles.
Figure 5.
Figure 5.
Divergence at synonymous sites for orthologs of C. briggsae and C. nigoni is higher for genes linked to arm domains than center domains for all chromosomes (all Wilcoxon test P ≤ 0.0035). The chromosomes also differ significantly from one another in average substitution rates (F(5,5085) = 72.0; P < 0.0001), with Chromosome I being lowest and Chromosomes V and X being highest (Tukey's range test). Horizontal lines indicate mean dS for genes in center domains (cyan, dS = 0.186) or arms (magenta, dS = 0.259) across all chromosomes. Loci with strong codon bias (ENC < 45) excluded from analysis.
Figure 6.
Figure 6.
Missense and nonsense mutations are generally deleterious and selected against. (A) Windows of 20 kb sliding along Chromosome I indicate the lower polymorphism at nonsynonymous sites (πrep) than at synonymous sites (πsyn) for Tropical strains (see Supplemental Fig. 10 for all chromosomes). A slight trend of elevated πrepsyn in chromosome centers (B) is indicative of less effective selection in purging deleterious mutations from these regions of high linkage (median of 20-kb windows on arms πrepsyn = 0.259; centers πrepsyn = 0.290; Wilcoxon χ2 = 15.84; P < 0.0001). The stacked histogram of πrepsyn in B shows the cumulative abundance of 20-kb windows with a given bin of πreps across the six chromosomes, partitioned into chromosome arm and center domains. (C) Distribution of nonsense SNPs along coding sequences (CDS) expressed as percentage of the CDS length. (D) Distribution of the minor allele frequency (MAF) for different classes of SNPs: (red) synonymous; (blue) nonsynonymous; (orange) premature stop codons (PSC); (green) stop codon losses (SCL). PSC SNPs have significantly skewed low MAF values, indicating stronger selective constraints. In contrast, SCL SNPs have significantly higher MAF suggesting misannotation of the reference stop codon or PSC mutations in the reference genome.

Similar articles

Cited by

References

    1. The 1000 Genomes Project Consortium. 2012. An integrated map of genetic variation from 1,092 human genomes. Nature 491: 56–65. - PMC - PubMed
    1. Alexander DH, Novembre J, Lange K. 2009. Fast model-based estimation of ancestry in unrelated individuals. Genome Res 19: 1655–1664. - PMC - PubMed
    1. Andersen EC, Gerke JP, Shapiro JA, Crissman JR, Ghosh R, Bloom JS, Félix MA, Kruglyak L. 2012. Chromosome-scale selective sweeps shape Caenorhabditis elegans genomic diversity. Nat Genet 44: 285–290. - PMC - PubMed
    1. Baird SE, Stonesifer R. 2012. Reproductive isolation in Caenorhabditis briggsae: dysgenic interactions between maternal- and zygotic-effect loci result in a delayed development phenotype. Worm 1: 189–195. - PMC - PubMed
    1. Baird S, Davidson C, Bohrer J. 2005. The genetics of ray pattern variation in Caenorhabditis briggsae. BMC Evol Biol 5: 3. - PMC - PubMed

Publication types

Associated data