Comparative Study
. 2015 Jun;96(6):1226-39.
doi: 10.1111/mmi.13002. Epub 2015 Apr 23.

An expanded regulatory network temporally controls Candida albicans biofilm formation

Affiliations
Comparative Study

An expanded regulatory network temporally controls Candida albicans biofilm formation

Emily P Fox et al. Mol Microbiol. 2015 Jun.

Abstract

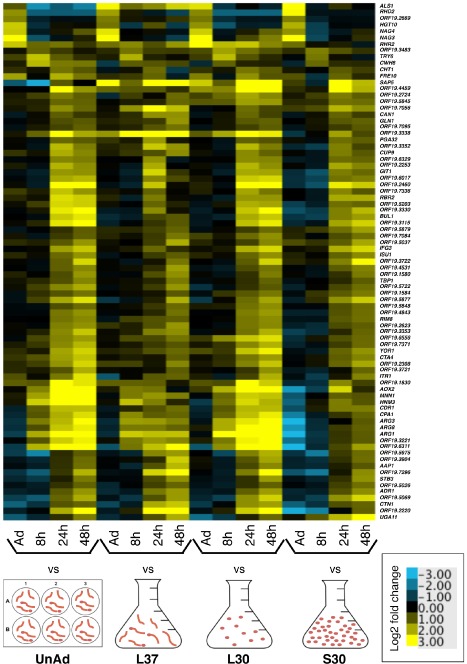
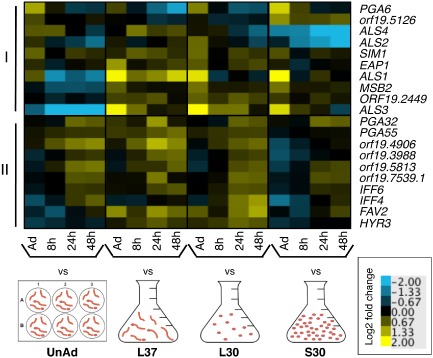
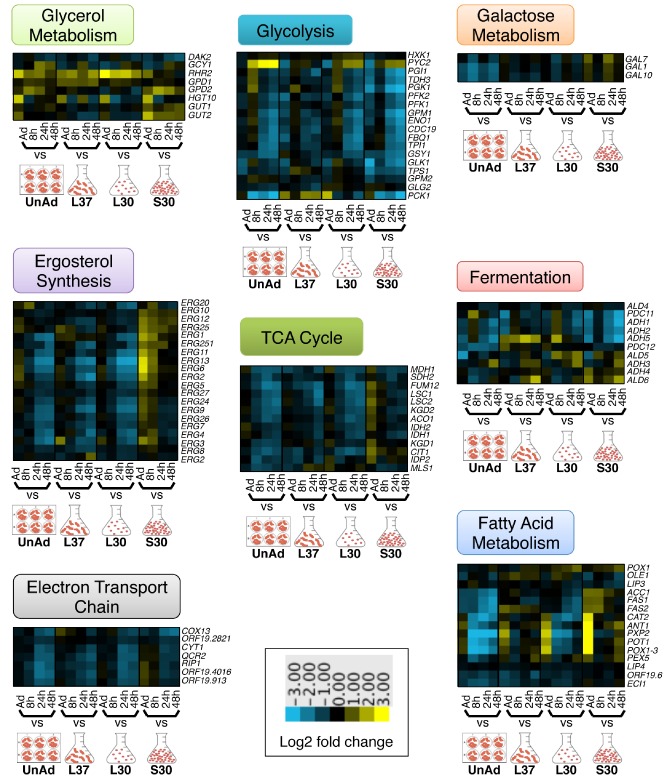
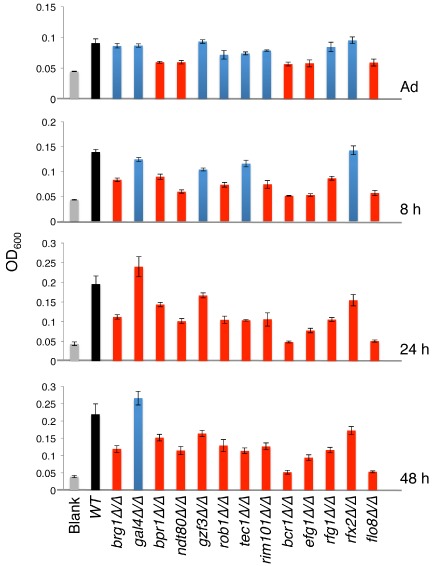
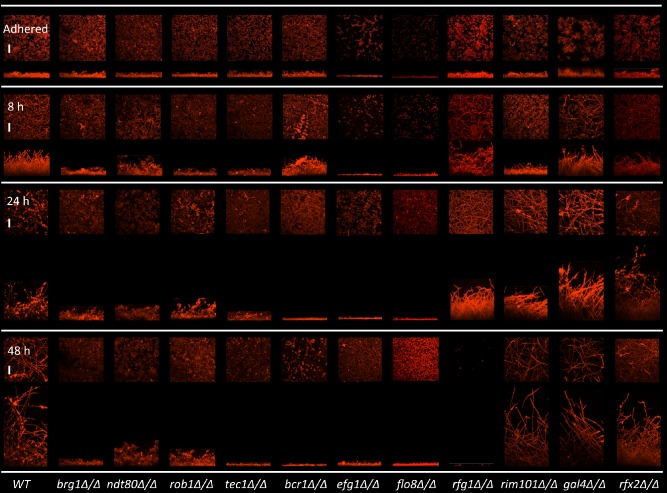
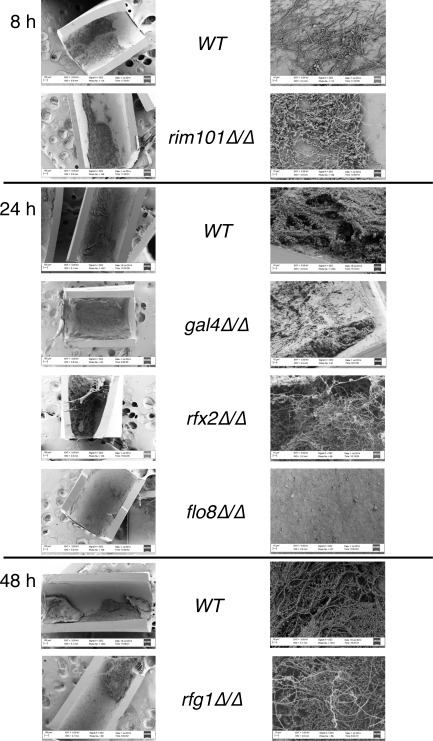
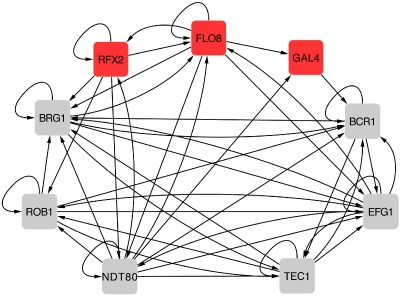
Candida albicans biofilms are composed of highly adherent and densely arranged cells with properties distinct from those of free-floating (planktonic) cells. These biofilms are a significant medical problem because they commonly form on implanted medical devices, are drug resistant and are difficult to remove. C. albicans biofilms are not static structures; rather they are dynamic and develop over time. Here we characterize gene expression in biofilms during their development, and by comparing them to multiple planktonic reference states, we identify patterns of gene expression relevant to biofilm formation. In particular, we document time-dependent changes in genes involved in adhesion and metabolism, both of which are at the core of biofilm development. Additionally, we identify three new regulators of biofilm formation, Flo8, Gal4, and Rfx2, which play distinct roles during biofilm development over time. Flo8 is required for biofilm formation at all time points, and Gal4 and Rfx2 are needed for proper biofilm formation at intermediate time points.


Figures

Figure 1
Figure 1
Eighty‐one genes are upregulated temporally in biofilms irrespective of which planktonic reference is used. Heat map of gene expression in C . albicans in biofilms at the indicated time points, compared with each of four reference conditions: unadhered cells (UnAd), log phase cells grown at 37°C (L37), log phase cells grown at 30°C (L30) and stationary phase cells grown at 30°C (S30). Shown are the median values of at least two biological replicates. On the y‐axis are 81 genes that are expressed early or late in biofilms compared with each reference condition. Upregulated genes are yellow; downregulated genes are blue. See also Fig. S1.
Figure 2
Figure 2
Two patterns of biofilm‐specific expression of adhesion genes are observed during biofilm development. Heat map of gene expression in C . albicans in biofilms at the indicated time points, compared with each of four reference conditions: unadhered cells (UnAd), log phase cells grown at 37°C (L37), log phase cells grown at 30°C (L30) and stationary phase cells grown at 30°C (S30). Shown are the median values of at least two biological replicates. On the y‐axis are known or predicted adhesion‐encoding genes differentially regulated at least twofold in at least one condition: I) genes upregulated early. II) genes upregulated late. Upregulated genes are yellow; downregulated genes are blue.
Figure 3
Figure 3
Metabolism is downregulated over time during biofilm development. Heat maps of gene expression in C . albicans in biofilms at the indicated time points, compared with each of four reference conditions: unadhered cells (UnAd), log phase cells grown at 37°C (L37), log phase cells grown at 30°C (L30) and stationary phase cells grown at 30°C (S30). Shown are the median values of at least two biological replicates. Each heat map shows expression of genes involved in the metabolic processes of glycolysis, the tricarboxylic acid cycle (TCA) cycle, the electron transport chain, fermentation, glycerol metabolism, galactose metabolism, fatty acid metabolism or ergosterol biosynthesis. Upregulated genes are yellow; downregulated genes are blue.
Figure 4
Figure 4
Thirteen transcription regulators are required for normal biofilm development in vitro in an optical density assay. The indicated wild type or mutant strains were adhered in a 96 well polystyrene plate for 90 min (labeled ‘Adhered’), unadhered cells were removed and adhered cells developed into biofilms for 8, 24 or 48 h. Biofilm formation was quantified by measuring OD600 of the cells adhered to the bottom of the well. Shown is the mean of at least six replicates, error bars are standard deviation. Gray bars are blank wells, black bars are wild type biofilms, blue bars are deletion strain biofilms not significantly different from wild type, red bars are deletion strain biofilms significantly different from wild type, P < 0.001 by Student's paired t‐test. See also Figs S2 and 3.
Figure 5
Figure 5
Eleven transcription regulators are required for normal biofilm development in vitro by CSLM. The indicated wild type or mutant strains were adhered to silicone substrates for 90 min (labeled ‘Adhered’), unadhered cells were removed and adhered cells developed into biofilms for 8, 24 or 48 h. Biofilms were stained with conconavalin A – Alexa 594 and Syto 13 dyes, then imaged by CSLM. Images are maximum intensity projections of the top and side view. Representative images of at least three replicates are shown. Scale bars are 50 μm. See also Figs S4 and 5.
Figure 6
Figure 6
Three new transcription regulators are required for normal biofilm development in vivo in a rat central venous catheter model. The indicated wild type or mutant strains were inoculated into rat intravenous catheters and developed into biofilms for 8, 24 or 48 h prior to visualization by SEM. The left column shows biofilms at 100×; the right column is at 1000×.
Figure 7
Figure 7
The expanded biofilm regulatory network model contains three newly identified regulators. Intergenic region binding data generated for Flo8, Rim101 and Gal4 was combined with binding data for Brg1, Bcr1, Rob1, Efg1, Ndt80 and Tec1 from Nobile et al. (2012) to determine which regulators bind upstream of the genes encoding each of the other regulators. An arrow indicates a binding event of the gene it points to. For example, Gal4 binds upstream of BCR1 and the region upstream of GAL4 is bound by Flo8 and Ndt80.

References

    1. Andes, D. , Nett, J. , Oschel, P. , Albrecht, R. , Marchillo, K. , and Pitula, A. (2004) Development and characterization of an in vivo central venous catheter Candida albicans biofilm model. Infect Immun 72: 6023–6031. - PMC - PubMed
    1. Argimón, S. , Wishart, J.A. , Leng, R. , Macaskill, S. , Mavor, A. , Alexandris, T. , et al (2007) Developmental regulation of an adhesin gene during cellular morphogenesis in the fungal pathogen Candida albicans . Eukaryot Cell 6: 682–692. - PMC - PubMed
    1. Askew, C. , Sellam, A. , Epp, E. , Hogues, H. , Mullick, A. , Nantel, A. , and Whiteway, M. (2009) Transcriptional regulation of carbohydrate metabolism in the human pathogen Candida albicans . PLoS Pathog 5: e1000612. - PMC - PubMed
    1. Baillie, G.S. , and Douglas, L.J. (1999) Role of dimorphism in the development of Candida albicans biofilms. J Med Microbiol 48: 671–679. - PubMed
    1. Bonhomme, J. , and d'Enfert, C. (2013) Candida albicans biofilms: building a heterogeneous, drug‐tolerant environment. Curr Opin Microbiol 16: 398–403. - PubMed

Publication types

MeSH terms

Substances