. 2015 Oct 1;137(7):1539-48.
doi: 10.1002/ijc.29517. Epub 2015 Apr 7.

Non-small cell lung cancer is characterized by dramatic changes in phospholipid profiles

Affiliations

Non-small cell lung cancer is characterized by dramatic changes in phospholipid profiles

Eyra Marien et al. Int J Cancer. .

Abstract

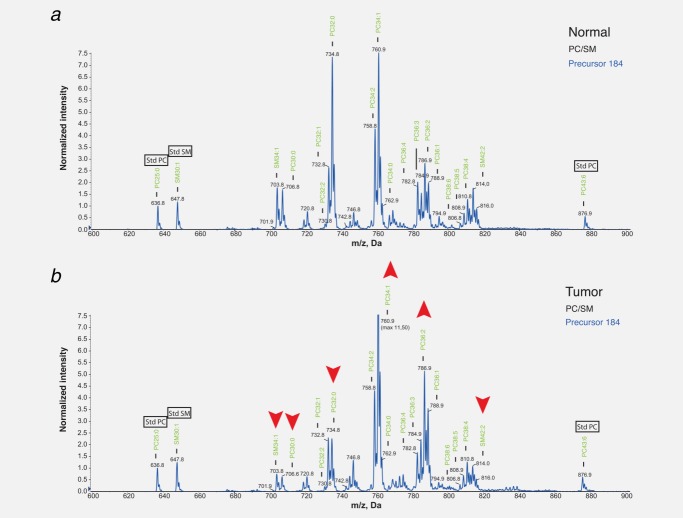
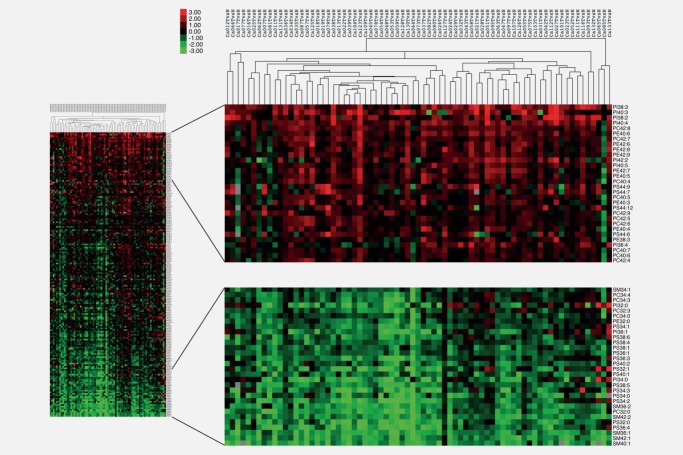
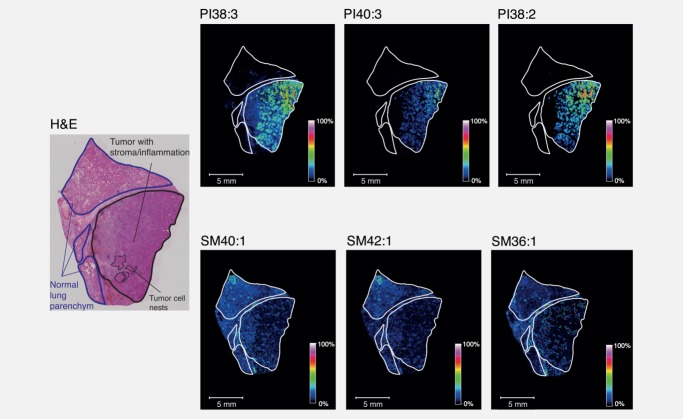
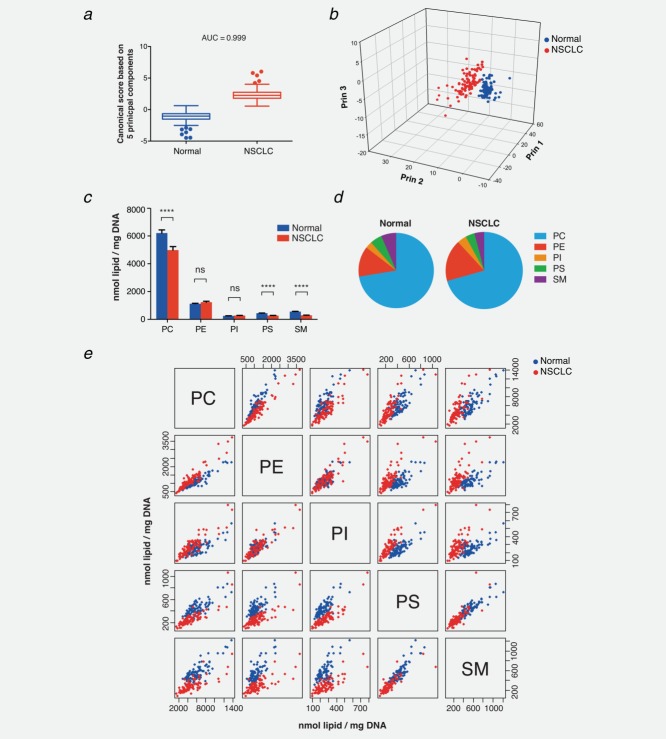
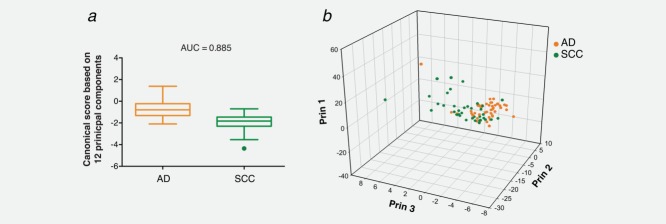
Non-small cell lung cancer (NSCLC) is the leading cause of cancer death globally. To develop better diagnostics and more effective treatments, research in the past decades has focused on identification of molecular changes in the genome, transcriptome, proteome, and more recently also the metabolome. Phospholipids, which nevertheless play a central role in cell functioning, remain poorly explored. Here, using a mass spectrometry (MS)-based phospholipidomics approach, we profiled 179 phospholipid species in malignant and matched non-malignant lung tissue of 162 NSCLC patients (73 in a discovery cohort and 89 in a validation cohort). We identified 91 phospholipid species that were differentially expressed in cancer versus non-malignant tissues. Most prominent changes included a decrease in sphingomyelins (SMs) and an increase in specific phosphatidylinositols (PIs). Also a decrease in multiple phosphatidylserines (PSs) was observed, along with an increase in several phosphatidylethanolamine (PE) and phosphatidylcholine (PC) species, particularly those with 40 or 42 carbon atoms in both fatty acyl chains together. 2D-imaging MS of the most differentially expressed phospholipids confirmed their differential abundance in cancer cells. We identified lipid markers that can discriminate tumor versus normal tissue and different NSCLC subtypes with an AUC (area under the ROC curve) of 0.999 and 0.885, respectively. In conclusion, using both shotgun and 2D-imaging lipidomics analysis, we uncovered a hitherto unrecognized alteration in phospholipid profiles in NSCLC. These changes may have important biological implications and may have significant potential for biomarker development.

Keywords: 2D-imaging MS; lipidomics; mass spectrometry; non-small cell lung cancer; phospholipids.


Figures

Figure 1
Figure 1
Precursor ion scan of phosphocholine-containing phospholipid species in tumor versus matching normal tissue of a representative SCC patient. Lipids were extracted from tumor and normal tissue of a representative SCC patient and were subjected to positive ion ESI-MS/MS analysis in precursor ion m/z 184 scanning mode for the specific detection of phosphocholine-containing phospholipid species. Std refers to the lipid standards. Intensities were normalized to the peak height of standard PC25:0. Red arrows indicate striking differences between the spectra of (b) tumor and (a) matched normal tissue. Major lipid species are annotated.
Figure 2
Figure 2
Changes in absolute abundance of phospholipid species in NSCLC versus matched normal lung tissue. Lipids were extracted from tumor and matched normal tissue from 73 NSCLC patients (discovery set) and were measured using ESI-MS/MS operated in MRM mode. Green squares indicate a decrease in absolute phospholipid abundance while red squares represent an increase as indicated by the scale bar (Log2 of the ratio). Grey squares indicate missing values. Phospholipid species are ranked based on their degree of up or downregulation in tumor compared to normal tissue. Average linkage was used as clustering method. Panels on the right show an enlarged view of the top 30 up and downregulated lipid species.
Figure 3
Figure 3
2D-Imaging MS of the most differentially expressed phospholipids in a representative SCC and adjacent non-malignant tissue. Ion images of the selected molecular ions PI38:3 (m/z 887.5658 0.35 ppm), PI40:3 (m/z 915.5972 0.42 ppm), PI38:2 (m/z 889.5818 0.68 ppm), SM40:1 (m/z 787.6696 1.0 ppm), SM42:1 (m/z 815.7008 0.94 ppm) and SM36:1 (m/z 731.6069 1.0 ppm) are shown. Color intensities vary between 0 and 100% as indicated by the scale bars. H&E staining of a next tissue section is shown. Normal tissue, tumor tissue with stroma/inflammation, and tumor cell nests are indicated. Note that not all tumor cell nests are indicated, but some are circled as examples.
Figure 4
Figure 4
Phospholipid profiles discriminate NSCLC versus normal tissues and differential representation of phospholipid headgroup classes in NSCLC tissues versus normal tissues. (a) Phospholipid profiles from the discovery set were subjected to PCA analysis followed by LDA to distinguish NSCLC and normal tissues based on the PCA scores. The result of the PCA-LDA on the discovery set (more specifically, the canonical score from the LDA based on a specific number of principal component scores) was validated on the data in the validation set. Graph shows a validation boxplot of the canonical scores based on the solution with the lowest cross-validated misclassification error for the discovery set, that is, 5 principal components (Supporting Information Fig. S2a), to discriminate NSCLC versus normal tissues. (b) 3D-scatter plot of the principal component scores in the validation set (based on the weights from the discovery set) illustrating the discrimination between NSCLC and normal tissue. (c) Phospholipid species in tumor and normal tissues from 89 NSCLC patients (validation set) were summed per headgroup class (PC, PE, PI, PS and SM). Graph displays the abundance (nmol lipid/mg DNA) of different headgroup classes. Data represent mean ± standard error. **** < 0.0001; ns = not significant (MWU). (d) Pie charts showing relative representation of phospholipid head group classes in normal and NSCLC tissues. (e) Scatter plots for the abundance (nmol lipid/mg DNA) for all pairs of phospholipid headgroup classes. Relations based on 178 samples (89 NSCLC tissues in red and 89 normal tissues in blue) for any pair of PC, PE, PI, PS and SM.
Figure 5
Figure 5
Phospholipid profiles discriminate AD versus SCC tumors. (a) Phospholipid profiles from the discovery set were subjected to PCA analysis followed by LDA to distinguish both subtypes based on the PCA scores. The result of the PCA-LDA on the discovery set (more specifically, the canonical score from the LDA based on a specific number of principal component scores) was validated on the data in the validation set. Graph shows a validation boxplot of the canonical scores based on the solution with the lowest cross-validated misclassification error for the discovery set, that is, 12 principal components (Supporting Information Fig. S2b), to discriminate AD versus SCC tumors. (b) 3D-scatter plot of the principal component scores in the validation set (based on the weights from the discovery set) illustrating the discrimination between NSCLC subtypes.

Similar articles

Cited by

References

    1. Globocan; Available at. In: Cancer IAfRo, ed., 2012. http://globocan.iarc.fr/. (Accessed on: Sept 30, 2014)
    1. Zhang Q, Li H, Jin H, et al. The global landscape of intron retentions in lung adenocarcinoma. BMC Med Genomics. 2014;7:15. - PMC - PubMed
    1. Tan DS, Camilleri-Broet S, Tan EH. Intertumor heterogeneity of non-small-cell lung carcinomas revealed by multiplexed mutation profiling and integrative genomics. 2014;135:1092–100. , et al. Int J Cancer. - PubMed
    1. Lazar V, Suo C, Orear C, et al. Integrated molecular portrait of non-small cell lung cancers. BMC Med Genomics. 2013;6:53. - PMC - PubMed
    1. Zhang L, Zhang W, Chen K. Search for cancer risk factors with microarray-based genome-wide association studies. Technol Cancer Res Treat. 2010;9:107–21. - PubMed

Publication types

MeSH terms