. 2015 May 8;290(19):11890-904.
doi: 10.1074/jbc.M115.639096. Epub 2015 Mar 17.

A Residue Quartet in the Extracellular Domain of the Prolactin Receptor Selectively Controls Mitogen-activated Protein Kinase Signaling

Affiliations

A Residue Quartet in the Extracellular Domain of the Prolactin Receptor Selectively Controls Mitogen-activated Protein Kinase Signaling

Chi Zhang et al. J Biol Chem. .

Abstract

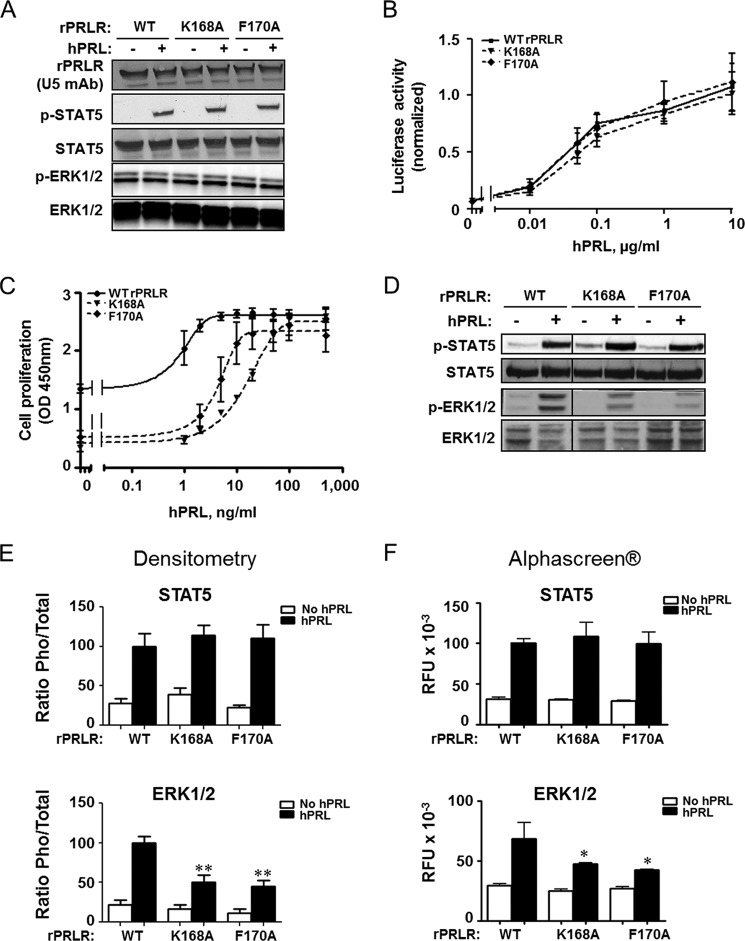
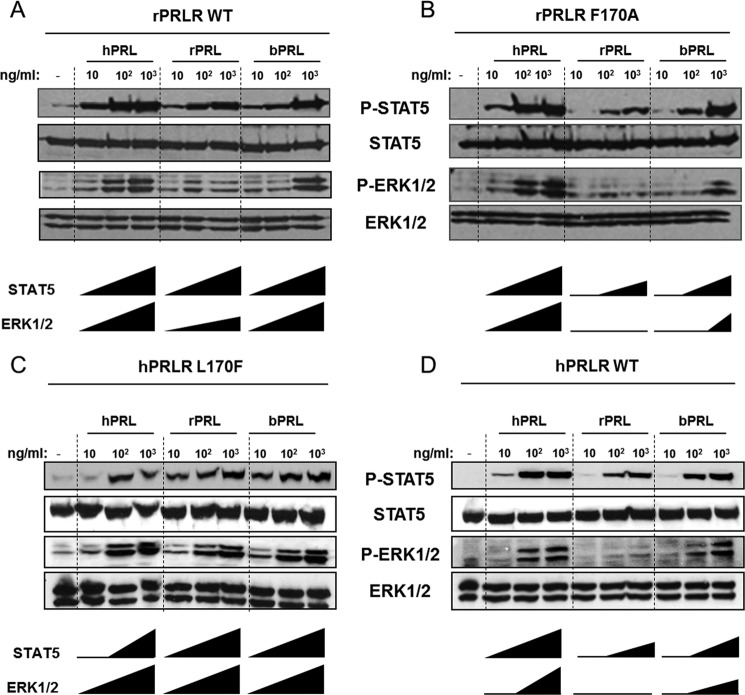
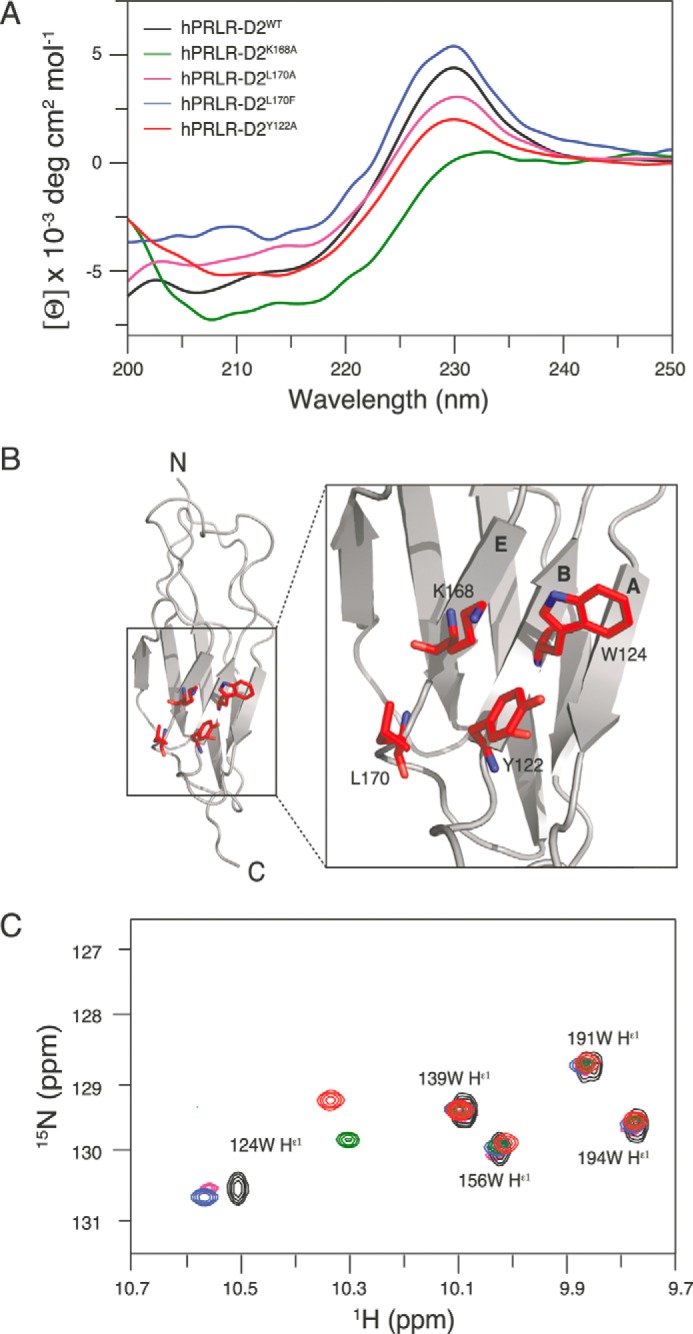
Cytokine receptors elicit several signaling pathways, but it is poorly understood how they select and discriminate between them. We have scrutinized the prolactin receptor as an archetype model of homodimeric cytokine receptors to address the role of the extracellular membrane proximal domain in signal transfer and pathway selection. Structure-guided manipulation of residues involved in the receptor dimerization interface identified one residue (position 170) that in cell-based assays profoundly altered pathway selectivity and species-specific bio-characteristics. Subsequent in vitro spectroscopic and nuclear magnetic resonance analyses revealed that this residue was part of a residue quartet responsible for specific local structural changes underlying these effects. This included alteration of a novel aromatic T-stack within the membrane proximal domain, which promoted selective signaling affecting primarily the MAPK (ERK1/2) pathway. Importantly, activation of the MAPK pathway correlated with in vitro stabilities of ternary ligand·receptor complexes, suggesting a threshold mean lifetime of the complex necessary to achieve maximal activation. No such dependence was observed for STAT5 signaling. Thus, this study establishes a residue quartet in the extracellular membrane proximal domain of homodimeric cytokine receptors as a key regulator of intracellular signaling discrimination.

Keywords: Cell Proliferation; Cell Surface Receptor; Cytokine; Extracellular Signal-regulated Kinase (ERK); Nuclear Magnetic Resonance (NMR); STAT Transcription Factor.


Figures

FIGURE 1.
FIGURE 1.
PRLR homodimer interface (site 3). A, representation of the 2:1 rPRLR·hPRL complex structure (PDB accession code 3NPZ) (25). The two receptors (rPRLR1 and rPRLR2) are shown in gray, and their D1 and D2 domains are labeled in light and dark blue, respectively, and hPRL is shown in pale cyan. The three intermolecular interaction sites are indicated in the structure (sites 1 and 2 between hPRL and the receptor and site 3 between the two receptors). B, magnification of site 3 with blue sticks (light blue on rPRLR1 and dark blue on rPRLR2) identifying interacting residues at the interface, which are at focus in the current work. The A to G strands are identified (see Ref. , for structural details).
FIGURE 2.
FIGURE 2.
Bioactivity of rPRLR interface variants in HEK293 and Ba/F3 cells. A, HEK293 cells transiently transfected with expression vectors encoding rPRLRWT or rPRLR variants were starved and then stimulated with 1 μg/ml hPRL (15 min). Total PRLR (U5 mAb), phosphorylated and total STAT5 (from the same gel), and phosphorylated and total ERK1/2 (from a different gel) were analyzed by immunoblotting. B, HEK293 cells were transiently co-transfected using expression vectors encoding rPRLRWT or rPRLR variants, and the LHRE-luciferase reporter plasmid. For each variant, the luciferase values obtained at varying PRL concentrations were normalized to the unstimulated condition for comparison (means ± S.E., n = 3 in triplicate). C, stable populations of Ba/F3 cells expressing rPRLRWT or rPRLR variants were obtained and selected as described in the text and Table 1. Proliferation of populations 2 in response to a range of hPRL concentrations was measured (WST-1 reagent) in three independent experiments performed in triplicate (mean ± S.E.). D, starved cells were treated using 1 μg/ml hPRL (15 min), then analyzed for phosphorylated and total STAT5 (upper), and ERK1/2 (lower) by immunoblotting (two noncontiguous parts from the same immunoblot are shown and separated by a dividing line). E, densitometric analysis of STAT5 and ERK1/2 activation was averaged from five separate immunoblotting experiments. The phosphorylated/total ratio obtained in Ba/F3-rPRLRWT cells stimulated with hPRL was set to 100% (mean ± S.E.). F, basal and stimulated levels of STAT5 and ERK1/2 activation were determined using semi-quantitative SureFire® homogeneous assays (AlphaScreen® technology, n = 3). E and F, stimulated conditions were compared by one-way ANOVA. p values are represented by asterisks, using *, p < 0.05; **, p < 0.01.
FIGURE 3.
FIGURE 3.
Residue 170 at the PRLR interface directs signaling cascade selectivity. A, basal proliferation of Ba/F3-hPRLRWT (population 2), Ba/F3-hPRLRL170F (population 3), and parental Ba/F3 cells in growth medium (10% FCS, no PRL added) was monitored using WST-1 reagent. Values (means ± S.E., n = 3 in triplicates) were compared by two-way ANOVA. p values are represented as follows: **, p < 0.01; ***, p < 0.001. B, starved Ba/F3-hPRLRWT and Ba/F3-hPRLRL170F cells were treated with 1 or 10% FCS or 1 μg/ml hPRL, rPRL, or bPRL for 15 min. Phosphorylated versus total STAT5 and ERK1/2 were analyzed by immunoblotting. C, basal phosphorylation of STAT5 in Ba/F3-hPRLRL170F observed in 10% FCS growth medium was inhibited in a time-dependent manner by the addition of the pure PRLR antagonist Del1–9-G129R-hPRL (5 μg/ml). D, densitometric quantification of ERK1/2 activation in Ba/F3-rPRLRWT and Ba/F3-rPRLRL170F in response to PRL of human, rat, or bovine origin is shown. Values were normalized to the phosphorylated/total ratio obtained in Ba/F3-hPRLRWT cells stimulated with hPRL (mean ± S.E.) and compared by two-way ANOVA. NS, not significant.
FIGURE 4.
FIGURE 4.
Position 170 directs species specificity and signaling selectivity. Ba/F3 cells stably expressing rPRLRWT (A), rPRLRF170A (B), hPRLRL170F (C), or hPRLRWT (D) were stimulated for 15 min with various concentrations of PRL of human, rat, or bovine origin, and activation of ERK1/2 and STAT5 pathways was monitored. The qualitative profile of responsiveness of each cascade to the various stimulations is schematized below each panel by black triangles.
FIGURE 5.
FIGURE 5.
Substituting residue 170 alters cell surface expression and degradation profile of the PRLR. A, representative FACS profile of Ba/F3-rPRLRWT cells incubated with unlabeled hPRL (background fluorescence, orange) or hPRLfluo (PRLR-binding fluorescence, cyan). Displacement of the curve obtained when hPRLfluo was competed with 3.5 molar excess of unlabeled hPRL assessed the specificity of the hPRLfluo signal (blue). B, specific binding for the four Ba/F3 cell populations was calculated as the difference between FACS values obtained with hPRL and hPRLfluo as described in A. C, degradation profiles of rPRLR and hPRLR (WT and variants, as indicated) stably expressed in Ba/F3 cells cultured in growth medium. Membranes were blotted using antibodies directed against the hPRLR-ICD (H300) or the rPRLR-ECD (U5). Arrowheads show PRLR-related bands (full-length or degraded) and asterisks indicate nonspecific bands that were identified using parental Ba/F3 cells (Par.) lacking endogenous PRLR. D, same Ba/F3 cell populations as above were starved for 5 h and then stimulated with hPRL (1 μg/ml, 15 min) before the degradation profiles of the various PRLRs were analyzed as described in C.
FIGURE 6.
FIGURE 6.
Real time SPR characterization of site 2 + 3 interactions involving hPRLR-ECDs. hPRLR-ECDWT (A) or hPRLR-ECDL170F (B) were immobilized on a nickel-nitrilotriacetic acid surface and saturated with PRL (250 nm) as described under “Experimental Procedures.” Representative sensorgrams corresponding to the injection of hPRLR-ECDWT (81 μm; blue) or hPRLR-ECDL170F (63.6 μm; red) onto preformed 1:1 complexes are shown. C and D, PRLR-ECD2 concentration dependence of the steady-state SPR responses, from which the Kd values were determined (see Table 3), is shown for all complexes investigated (n = 2 experiments) as follows: C, hPRLR-ECDWT/hPRLR-ECDWT (blue) and hPRLR-ECDL170F/hPRLR-ECDWT (red); D, hPRLR-ECDWT/hPRLR-ECDL170F (blue) and hPRLR-ECDL170F/hPRLR-ECDL170F (red).
FIGURE 7.
FIGURE 7.
Conformational stability of rPRLR-ECD and hPRLR-D2 variants. The conformational stability of rPRLR-ECD (A) and hPRLR-D2 WT (B) and variants was measured by intrinsic fluorescence emission and normalized to the fraction of-folded protein. A: circle, rPRLR-ECDWT; triangle, rPRLR-ECDK168A; diamond, rPRLR-ECDF170A. The best fits to two-state unfolding are shown as solid line (rPRLR-ECDWT), dashed line (rPRLR-ECDK168A), or dotted line (rPRLR-ECDF170A). B: circle, hPRLR-D2WT; square, hPRLR-D2L170F; triangle, hPRLR-D2F170A. The best fits to two-state unfolding are shown as a solid line (hPRLR-D2WT), dashed line (hPRLR-D2L170F), or dotted line (hPRLR-D2L170A).
FIGURE 8.
FIGURE 8.
Structural analyses of the human D2 domains of PRLR interface variants. A, far-UV CD spectra of hPRLR-D2WT and variants. A large positive ellipticity was observed at ∼230 nm for hPRLR-D2WT (black), hPRLR-D2L170A (magenta), and hPRLR-D2L170F (blue) originating from the exciton coupling of the WS motif, although it was almost nonexistent for hPRLR-D2K168A (green). The residual exciton coupling from the WS motif was still present in hPRLR-D2Y122A (red). B, positions of Lys-168, Leu-170, Tyr-122, and Trp-124 in the solution structure of unbound hPRLR-D2WT (gray, PDB accession code 2LFG) are shown as red sticks on the zoom-in. Nitrogen atoms are shown in blue. The A, B, and E strands are indicated on the structure. C, overlay of the Trp indole region of the 1H, 15N HSQC spectra of hPRLR-D2WT (black), hPRLR-D2K168A (green), hPRLR-D2Y122A (red), hPRLR-D2L170A (magenta), and hPRLR-D2L170F (blue). Only small changes in chemical shifts were seen for residues Trp-139, Trp-156, Trp-194, and Trp-191 located in the WS motif. In contrast, the chemical shifts of the Trp-124 indole were significantly changed for all variants.
FIGURE 9.
FIGURE 9.
Chemical shift analyses of hPRLR-D2 variants. Comparison of the combined amide proton and nitrogen chemical shift differences for hPRLR-D2WT and hPRLR-D2K168A (A), hPRLR-D2L170A (B), and hPRLR-D2L170F (C) are shown. Each substitution site is identified by black arrowheads; prolines and unassigned residues are marked with red dots. The vertical gray bars indicate the A-G strands, the red bar locates the WS motif, and the asterisks identify residues Tyr-122 and Trp-124. The horizontal red line represents the trimmed average chemical shift difference (AVG), and the dotted line the trimmed average plus 1 S.D. (AVG+1σ). Residues with chemical shift differences higher than the trimmed average plus 1 S.D. are marked in red on the structure of unbound hPRLR-D2WT (PDB accession code 2LFG). Residues more than 5 Å of the substituted residue are shown in red sticks. The substituted residues are shown as red space-filling atoms; the green bars indicate regions with chemical shift changes above average plus 1 S.D. and include the A-B strand and loop as well as the C terminus.
FIGURE 10.
FIGURE 10.
Model of signaling pathway activation as a function of ligand·receptor complex lifetime. For STAT5 activation, the WT lifetimes in this work are within the dynamic range, whereas for MAPK activation, the WT lifetimes are within the regulatory range (see “Discussion” for explanations). This could explain the intrinsically higher MAPK activation by the rat receptor and the modulation observed by the hot spot receptor variants. Likewise, because affinities leading to maximal STAT5 activation are far within the dynamic range, no effects of substitutions on activity were observed. The different PRLR variants examined are indicated in the figure according to the provided legend.

Similar articles

References

    1. Karnitz L. M., Abraham R. T. (1995) Cytokine receptor signaling mechanisms. Curr. Opin. Immunol. 7, 320–326 - PubMed
    1. Chang F., Steelman L. S., Lee J. T., Shelton J. G., Navolanic P. M., Blalock W. L., Franklin R. A., McCubrey J. A. (2003) Signal transduction mediated by the Ras/Raf/MEK/ERK pathway from cytokine receptors to transcription factors: potential targeting for therapeutic intervention. Leukemia 17, 1263–1293 - PubMed
    1. Stark G. R., Darnell J. E., Jr. (2012) The JAK-STAT pathway at twenty. Immunity 36, 503–514 - PMC - PubMed
    1. Piehler J., Thomas C., Garcia K. C., Schreiber G. (2012) Structural and dynamic determinants of type I interferon receptor assembly and their functional interpretation. Immunol. Rev. 250, 317–334 - PMC - PubMed
    1. Li W., Lan H., Liu H., Fu Z., Yang Y., Han W., Guo F., Liu Y., Zhang H., Liu J., Zheng X. (2013) The activation and differential signalling of the growth hormone receptor induced by pGH or anti-idiotypic monoclonal antibodies in primary rat hepatocytes. Mol. Cell. Endocrinol. 376, 51–59 - PubMed

Publication types

LinkOut - more resources