. 2015 Mar 3:9:61.
doi: 10.3389/fncel.2015.00061. eCollection 2015.

Fluoxetine induces alkalinization of astroglial cytosol through stimulation of sodium-hydrogen exchanger 1: dissection of intracellular signaling pathways

Affiliations

Fluoxetine induces alkalinization of astroglial cytosol through stimulation of sodium-hydrogen exchanger 1: dissection of intracellular signaling pathways

Jienan Ren et al. Front Cell Neurosci. .

Abstract

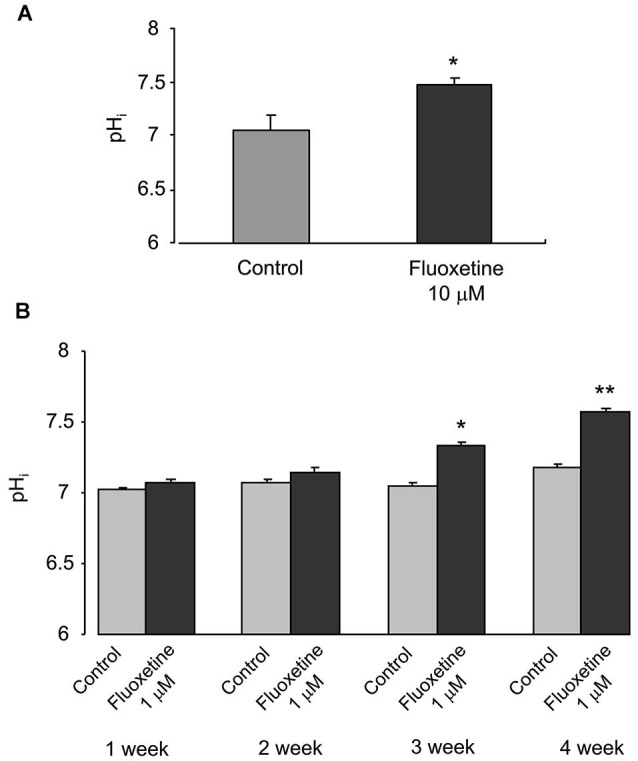
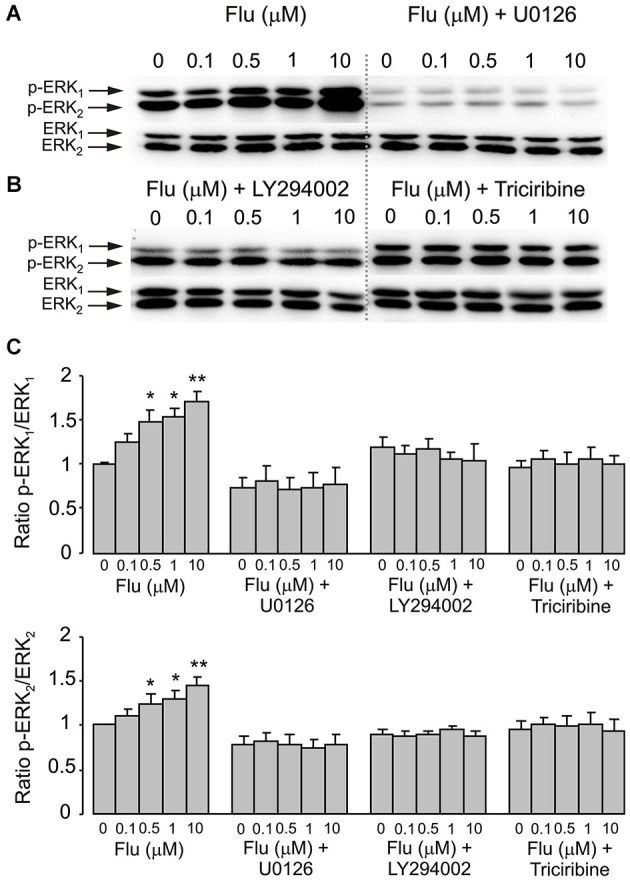
Clinical evidence suggest astrocytic abnormality in major depression (MD) while treatment with anti-psychotic drugs affects astroglial functions. Astroglial cells are involved in pH homeostasis of the brain by transporting protons (through sodium-proton transporter 1, NHE1, glutamate transporters EAAT1/2 and proton-lactate co-transporter MCT1) and bicarbonate (through the sodium-bicarbonate co-transporter NBC or the chloride-bicarbonate exchanger AE). Here we show that chronic treatment with fluoxetine increases astroglial pH i by stimulating NHE1-mediated proton extrusion. At a clinically relevant concentration of 1 μM, fluoxetine significantly increased astroglial pH i from 7.05 to 7.34 after 3 weeks and from 7.18 to 7.58 after 4 weeks of drug treatment. Stimulation of NHE1 is a result of transporter phosphorylation mediated by several intracellular signaling cascades that include MAPK/ERK1/2, PI3K/AKT and ribosomal S6 kinase (RSK). Fluoxetine stimulated phosphorylation of ERK1/2, AKT and RSK in a concentration dependent manner. Positive crosstalk exists between two signal pathways, MAPK/ERK1/2 and PI3K/AKT activated by fluoxetine since ERK1/2 phosphrylation could be abolished by inhibitors of PI3K, LY294002 and AKT, triciribine, and AKT phosphorylation by inhibitor of MAPK, U0126. As a result, RSK phosphorylation was not only inhibited by U0126 but also by inhibitor of LY294002. The NHE1 phoshorylation resulted in stimulation of NHE1 activity as revealed by the NH4Cl-prepulse technique; the increase of NHE1 activity was dependent on fluoxetine concentration, and could be inhibited by both U0126 and LY294002. Our findings suggest that regulation of astrocytic pH i and brain pH may be one of the mechanisms underlying fluoxetine action.

Keywords: AKT; ERK1/2; NHE1; astrocytes; fluoxetine; pHi.


Figures

Figure 1
Figure 1
Chronic treatment with fluoxetine increases pHi in primary cultured astrocytes. (A) The pHi values measured in control cells or in cells treated with 10 μM fluoxetine for 3 days. All results are means of 32 cells from 3 coverslips. SEM values are indicated by vertical bars. *Indicates statistically significant (P < 0.05) difference from control group. (B) The pHi values were measured from control cells and cells treated with 1 μM fluoxetine for 1, 2, 3 or 4 weeks. All results are means of 114 to 178 cells from 6 to 9 coverslips (1 week: control, n = 156 cells from 8 separate coverslips; fluoxetine, n = 178 cells from 9 coverslips. 2 week: control, n = 167 cells from 9 separate coverslips; fluoxetine, n = 119 cells from 6 coverslips. 3 week: control, n = 134 cells from 7 separate coverslips; fluoxetine, n = 165 cells from 8 coverslips. 4 week: control, n = 114 cells from 6 separate coverslips; fluoxetine, n = 153 cells from 8 coverslips.). SEM values are indicated by vertical bars. *Indicates statistically significant (P < 0.05) difference from control group at the same treatment period; **Significant (P < 0.05) difference from all other groups.
Figure 2
Figure 2
Acute effect of fluoxetine on phosphorylation of NHE1. (A) Cells were incubated with 10 μM fluoxetine for 0 (Control), 0.5, 1, 5, 10, 20, 40 or 60 min. Top: Immunoblots from representative experiments. Bands of 105 kDa represent p-NHE1. Similar results were obtained from three independent experiments. Bottom: Average NHE1 phosphorylation was quantified as scanned band intensity of NHE1 and normalized vs. band intensity from the control group. SEM values are indicated by vertical bars. *Indicates statistically significant (P < 0.05) difference from control, 0.5, 1, 20 and 40 min groups. **Indicates statistically significant (P < 0.05) difference from control, 0.5, 1, 5, 10, and 60 min groups. (B) Cells were incubated with 0 (Control) or 1 μM fluoxeine for 20 min. Left: Immunoblots from representative experiments. Bands of 105 kDa represent p-NHE1. Similar results were obtained from five independent experiments. Right: Average NHE1 phosphorylation was quantified as scanned band intensity of NHE1 and normalized vs. band intensity from the control group. SEM values are indicated by vertical bars. *Indicates statistically significant (P < 0.05) difference from control group.
Figure 3
Figure 3
ERK1/2 phosphorylation induced by fluoxetine requires MEK and AKT phosphorylation. (A,B) Immunoblots from representative experiments. (A) after pre-treatment in serum-free medium with or without 10 μM of MEK inhibitor U0126, 25 μM of PI3K inhibitor LY294002 or 10 μM of AKT inhibitor triciribine (B) for 15 min, cells were incubated for 20 min with 0 (Control), 0.1, 0.5, 1, 10 μM fluoxetine. Bands of 44 and 42 kDa represent p-ERK1 (phosphorylated ERK1) and p-ERK2 (phosphorylated ERK2), respectively (upper rows), or total ERK1 and ERK2 (lower rows). Similar results were obtained from five independent experiments. (C) Average ERK phosphorylation was quantified as ratios between p-ERK1 and ERK1 (Top) and between p-ERK2 and ERK2 (Bottom). Ratios between p-ERK1 and ERK1 or p-ERK2 and ERK2 were normalized to the control. SEM values are indicated by vertical bars. *Indicates statistically significant (P < 0.05) difference from control group, 0.1 and 10 μM fluoxetine groups and fluoxetine plus U0126, LY294002 or triciribine groups. **Indicates statistically significant (P < 0.05) difference from all other groups.
Figure 4
Figure 4
AKT phosphorylation induced by fluoxetine requires MEK and PI3K phosphorylation. (A) After pretreatment in serum-free medium with or without 10 μM of MEK inhibitor U0126 for 15 min, cells were incubated for 20 min with 0 (Control), 0.1, 0.5, 1, 10 μM fluoxetine. Top: Immunoblots from representative experiments. Bands of 60 kDa represent p-AKT (Ser473) (upper rows), or total AKT (lower rows). Similar results were obtained in five independent experiments. Bottom: Average AKT phosphorylation was quantified as ratios between p-AKT and AKT and normalized to controls. SEM values are indicated by vertical bars. *Indicates statistically significant (P < 0.05) difference from control group, 0.1 and 0.5 μM fluoxetine groups and fluoxetine plus U0126 groups. (B) After pretreatment in serum-free medium with or without 25 μM of PI3K inhibitor LY294002 for 15 min, cells were incubated for 20 min with 0 (Control), 0.1, 0.5, 1, 10 μM fluoxetine. Top: Immunoblots from representative experiments. Bands of 60 kDa represent p-AKT (Ser473) (upper rows), or total AKT (lower rows). Similar results were obtained in five independent experiments. Bottom: Average AKT phosphorylation was quantified as ratios between p-AKT and AKT and normalized to controls. SEM values are indicated by vertical bars. *Indicates statistically significant (P < 0.05) difference from control group, 0.1 and 0.5 μM fluoxetine groups and fluoxetine plus LY294002 groups.
Figure 5
Figure 5
RSK phosphorylation induced by fluoxetine requires MEK and PI3K phosphorylation. After pretreatment in serum-free medium with or without 10 μM of MEK inhibitor U0126 or 25 μM of PI3K inhibitor LY294002 for 15 min, cells were incubated for 20 min with 0 (Control), 1, 10 μM fluoxetine. (A) Immunoblots from representative experiments. Bands of 90 and 46 kDa represent p-RSK (phosphorylated RSK) (upper row) and β-actin (lower row), respectively. Similar results were obtained in four independent experiments. (B) Average RSK phosphorylation was quantitated as ratios between p-RSK and β-actin and normalized to controls. SEM values are indicated by vertical bars. *Indicates statistically significant (P < 0.05) difference from all other groups.
Figure 6
Figure 6
Acute effect of fluoxetine on recovery of pHi from an acid load in primary cultured of astrocytes, which were exposed to 20 mM NH4Cl for 2 min. (A) A representative experiment showing recovery of pHi after 20 min of incubation with 0 (control; diamonds), 0.1 (squares), 0.5 (triangles), 1 (asterisks) or 10 μM (circles) fluoxetine. (B) Recovery of pHi is presented as ΔpHi/Δt. All results are means of ΔpHi/Δt of 60 to 120 cells from 4 to 6 coverslips (control, n = 99 cells from 5 separate coverslips; 0.1 μM fluoxetine, n = 77 cells from 4 coverslips; 0.5 μM fluoxetine, n = 60 cells from 4 separate coverslips; 1 μM fluoxetine, n = 72 cells from 6 separate coverslips; 10 μM fluoxetine, n = 120 cells from 6 separate coverslips). SEM values are indicated by vertical bars. *Indicates statistically significant (P < 0.05) difference from control, 0.1 and 10 μM groups; **Significant (P < 0.05) difference from all other groups. (C) After pretreatment with or without 200 nM of 5-HT2B receptor antagonist SB204741, 10 μM of MEK inhibitor U0126 or 25 μM of PI3K inhibitor LY294002 for 15 min, cells were incubated for 20 min with 0 (Control), 1, 10 μM fluoxetine. Recovery of pHi is presnetd as ΔpHi/Δt. All results are means of ΔpHi/Δt of 36 to 90 cells from 3 to 5 coverslips (control, n = 90 cells from 5 separate coverslips; 1 μM fluoxetine, n = 90 cells from 5 separate coverslips; 10 μM fluoxetine, n = 90 cells from 5 separate coverslips; SB204741, n = 58 cells from 3 separate coverslips; SB204741 plus 1 μM fluoxetine, n = 75 cells from 4 separate coverslips; SB204741 plus 10 μM fluoxetine, n = 65 cells from 3 separate coverslips; U0126, n = 43 cells from 3 separate coverslips; U0126 plus 1 μM fluoxetine, n = 48 cells from 3 separate coverslips; U0126 plus 10 μM fluoxetine, n = 36 cells from 3 separate coverslips; LY294002, n = 82 cells from 5 separate coverslips; LY294002 plus 1 μM fluoxetine, n = 82 cells from 5 separate coverslips; LY294002 plus 10 μM fluoxetine, n = 88 cells from 5 separate coverslips). SEM values are indicated by vertical bars. *Indicates statistically significant (P < 0.05) difference from all other groups.
Figure 7
Figure 7
Possible signaling cascades mediating fluoxetine-induced stimulation of ptoron transport in astrocytes. Fluoxetine acts as an agonist at 5-HT2B receptor. Stimulation of 5-HT2B receptor activates phospholipase C (PLC), generating diacylglycerol (DAG) and inositol 1,4,5-trisphosphate (IP3) and leading to an increase of free cytosolic calcium concentration and stimulation of matrix metalloproteinases (MMPs), which in turn induced transactivation of EGF receptors. The activation of EGF receptor stimulates MAPK/ERK and PI3K/AKT signaling cascades with a positive feedback loop existing between these two pathways. Ninety-kDa ribosomal S6 kinase (RSK or p90RSK), downstream of ERK can increase the activity of NHE1 by phosphorylation of Ser-703.

Similar articles

Cited by

References

    1. Anders J. J. (1988). Lactic acid inhibition of gap junctional intercellular communication in in vitro astrocytes as measured by fluorescence recovery after laser photobleaching. Glia 1, 371–379. 10.1002/glia.440010604 - DOI - PubMed
    1. Anjum R., Blenis J. (2008). The RSK family of kinases: emerging roles in cellular signalling. Nat. Rev. Mol. Cell Biol. 9, 747–758. 10.1038/nrm2509 - DOI - PubMed
    1. Barley K., Dracheva S., Byne W. (2009). Subcortical oligodendrocyte- and astrocyte-associated gene expression in subjects with schizophrenia, major depression and bipolar disorder. Schizophr. Res. 112, 54–64. 10.1016/j.schres.2009.04.019 - DOI - PubMed
    1. Boedtkjer E., Bunch L., Pedersen S. F. (2012). Physiology, pharmacology and pathophysiology of the pH regulatory transport proteins NHE1 and NBCn1: similarities, differences and implications for cancer therapy. Curr. Pharm. Des. 18, 1345–1371. 10.2174/138161212799504830 - DOI - PubMed
    1. Boron W. F., De Weer P. (1976). Active proton transport stimulated by CO2/HCO3−, blocked by cyanide. Nature 259, 240–241. 10.1038/259240a0 - DOI - PubMed