. 2015 Mar 2:9:21.
doi: 10.3389/fnsys.2015.00021. eCollection 2015.

Stronger efferent suppression of cochlear neural potentials by contralateral acoustic stimulation in awake than in anesthetized chinchilla

Affiliations

Stronger efferent suppression of cochlear neural potentials by contralateral acoustic stimulation in awake than in anesthetized chinchilla

Cristian Aedo et al. Front Syst Neurosci. .

Abstract

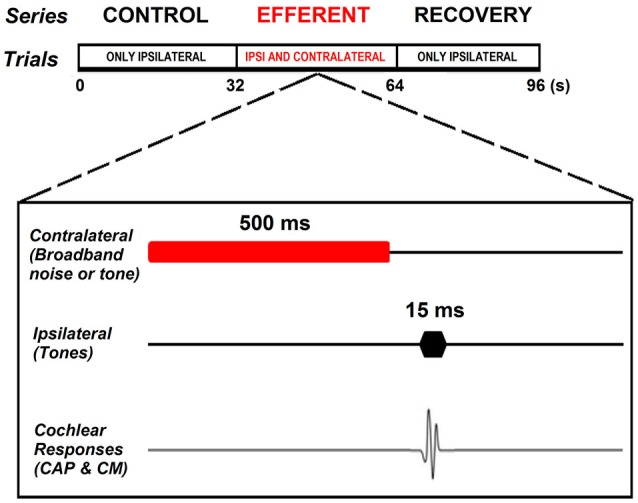
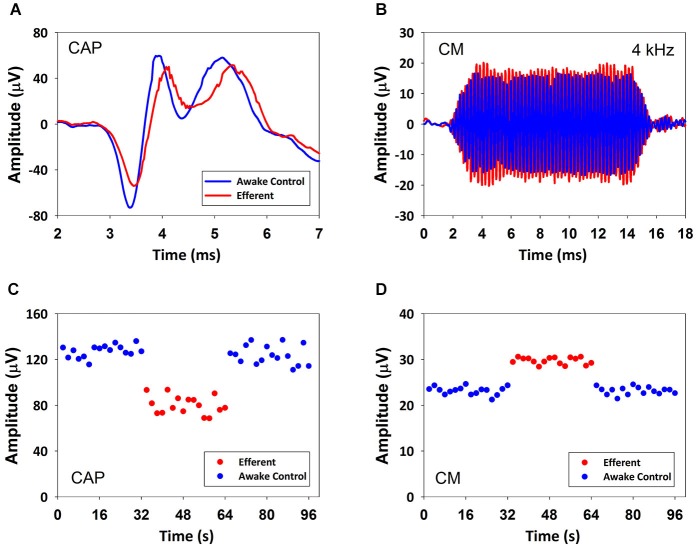
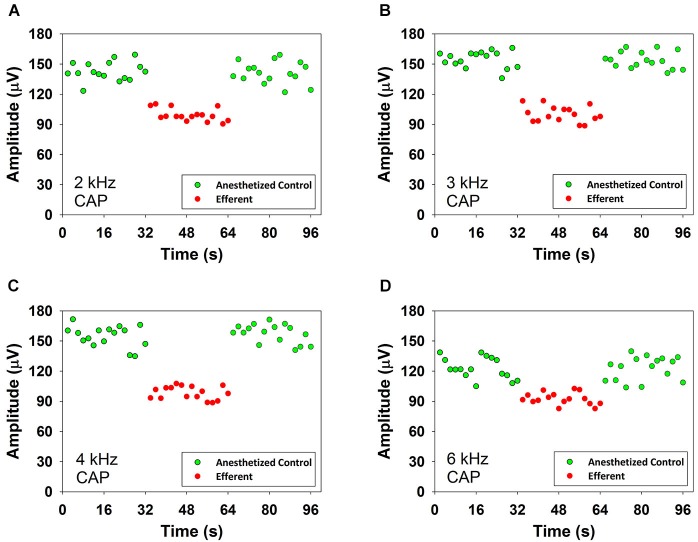
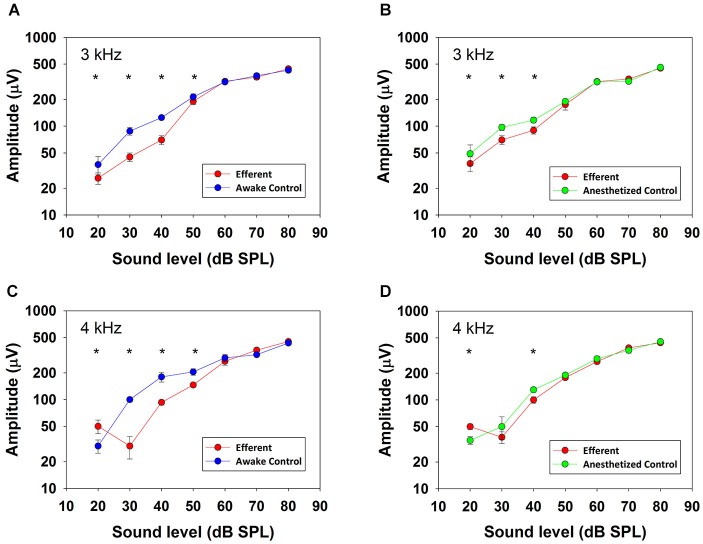
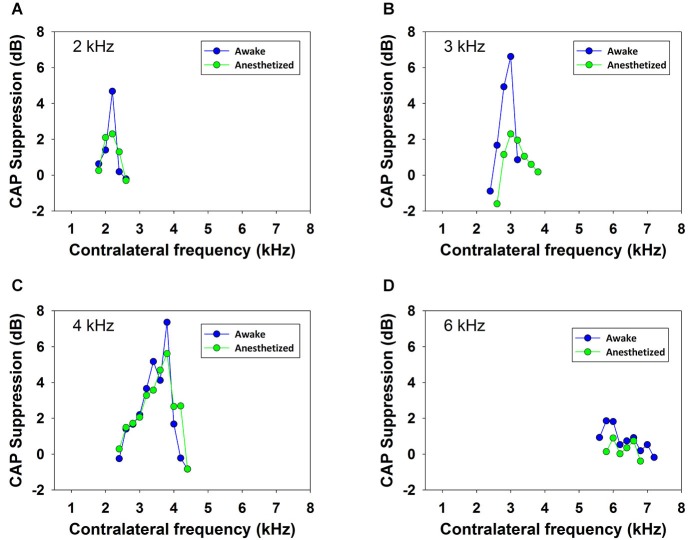
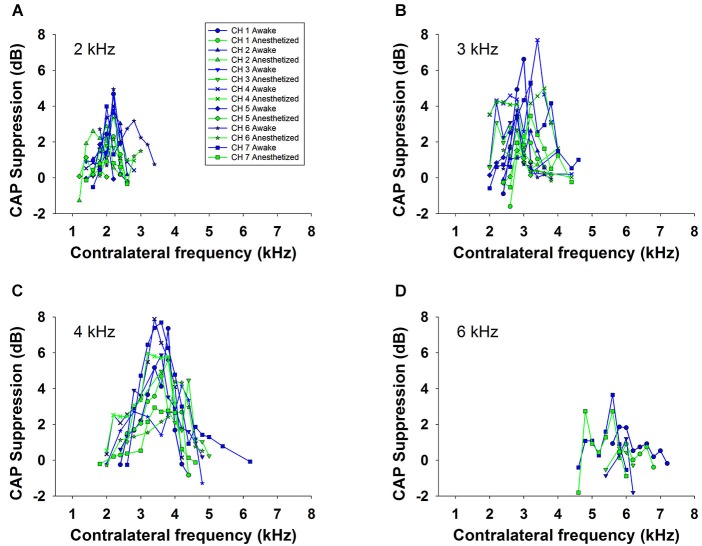
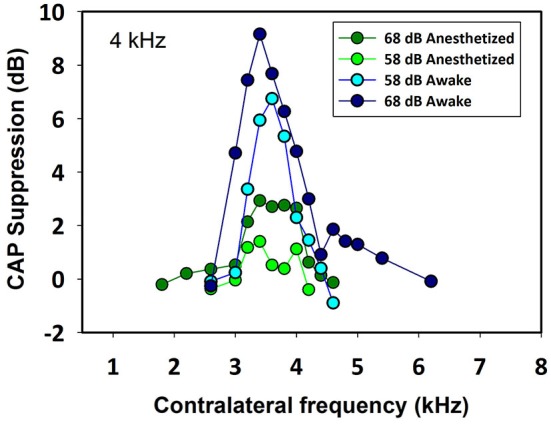
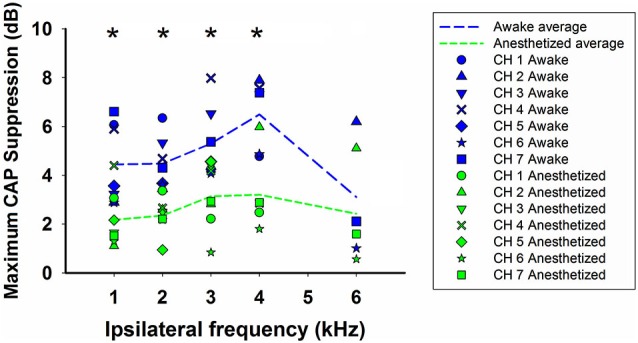
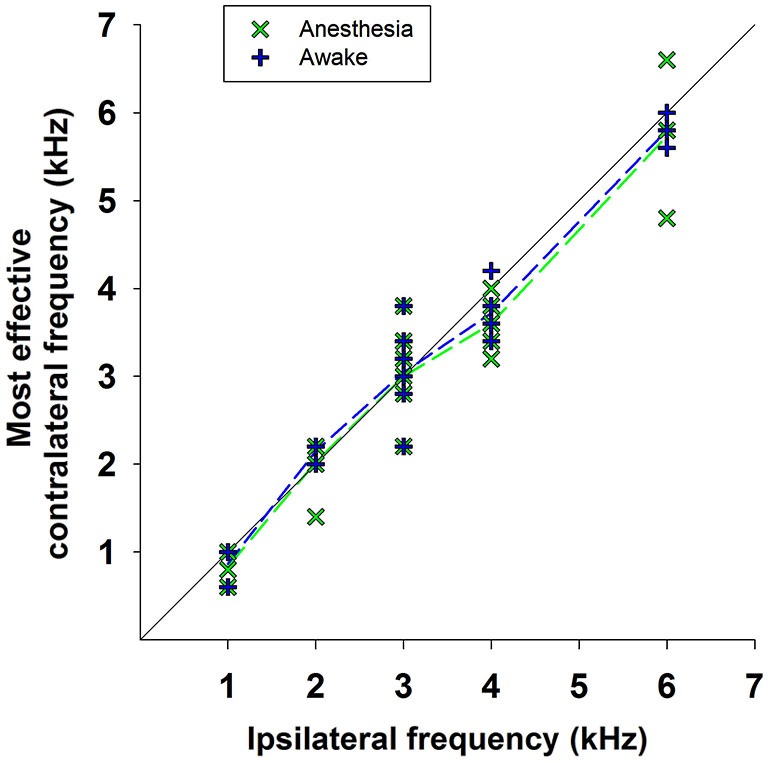
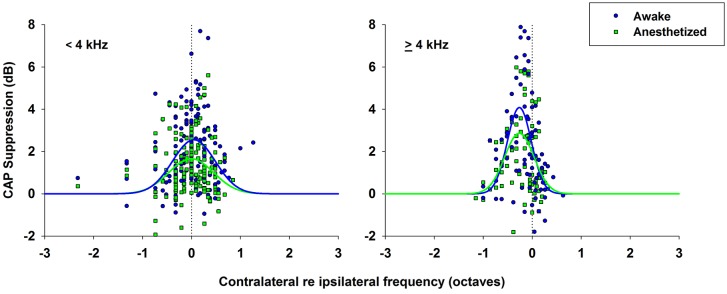
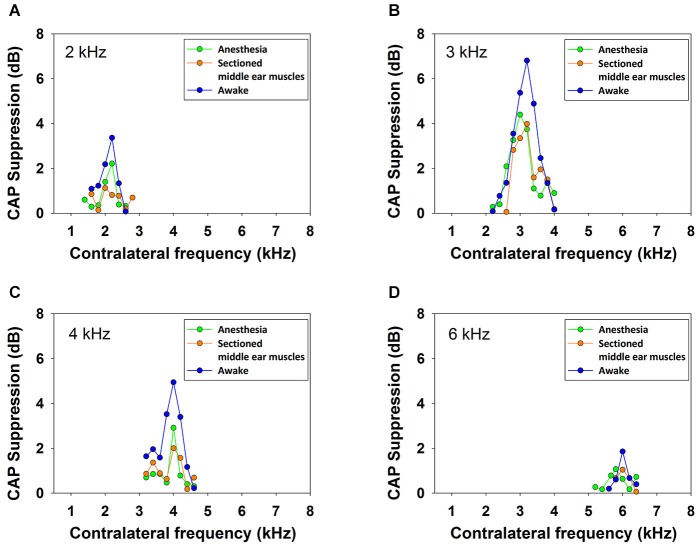
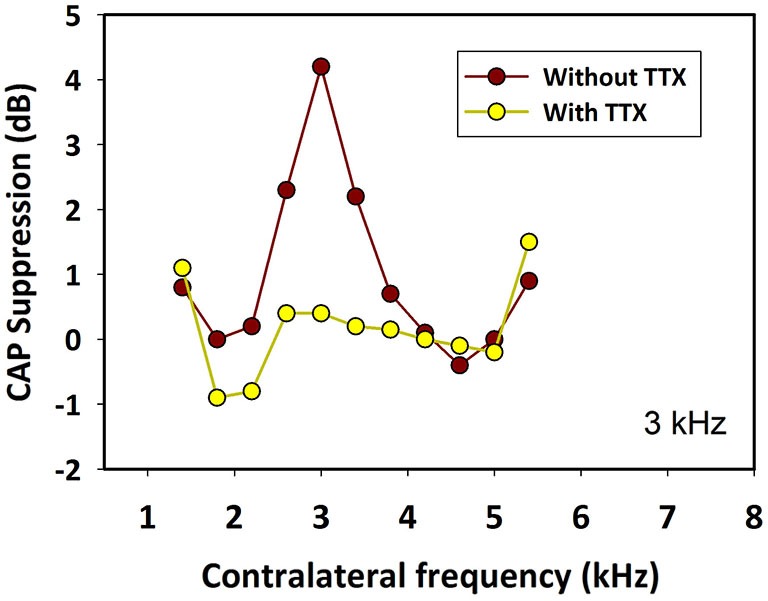
There are two types of sensory cells in the mammalian cochlea, inner hair cells, which make synaptic contact with auditory-nerve afferent fibers, and outer hair cells that are innervated by crossed and uncrossed medial olivocochlear (MOC) efferent fibers. Contralateral acoustic stimulation activates the uncrossed efferent MOC fibers reducing cochlear neural responses, thus modifying the input to the central auditory system. The chinchilla, among all studied mammals, displays the lowest percentage of uncrossed MOC fibers raising questions about the strength and frequency distribution of the contralateral-sound effect in this species. On the other hand, MOC effects on cochlear sensitivity have been mainly studied in anesthetized animals and since the MOC-neuron activity depends on the level of anesthesia, it is important to assess the influence of anesthesia in the strength of efferent effects. Seven adult chinchillas (Chinchilla laniger) were chronically implanted with round-window electrodes in both cochleae. We compared the effect of contralateral sound in awake and anesthetized condition. Compound action potentials (CAP) and cochlear microphonics (CM) were measured in the ipsilateral cochlea in response to tones in absence and presence of contralateral sound. Control measurements performed after middle-ear muscles section in one animal discarded any possible middle-ear reflex activation. Contralateral sound produced CAP amplitude reductions in all chinchillas, with suppression effects greater by about 1-3 dB in awake than in anesthetized animals. In contrast, CM amplitude increases of up to 1.9 dB were found in only three awake chinchillas. In both conditions the strongest efferent effects were produced by contralateral tones at frequencies equal or close to those of ipsilateral tones. Contralateral CAP suppressions for 1-6 kHz ipsilateral tones corresponded to a span of uncrossed MOC fiber innervation reaching at least the central third of the chinchilla cochlea.

Keywords: CAP suppression; anesthesia; auditory efferent; contralateral MOC reflex; frequency tuning; olivocochlear.


Figures

Figure 1
Figure 1
Experimental paradigm. Each stimulation sequence consisted of three consecutive series of 32 stimuli presented at 1 Hz rate: control, efferent and recovery. Control series consisting of ipsilateral tones (15 ms duration) presented alone. Efferent series in which the ipsilateral tone (15 ms duration) was preceded by a contralateral tone or noise (500 ms duration) followed by a silent period (15 ms duration). Recovery series in which the ipsilateral tones (15 ms duration) were again presented alone.
Figure 2
Figure 2
CAP suppression and CM increase produced by contralateral acoustical stimulation in an awake chinchilla. (A) Average CAP traces of 32 responses to ipsilateral tones in absence (blue) and presence (red) of contralateral acoustical stimulation. (B) Average CM traces of 32 responses to ipsilateral tones in absence (blue) and presence (red) of contralateral acoustical stimulation. (C) CAP response amplitudes in repeated trials in absence (blue) and presence (red) of contralateral acoustical stimulation. Each symbol represents the average CAP amplitude (N1 to P1 in μV) of two consecutive trials. Significant CAP reductions were obtained with contralateral acoustical stimulation (two tailed t-test, T(30) = 19.618, p = 1.157*10−18). (D) CM response amplitudes in repeated trials in absence (blue) and presence (red) of contralateral acoustical stimulation. Each symbol represents the average CM amplitude of two consecutive trials. Amplitudes (rms in μV) were obtained by fast Fourier transform (FFT). Significant CM enhancements were obtained with contralateral acoustical stimulation (two tailed t-test, T(30) = −22.329, p = 3.031*10−20). In all panels ipsilateral tones were 4 kHz at 60 dB SPL and contralateral broad-band noise was at 55 dB SPL.
Figure 3
Figure 3
CAP suppression produced by contralateral acoustical stimulation in an anesthetized chinchilla. Reductions of CAP amplitudes in response to ipsilateral tones obtained in the presence of contralateral broad-band noise (55 dB SPL). Each symbol represents the average CAP amplitude of two consecutive trials. The red circles correspond to responses to ipsilateral tones preceded by contralateral efferent stimulation. The green circles correspond to responses to ipsilateral tones alone, before and after contralateral efferent stimulation. Panel (A): 2 kHz at 47 dB SPL, panel (B): 3 kHz at 50 dB SPL, panel (C): 4 kHz at 44 dB SPL and panel (D): 6 kHz at 40 dB SPL. Significant CAP reductions were obtained with contralateral acoustical stimulation at 2 kHz (two tailed t-test, T(30) = 15.324, p = 9.919*10−16), 3 kHz (two tailed t-test, T(30) = 18.924, p = 3.150*10−18), 4 kHz (two tailed t-test, T(30) = 9.920, p = 5.509*10−11) and 6 kHz (two tailed t-test, T(30) = 18.391, p = 6.957*10−18).
Figure 4
Figure 4
CAP input–output curves. CAP amplitudes obtained in one chinchilla without (blue and green) and with (red) contralateral acoustical stimulation (broad-band noise at 50 dB SPL) in awake (blue) and anesthetized (green) condition. Vertical lines indicate standard deviations. Efferent-activation produced by contralateral stimulation is more effective at low ipsilateral stimulus intensities and efferent reductions are higher in awake than in anesthetized animals. Asterisks indicate statistically significant differences. Panel (A): 3 kHz, 20 dB: (Mann-Whitney, U(32) = 30.0, T = 1522, p < 0.001); 3 kHz, 30 dB: (Mann-Whitney, U(32) = 0.0, T = 528.0, p < 0.001); 3 kHz, 40 dB: (Mann-Whitney, U(32) = 0.0, T = 1522.0, p < 0.001); 3 kHz, 50 dB: (Mann-Whitney, U(32) = 126.0, T = 1426.0, p < 0.001). Panel (B): 3 kHz, 20 dB: (Mann-Whitney, U(32) = 170.0, T = 1382.0, p < 0.001); 3 kHz, 30 dB: (Mann-Whitney, U(32) = 5.0, T = 1547.0, p < 0.001); 3 kHz, 40 dB: (Mann-Whitney, U(32) = 0.0, T = 528.0, p < 0.001). Panel (C): 4 kHz, 20 dB: (Mann-Whitney, U(32) = 266.0, T = 1286.0, p < 0.001); 4 kHz, 30 dB: (Mann-Whitney, U(32) = 0.0, T = 528.0, p < 0.001); 4 kHz, 40 dB: (Mann-Whitney, U(32) = 0.0, T = 528.0, p < 0.001); 4 kHz, 50 dB: (Mann-Whitney, U(32) = 179.0, T = 707.0, p < 0.001). Panel (D): 4 kHz, 20 dB: (Mann-Whitney, U(32) = 266.0, T = 1286.0, p < 0.001); 4 kHz, 40 dB: (Mann-Whitney, U(32) = 2.0, T = 1550.0, p < 0.001).
Figure 5
Figure 5
Frequency tuning of ipsilateral CAP reduction produced by contralateral tone stimulation. Efferent reduction of CAP amplitudes produced by the presence of contralateral acoustical stimulation in four animals, in awake (blue) and anesthetized (green) condition, for ipsilateral tones at frequencies of 2, 3, 4 and 6 kHz. Intensities of the ipsilateral and contralateral tones were, panel (A): 55 and 69 dB SPL, panel (B): 58 and 64 dB SPL, panel (C): 56 and 62 dB SPL and panel (D): 53 and 58 dB SPL.
Figure 6
Figure 6
Frequency tuning of ipsilateral CAP reduction produced by contralateral tone stimulation in all animals. Superposition of the curves of CAP suppression produced by contralateral acoustical stimulation in all animals, in awake (blue) and anesthetized (green) condition, for ipsilateral tones at, panel (A): 2 kHz, panel (B): 3 kHz, panel (C): 4 kHz and panel (D): 6 kHz. Intensities of the tones were: 50 to 60 dB SPL for the ipsilateral and 60 to 70 dB SPL for the contralateral tones.
Figure 7
Figure 7
Frequency tuning curves of ipsilateral CAP reduction produced by contralateral tones at two intensities in an awake and anesthetized chinchilla. The magnitude and extent of the CAP reduction depend on the contralateral stimulus frequency and intensity. In this case, for a 4 kHz ipsilateral tone (48 dB SPL) the greatest CAP reductions were obtained for contralateral frequencies between 3400 and 4000 Hz. As in all other animals, the efferent effect was better tuned and stronger in awake than in anesthetized condition. Awake vs. anesthetized, 68 dB SPL (Mann-Whitney, U(32) = 0.0, T = 392, p < 0.001), 58 dB SPL (Mann-Whitney, U(32) = 0.0, T = 392, p < 0.001); 68 dB SPL vs. 58 dB SPL, awake (Mann-Whitney, U(32) = 45.0, T = 181, p = 0.002), anesthetized (Mann-Whitney, U(32) = 0.0, T = 136, p < 0.001).
Figure 8
Figure 8
Summary of efferent CAP suppression in awake and anesthetized animals. Symbols depict maximum CAP supressions produced by contralateral stimulation, in each animal, at each ipsilateral frequency in awake (blue) and anesthetized (green) condition. The dashed lines display the average of the maximum CAP reductions produced by contralateral tones for all animals at each ipsilateral frequency in awake (blue) and anesthetized condition (green). Intensities of ipsilateral and contralateral tones were 50–60 and 60–70 dB SPL, respectively. Asterisks indicate statistical significance.
Figure 9
Figure 9
Most effective contralateral suppressor frequencies vs. ipsilateral frequencies. Relationship between the frequencies of the most effective contralateral suppressors and the ipsilateral tones for all data obtained in awake (blue symbols) and anesthetized (green symbols) animals. The dashed lines indicate the average values of the most effective contralateral suppressors frequencies for all measurements at each ipsilateral frequency in awake (blue dashed line) and anesthetized (green dashed line) animals.
Figure 10
Figure 10
CAP suppression as a function of contralateral suppressor frequency re ipsilateral frequency. CAP suppressions as a function of the difference between contralateral frequencies and ipsilateral frequencies (in octaves) for all data in awake (blue circles) and anesthetized (green squares) animals. Normal distributions fitted to data, awake (blue line), anesthetized (green line). (Left) CAP suppression for ipsilateral frequencies <4 kHz. Awake, f(x)=2.56e0.5(x0.04830.435)2; anesthetized, f(x)=1.66e0.5(x+0.00670.435)2. (Right) CAP suppression for ipsilateral frequencies ≥ 4 kHz. Awake, f(x)=4.084e0.5(x+0.2620.245)2; anesthetized, f(x)=2.868e0.5(x+0.2630.301)2.
Figure 11
Figure 11
Frequency tuning curves in awake and anesthetized chinchilla with intact and sectioned middle-ear muscles. Efferent reduction of CAP amplitudes produced by contralateral acoustical stimulation (70 dB SPL) in one animal, awake (blue), anesthetized (green) and anesthetized with detached middle-ear muscles (orange), for ipsilateral tones (50 dB SPL) at, panel (A): 2 kHz, panel (B): 3 kHz, panel (C): 4 kHz and panel (D): 6 kHz. There were no significant differences between the results obtained in the anesthetized animal before and after middle-ear muscles detachment.
Figure 12
Figure 12
Effect of tetrodotoxin (TTX) in the contralateral cochlea. Ipsilateral CAP-reduction tuning curves before (brown) and after (yellow) injection of tetrodotoxin into the contralateral cochlea. The toxin abolished contralateral neural responses and their suppressive effect on ipsilateral CAPs. Ipsilateral tones at 3 kHz and 50 dB SPL. Contralateral tones at 70 dB SPL.

Similar articles

Cited by

References

    1. Azeredo W. J., Kliment M. L., Morley B. J., Relkin E., Slepecky N. B., Sterns A., et al. . (1999). Olivocochlear neurons in the chinchilla: a retrograde fluorescent labelling study. Hear. Res. 134, 57–70. 10.1016/s0378-5955(99)00069-6 - DOI - PubMed
    1. Bowen M., Aedo C., León A., Dragicevic C. D., Terreros G., Robles L., et al. (2014). “Awake state and auditory cortex microstimulation enhance contralateral-noise suppression of cochlear responses in chinchillas,” in 37th Annual MidWinter Meeting of the Association for Research in Otolaryngology Abstract Book, 37:52.
    1. Boyev K. P., Liberman M. C., Brown M. C. (2002). Effects of anesthesia on efferent-mediated adaptation of the DPOAE. J. Assoc. Res. Otolaryngol. 3, 362–373. 10.1007/s101620020044 - DOI - PMC - PubMed
    1. Brown M. C. (1987). Morphology of labeled efferent fibers in the guinea pig cochlea. J. Comp. Neurol. 260, 605–618. 10.1002/cne.902600412 - DOI - PubMed
    1. Buño W., Jr. (1978). Auditory nerve fiber activity influenced by contralateral ear sound stimulation. Exp. Neurol. 59, 62–74. 10.1016/0014-4886(78)90201-7 - DOI - PubMed

LinkOut - more resources