

Refractive error and ocular parameters: comparison of two SD-OCT systems
- PMID: 25785537
- PMCID: PMC4424184
- DOI: 10.1097/OPX.0000000000000559
Refractive error and ocular parameters: comparison of two SD-OCT systems
Abstract
Purpose: Spectral domain optical coherence tomography (OCT) was used to examine the influence of refractive error (RE) on foveal retinal and choroidal thicknesses and scleral canal width (SCW). The performance of the Cirrus and Bioptigen spectral domain OCT instruments was compared in the same eyes.
Methods: Both eyes of 40 healthy human subjects, aged 22 to 38 years, were dilated and imaged, with the Cirrus OCT, using 6-mm five-line rasters collapsed into one line, one centered on the fovea and one bisecting the optic nerve head. Seventy-two of the same eyes were imaged with the Bioptigen OCT, using 6- by 6-mm scans, one centered on the fovea and one on the optic nerve head. Subfoveal retinal and choroidal thicknesses and SCW were measured. Axial lengths (ALs) and REs were obtained using an IOLMaster and a Grand Seiko autorefractor, respectively.
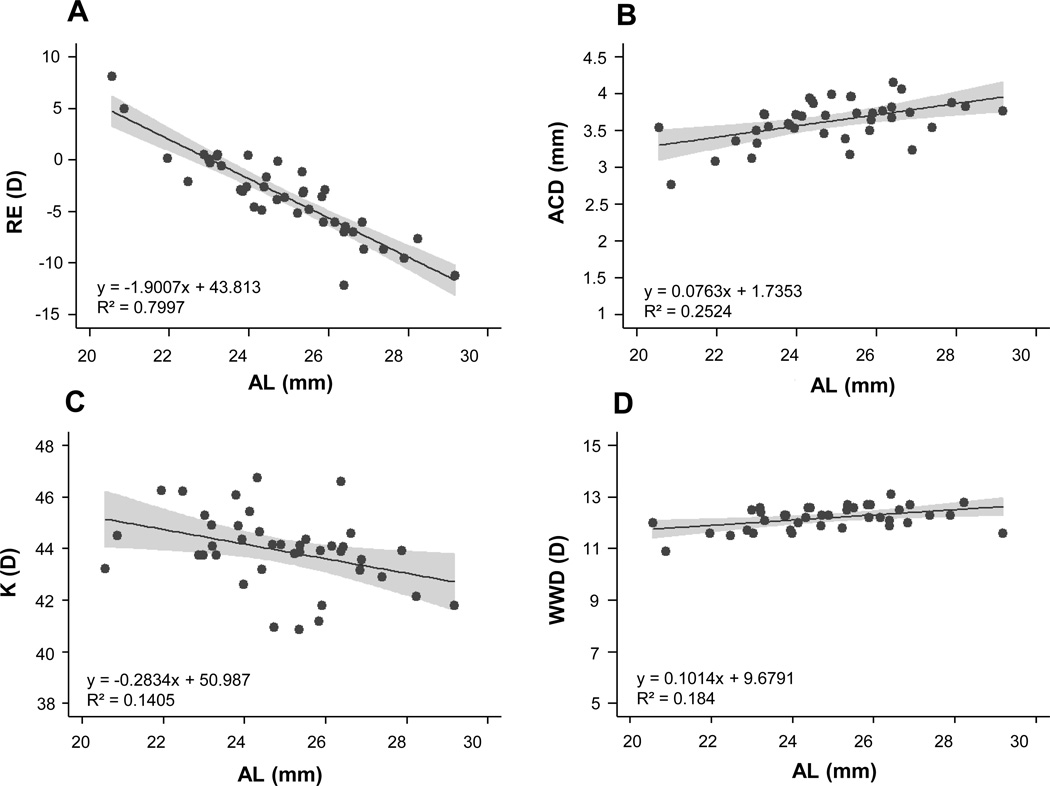
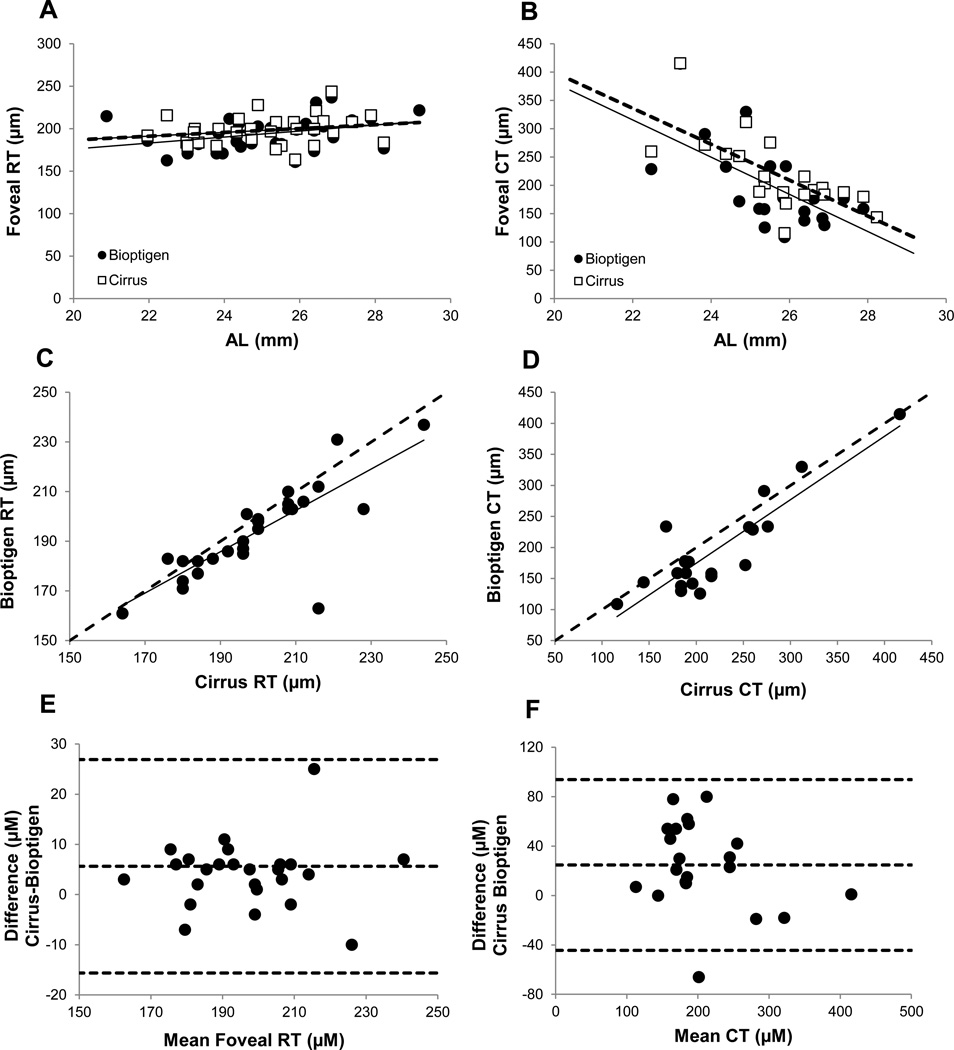
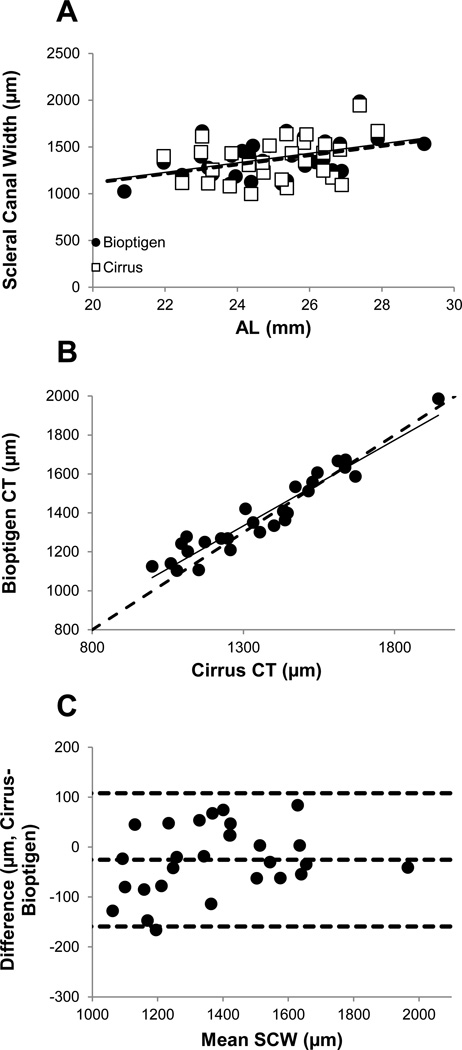
Results: Only right eyes were included in analyses. Spherical equivalent REs ranged from -12.18 to +8.12 diopters (mean [±SD], -3.44 [±4.06] diopters), and ALs ranged from 20.56 to 29.17 mm (mean [±SD], 24.86 [±1.91] mm). Myopia was associated with relatively thin choroids at the fovea (p < 0.05) but normal retinal thickness. Scleral canal width was significantly correlated with AL as measured with the Bioptigen OCT (p < 0.05). Retinal and choroidal thicknesses recorded with the Bioptigen OCT tended to be smaller than values obtained with the Cirrus OCT (mean difference, 5.63 and 24.76 μm, respectively), whereas the converse was true for the SCW (mean difference, 25.45 μm).
Conclusions: The finding that high myopes tend to have a thinner subfoveal choroid is consistent with previous studies. That high myopia was linked to enlarged scleral canals may help to explain the increased risk of glaucoma in myopia. Observed differences obtained with the Cirrus and Bioptigen instruments urge caution in comparing results collected with different instruments.
Figures
Similar articles
-
Choroidal and Retinal Thickness in Children With Different Refractive Status Measured by Swept-Source Optical Coherence Tomography.Am J Ophthalmol. 2016 Aug;168:164-176. doi: 10.1016/j.ajo.2016.05.008. Epub 2016 May 14. Am J Ophthalmol. 2016. PMID: 27189931
-
Eye shape using partial coherence interferometry, autorefraction, and SD-OCT.Optom Vis Sci. 2015 Jan;92(1):115-22. doi: 10.1097/OPX.0000000000000453. Optom Vis Sci. 2015. PMID: 25437906 Free PMC article.
-
The interaction between homatropine and optical blur on choroidal thickness.Ophthalmic Physiol Opt. 2018 May;38(3):257-265. doi: 10.1111/opo.12450. Ophthalmic Physiol Opt. 2018. PMID: 29691923
-
Choroidal thickness and ocular growth in childhood.Surv Ophthalmol. 2021 Mar-Apr;66(2):261-275. doi: 10.1016/j.survophthal.2020.06.008. Epub 2020 Jul 4. Surv Ophthalmol. 2021. PMID: 32634443 Review.
-
[The new findings of high myopia by swept-source optical coherence tomography].Zhonghua Yan Ke Za Zhi. 2016 Jul;52(7):547-50. doi: 10.3760/cma.j.issn.0412-4081.2016.07.017. Zhonghua Yan Ke Za Zhi. 2016. PMID: 27531116 Review. Chinese.
Cited by
-
Evaluation of Optical Coherence Tomography to Detect Elevated Intracranial Pressure in Children.JAMA Ophthalmol. 2017 Apr 1;135(4):320-328. doi: 10.1001/jamaophthalmol.2017.0025. JAMA Ophthalmol. 2017. PMID: 28241164 Free PMC article.
-
Ocular image-based deep learning for predicting refractive error: A systematic review.Adv Ophthalmol Pract Res. 2024 Jul 2;4(3):164-172. doi: 10.1016/j.aopr.2024.06.005. eCollection 2024 Aug-Sep. Adv Ophthalmol Pract Res. 2024. PMID: 39114269 Free PMC article. Review.
-
Deep learning for predicting uncorrected refractive error using posterior segment optical coherence tomography images.Eye (Lond). 2022 Oct;36(10):1959-1965. doi: 10.1038/s41433-021-01795-5. Epub 2021 Oct 5. Eye (Lond). 2022. PMID: 34611313 Free PMC article.
-
Clinical features of posterior microphthalmic and nanophthalmic eyes.Int J Ophthalmol. 2018 Nov 18;11(11):1829-1834. doi: 10.18240/ijo.2018.11.15. eCollection 2018. Int J Ophthalmol. 2018. PMID: 30450315 Free PMC article.
-
Prediction of Refractive Error Based on Ultrawide Field Images With Deep Learning Models in Myopia Patients.Front Med (Lausanne). 2022 Mar 30;9:834281. doi: 10.3389/fmed.2022.834281. eCollection 2022. Front Med (Lausanne). 2022. PMID: 35433763 Free PMC article.
References
-
- Tornquist R, Stenkula S, Tornquist P. Retinal detachment. A study of a population-based patient material in Sweden 1971–1981. I. Epidemiology. Acta Ophthalmol (Copenh) 1987;65:213–222. - PubMed
-
- Hotchkiss ML, Fine SL. Pathologic myopia and choroidal neovascularization. Am J Ophthalmol. 1981;91:177–183. - PubMed
-
- Pan CW, Cheung CY, Aung T, Cheung CM, Zheng YF, Wu RY, Mitchell P, Lavanya R, Baskaran M, Wang JJ, Wong TY, Saw SM. Differential associations of myopia with major age-related eye diseases: the Singapore Indian Eye Study. Ophthalmology. 2013;120:284–291. - PubMed
-
- Flitcroft DI. The complex interactions of retinal, optical and environmental factors in myopia aetiology. Prog Retin Eye Res. 2012;31:622–660. - PubMed
-
- Zhao L, Wang Y, Chen CX, Xu L, Jonas JB. Retinal nerve fibre layer thickness measured by Spectralis spectral-domain optical coherence tomography: The Beijing Eye Study. Acta Ophthalmol. 2014;92:e35–e41. - PubMed
Publication types
MeSH terms
Grants and funding
LinkOut - more resources
Full Text Sources
Other Literature Sources
Miscellaneous
