Quantitative evaluation of human cerebellum-dependent motor learning through prism adaptation of hand-reaching movement
- PMID: 25785588
- PMCID: PMC4364988
- DOI: 10.1371/journal.pone.0119376
Quantitative evaluation of human cerebellum-dependent motor learning through prism adaptation of hand-reaching movement
Abstract
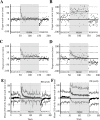
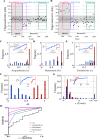
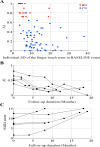
The cerebellum plays important roles in motor coordination and learning. However, motor learning has not been quantitatively evaluated clinically. It thus remains unclear how motor learning is influenced by cerebellar diseases or aging, and is related with incoordination. Here, we present a new application for testing human cerebellum-dependent motor learning using prism adaptation. In our paradigm, the participant wearing prism-equipped goggles touches their index finger to the target presented on a touchscreen in every trial. The whole test consisted of three consecutive sessions: (1) 50 trials with normal vision (BASELINE), (2) 100 trials wearing the prism that shifts the visual field 25° rightward (PRISM), and (3) 50 trials without the prism (REMOVAL). In healthy subjects, the prism-induced finger-touch error, i.e., the distance between touch and target positions, was decreased gradually by motor learning through repetition of trials. We found that such motor learning could be quantified using the "adaptability index (AI)", which was calculated by multiplying each probability of [acquisition in the last 10 trials of PRISM], [retention in the initial five trials of REMOVAL], and [extinction in the last 10 trials of REMOVAL]. The AI of cerebellar patients less than 70 years old (mean, 0.227; n = 62) was lower than that of age-matched healthy subjects (0.867, n = 21; p < 0.0001). While AI did not correlate with the magnitude of dysmetria in ataxic patients, it declined in parallel with disease progression, suggesting a close correlation between the impaired cerebellar motor leaning and the dysmetria. Furthermore, AI decreased with aging in the healthy subjects over 70 years old compared with that in the healthy subjects less than 70 years old. We suggest that our paradigm of prism adaptation may allow us to quantitatively assess cerebellar motor learning in both normal and diseased conditions.
Conflict of interest statement
Figures


Similar articles
-
Modulation of error-sensitivity during a prism adaptation task in people with cerebellar degeneration.J Neurophysiol. 2015 Oct;114(4):2460-71. doi: 10.1152/jn.00145.2015. Epub 2015 Aug 26. J Neurophysiol. 2015. PMID: 26311179 Free PMC article.
-
A loss of a velocity-duration trade-off impairs movement precision in patients with cerebellar degeneration.Eur J Neurosci. 2018 Aug;48(4):1976-1989. doi: 10.1111/ejn.14062. Epub 2018 Jul 26. Eur J Neurosci. 2018. PMID: 29972715 Free PMC article.
-
[Memory transfer in cerebellar motor learning].Rinsho Shinkeigaku. 2012;52(11):994-6. doi: 10.5692/clinicalneurol.52.994. Rinsho Shinkeigaku. 2012. PMID: 23196495 Japanese.
-
Dysmetria and Errors in Predictions: The Role of Internal Forward Model.Int J Mol Sci. 2020 Sep 20;21(18):6900. doi: 10.3390/ijms21186900. Int J Mol Sci. 2020. PMID: 32962256 Free PMC article. Review.
-
Rehabilitation of ataxic gait following cerebellar lesions: Applying theory to practice.Physiother Theory Pract. 2016 Aug;32(6):430-437. doi: 10.1080/09593985.2016.1202364. Epub 2016 Jul 26. Physiother Theory Pract. 2016. PMID: 27458875 Review.
Cited by
-
Consensus Paper: Cerebellum and Ageing.Cerebellum. 2024 Apr;23(2):802-832. doi: 10.1007/s12311-023-01577-7. Epub 2023 Jul 10. Cerebellum. 2024. PMID: 37428408 Free PMC article. Review.
-
Different Numbers of Conjunctive Stimuli Induce LTP or LTD in Mouse Cerebellar Purkinje Cell.Cerebellum. 2024 Dec;23(6):2297-2307. doi: 10.1007/s12311-024-01726-6. Epub 2024 Aug 3. Cerebellum. 2024. PMID: 39096432 Free PMC article.
-
The Clinical Concept of LTDpathy: Is Dysregulated LTD Responsible for Prodromal Cerebellar Symptoms?Brain Sci. 2022 Feb 24;12(3):303. doi: 10.3390/brainsci12030303. Brain Sci. 2022. PMID: 35326260 Free PMC article.
-
Rating scales and biomarkers for CAG-repeat spinocerebellar ataxias: Implications for therapy development.J Neurol Sci. 2021 May 15;424:117417. doi: 10.1016/j.jns.2021.117417. Epub 2021 Apr 1. J Neurol Sci. 2021. PMID: 33836316 Free PMC article. Review.
-
Weak correlations between cerebellar tests.Sci Rep. 2020 Jun 2;10(1):9003. doi: 10.1038/s41598-020-65886-1. Sci Rep. 2020. PMID: 32488084 Free PMC article.
References
-
- Ito M. The cerebellum and neural control. New York: Raven Press; 1984.
-
- Ito M. The Cerebellum: Brain for an Implicit Self. New York: FT Press; 2011.
-
- Lisberger SG, Thach WT. The Cerebellum In: Kandel ER, Schwartz JH, Jessell TM, Siegelbaum SA, Hudspeth AJ, editors. Principles of Neural Science. McGraw-Hill; 2013. pp. 960–981.
-
- Babinski J. De l' asynergie cérébelleuse. Rev Neurol. 1899; 7: 806–816.
-
- Holmes G. THE CEREBELLUM OF MAN. Brain. 1939; 62: 1–30.
Publication types
MeSH terms
LinkOut - more resources
Full Text Sources
Other Literature Sources
Medical

