. 2015 Mar 18;11(3):e1005079.
doi: 10.1371/journal.pgen.1005079. eCollection 2015 Mar.

Escape from X inactivation varies in mouse tissues

Affiliations

Escape from X inactivation varies in mouse tissues

Joel B Berletch et al. PLoS Genet. .

Abstract

X chromosome inactivation (XCI) silences most genes on one X chromosome in female mammals, but some genes escape XCI. To identify escape genes in vivo and to explore molecular mechanisms that regulate this process we analyzed the allele-specific expression and chromatin structure of X-linked genes in mouse tissues and cells with skewed XCI and distinguishable alleles based on single nucleotide polymorphisms. Using a binomial model to assess allelic expression, we demonstrate a continuum between complete silencing and expression from the inactive X (Xi). The validity of the RNA-seq approach was verified using RT-PCR with species-specific primers or Sanger sequencing. Both common escape genes and genes with significant differences in XCI status between tissues were identified. Such genes may be candidates for tissue-specific sex differences. Overall, few genes (3-7%) escape XCI in any of the mouse tissues examined, suggesting stringent silencing and escape controls. In contrast, an in vitro system represented by the embryonic-kidney-derived Patski cell line showed a higher density of escape genes (21%), representing both kidney-specific escape genes and cell-line specific escape genes. Allele-specific RNA polymerase II occupancy and DNase I hypersensitivity at the promoter of genes on the Xi correlated well with levels of escape, consistent with an open chromatin structure at escape genes. Allele-specific CTCF binding on the Xi clustered at escape genes and was denser in brain compared to the Patski cell line, possibly contributing to a more compartmentalized structure of the Xi and fewer escape genes in brain compared to the cell line where larger domains of escape were observed.


Conflict of interest statement

The authors have declared that no competing interests exist.

Figures

Fig 1
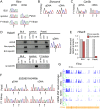
Fig 1. Evaluation of escape from XCI in mouse tissues.
(A) Example of mRNA SNP read distribution profiles on the Xi and Xa for Kdm5c, an escape gene common to all mouse tissues tested (brain, spleen and ovary). SNP reads specific to the Xa (blue) and Xi (green) are visualized in the UCSC genome browser. RNA-seq read quantification was done by normalizing reads from the Xi to total reads (Xi + Xa) in two biological replicates. (B) Example of mRNA SNP read distribution profiles on the Xi and Xa for Cfp, a gene that escapes XCI only in spleen. SNP reads specific to the Xa (blue) and Xi (green) are visualized in the UCSC genome browser. (C, D) Validation of escape from XCI for Cfp. (C) Gel electrophoresis of RT-PCR products using non-species-specific primers and spretus-specific primers (sp) (S10 Table) in BL6, spretus, and F1 brain in which the Xi is from spretus. ActinB was used as a control. Control reactions include "No RT" (no reverse transcriptase) and H2O (instead of primers). (D) Graph comparing RT-PCR Cfp gel band quantification measured by ImageJ with SNP read quantification measured by RNA-seq. Xi product abundance measured by RT-PCR using spretus-specific primers in F1 spleen was normalized to total RT-PCR product abundance measured by non-species specific primers.
Fig 2
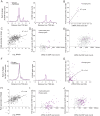
Fig 2. Validation of Rlim, Shroom4, Car5b, Hdac6, 5530601H04Rik expression profiles and Firre mRNA profiles.
(A) Sanger sequencing tracings of Rlim cDNA confirm bi-allelic expression in Patski cells but not brain, while gDNA sequence tracings show SNP heterozygosity (C in BL6 and T in spretus). Arrows indicate SNP positions. (B, C) Sanger sequencing tracings of Shroom4 (B) and Carb5 (C) cDNA confirm that these genes are subject to XCI in F1 kidney while they were shown to escape XCI in Patski cells [18]. gDNA sequence tracings show SNP heterozygosity (Shroom4—G in BL6 and A in spretus; Car5b—G and C in BL6; A and T in spretus). Arrows indicate SNP positions. (D, E) Validation of escape from XCI for Hdac6. (D) Gel electrophoresis of RT-PCR products using non-species-specific primers, spretus-specific primers, and BL6-specific primers (S10 Table) in BL6, spretus, Patski cells and F1 kidney. ActinB was used as a control. Control reactions include "No RT" (no reverse transcriptase) and H2O (instead of primers). Sanger sequencing tracing confirms heterozygosity (A in BL6 and G in spretus) in the left primer (S10 Table). (E) Xi expression of Hdac6 was determined to be 9% of total expression in Patski cells by gel band quantification measured by ImageJ. (F) Sanger sequencing tracings of 5530601H04Rik cDNA confirms that the lncRNA escapes XCI in kidney and Patski cells, while gDNA sequence tracings show heterozygosity (T and A in BL6; A and G in spretus). Arrows indicate SNP positions. (G) mRNA SNP read distribution profiles on the Xi and Xa for Firre, a lncRNA that escapes XCI in mouse tissues and Patski cells. Note that Firre is classified as a variable escape gene in brain (S1 Dataset). Xa SNP reads are in blue and Xi SNP reads in green.
Fig 3
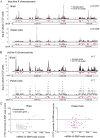
Fig 3. Enrichment in PolII-S5p and DNase I hypersensitivity on the Xi allele at escape genes.
(A, B) Examples of allele-specific PolII-S5p occupancy profiles and expression (mRNA) profiles at Ddx3x, Rlim and Igbp1 in two systems: brain (A) and Patski cells (B). Ddx3x escapes XCI in both systems, Rlim escapes XCI in Patski cells only, and Igbp1 is subject to XCI in both systems. PolII-S5p is enriched at the promoter regions (highlighted by a red box) of escape genes on both the Xa and the Xi, whereas enrichment is limited to the Xa for genes subject to XCI. DNase I hypersensitivity tested in Patski cells only is also increased at the promoter regions (highlighted by a red box) of escape genes on both the Xa and Xi, but is limited to the Xa for genes subject to XCI. Genes that escape XCI are labeled orange and genes subject to XCI blue. Color-coded profiles are shown for the Xa (blue) and Xi (green) SNP reads, and for the total reads (Xt, black). See additional examples in S2 Fig.
Fig 4
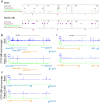
Fig 4. PolII-S5p enrichment at promoters of X-linked genes on the Xi correlates with expression and escape from XCI.
(A) Metagene analyses in brain show average Xa- (left) and Xi- (right) SNP read counts in 100bp windows 3kb upstream and downstream of the TSS for escape genes (purple; 14 genes with ≥2 Xi-SRPM in both replicates for brain) and for genes subject to XCI (gray; 403 genes with <2 Xi-SRPM in both replicates for brain). (B) The ratios of PolII-S5p enrichment at the promoter (SNP reads within ±500bp of the TSS) of escape genes (purple) on the Xi versus the Xa are strongly correlated to the ratios of expression from the Xi versus the Xa measured by RNA-seq in brain. Xist is excluded in this analysis. (C) Scatter plot of PolII-S5p promoter enrichment (log2 of reads within ±500bp of the TSS) against expression levels of all X-linked genes (log2 RPKM) shows a positive correlation in brain. (D) Scatter plot of Xi-specific PolII-S5p promoter enrichment (SNP reads within ±500bp of the TSS) against expression (Xi SNP reads) for escape genes (purple) and genes subject to XCI (gray) in brain. Promoter PolII-S5p enrichment correlates with expression from the Xi. (E) Same analysis as for D but for Xa-specific PolII-S5p promoter enrichment in brain. Escape genes generally overlap with genes subject to XCI, but are often highly expressed and enriched in PolII-S5p. (F-J). Same analyses as A-E for Patski cells.
Fig 5
Fig 5. DNase I hypersensitivity at the promoters of X-linked genes correlates with expression and escape from XCI.
(A) Metagene analyses of DNase I hypersensitivity (DHS) in Patski cells show average Xa- (left) and Xi- (right) SNP read counts in 100bp windows 3kb upstream and downstream of the TSS for escape genes (purple; 43 genes in both replicates for Patski cells) and for genes subject to XCI (gray; 203 genes with <2 Xi-SRPM in both replicates for Patski cells). (B) Scatter plot shows a positive correlation between DHS at the promoter (log2 of all reads within a region ±500bp from the TSS) and expression (log2 RPKM) for all X-linked genes in Patski cells. (C) Scatter plot of Xi-specific DHS at the promoter (reads within a region ±500bp from the TSS) against expression (Xi SNP-reads) for escape genes (purple) and genes subject to XCI (gray) shows a correlation between DHS and level of escape from XCI in Patski cells. (D) Same analysis as in C but for Xa-specific DHS at the promoter region. Escape genes generally overlap with genes subject to XCI although escape genes tend to have high expression and high DHS. (E). Scatter plot shows a good correlation between DHS and enrichment in PolII-S5p at the promoter of genes on the Xi. DHS and PolII-S5p are shown as reads within a region ±500bp from the TSS for escape genes (purple) and genes subject to XCI (gray) in Patski cells.
Fig 6
Fig 6. Xi-associated but not Xa-associated CTCF peak clusters co-localize with escape regions.
(A) Significant CTCF Xi-binding clusters were mapped along the Xi in brain and Patski cells. Xi- and both-preferred peaks were determined by a binomial model and used for density analysis. Red bars represent merger of clusters of CTCF Xi-binding peaks, while purple dots represent escape genes. Significant Xi-binding CTCF binding clusters tend to co-localize with chromatin containing escape genes. Little change was seen after removal of promoter-associated CTCF binding (S3B Fig). Horizontal axis represents the Xi in Mb. The vertical axis is the negative log of the calculated binomial p-value (-log (p-value)). The thin red dashed line represents a 0.01 p-value cutoff. (B) Similar analysis for CTCF Xa- and both-preferred peaks. There was no significant CTCF co-localization with escape genes on the Xa in either brain or Patski cells. (C) Average CTCF Xi-SNP read counts in ten 100bp windows at promoters (0.5kb upstream and downstream of the TSS) is plotted against mRNA-seq Xi-SNP read counts escape genes (purple) and for genes subject to XCI (gray) in brain and Patski cells. In brain, a higher proportion of escape genes (6/14; Fisher’s exact test, p = 5e-9) had an average ≥10 reads (black line) at their promoter compared to genes subject to XCI (0/403). Similarly, in Patski cells a higher proportion of escape genes (9/65; Fisher’s exact test, p = 0.0004) had an average of ≥1 read (black line) at their promoter compared to genes subject to XCI (3/204).
Fig 7
Fig 7. CTCF peaks density and distribution differ in brain and Patski cells.
(A) Examples of Xi-preferred and both-preferred CTCF peaks distribution in three X chromosome regions (coordinates in million bp on top). The density of escape genes (purple dots, with total number under each region) is inversely related to the density of Xi-preferred (green) and both-preferred (brown) CTCF-binding peaks when comparing brain to Patski cells. (B) Allele-specific CTCF binding profiles around Kdm5c, a common escape gene flanked by Iqsec2 and Kantr. In brain where only Kdm5c escapes XCI, CTCF binding is present at the 5’ end of the gene at the transition (double star) between Kdm5c and Iqsec2 whose short and long transcripts are subject to XCI (see also S4A Fig). In Patski cells there is no such CTCF binding between Kdm5c and Iqsec2, which escapes XCI. CTCF also binds proximal of the Iqsec2 short transcript in both brain and Patski cells, which could represent a proximal boundary of an escape domain. (C) Similar analysis at a region around Rlim, a gene that escapes XCI in Patski cells but not in brain, while the adjacent gene Slc16a2 escapes XCI in both systems. A CTCF peak is present in the transition region only in brain. (D) Similar analysis in a region around Car5b, a gene that escapes XCI in Patski cells but not in brain (see also S4B Fig). CTCF binding peaks are located within the body of Car5b and in the transition between Car5b and Siah1b on the Xi in Patski cells. Genes that escape XCI are labeled orange and genes subject to XCI blue. Xa SNP reads are in blue and Xi SNP reads in green. Red stars indicate Xi- or both-preferred CTCF peaks on the Xi; one of the CTCF peaks is marked by a black star because it is present but was not called preferred at our cutoff.
Fig 8
Fig 8. X chromosome escape maps differ between mouse tissues.
The position of genes that escape XCI using a ≥2 Xi-SRPM cutoff (black lines) is shown at left for three tissues (brain, ovary and spleen) from F1 mice analyzed in our study. Gene names are color-coded to reflect their classification into group 1 (green, common in at least two tissues) or group 2 (blue, brain-specific escape; red, spleen-specific; brown, ovary-specific) based on our criteria (see Table 1). Coordinates at left are based on UCSC genome build NCBI37/mm9. For comparison, the genes reported to escape XCI in sorted brain cells from a M. musculus x M. castaneus cross [25], and genes reported to escape imprinted XCI in mid-gestation placenta from a M. musculus x M. castaneus cross [24] are shown at right. Genes labeled green are common between studies.

Similar articles

Cited by

References

    1. Deng X, Berletch JB, Nguyen DK, Disteche CM (2014) X chromosome regulation: diverse patterns in development, tissues and disease. Nat Rev Genet 15: 367–378. 10.1038/nrg3687 - DOI - PMC - PubMed
    1. Lessing D, Anguera MC, Lee JT (2013) X chromosome inactivation and epigenetic responses to cellular reprogramming. Annu Rev Genomics Hum Genet 14: 85–110. 10.1146/annurev-genom-091212-153530 - DOI - PubMed
    1. Berletch JB, Yang F, Xu J, Carrel L, Disteche CM (2011) Genes that escape from X inactivation. Hum Genet 130: 237–245. 10.1007/s00439-011-1011-z - DOI - PMC - PubMed
    1. Peeters SB, Cotton AM, Brown CJ (2014) Variable escape from X-chromosome inactivation: Identifying factors that tip the scales towards expression. Bioessays - PMC - PubMed
    1. Anderson CL, Brown CJ (2002) Variability of X chromosome inactivation: effect on levels of TIMP1 RNA and role of DNA methylation. Hum Genet 110: 271–278. - PubMed

Publication types