. 2015 Mar 18;11(3):e1004760.
doi: 10.1371/journal.ppat.1004760. eCollection 2015 Mar.

A Plasmodium phospholipase is involved in disruption of the liver stage parasitophorous vacuole membrane

Affiliations

A Plasmodium phospholipase is involved in disruption of the liver stage parasitophorous vacuole membrane

Paul-Christian Burda et al. PLoS Pathog. .

Abstract

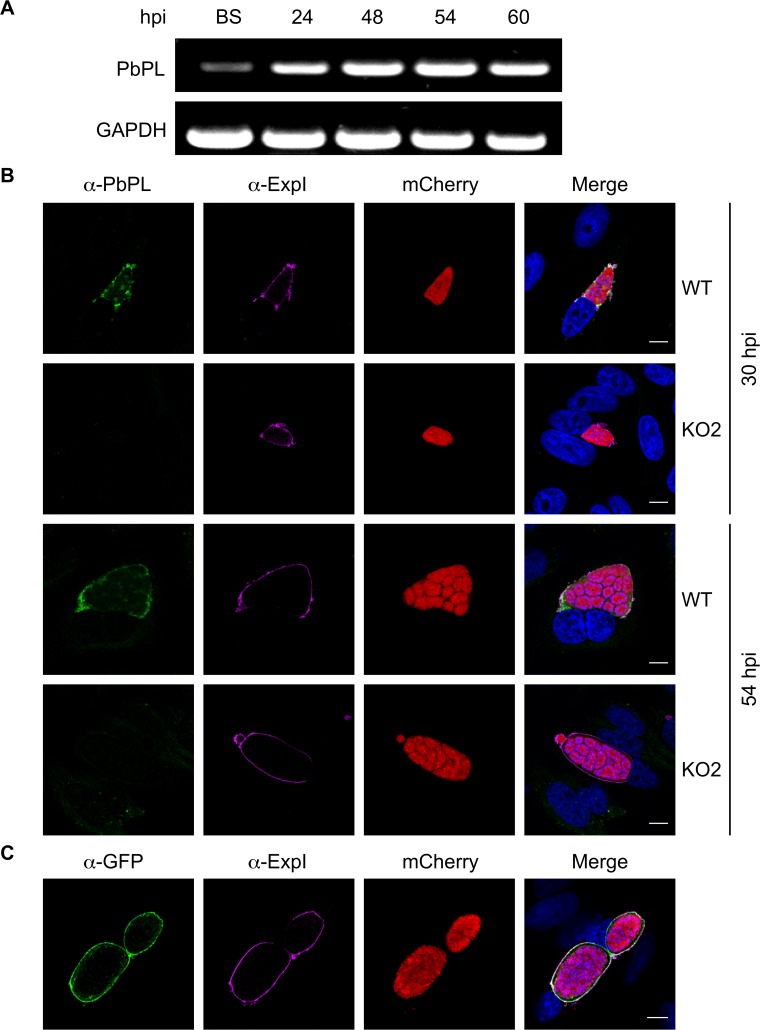
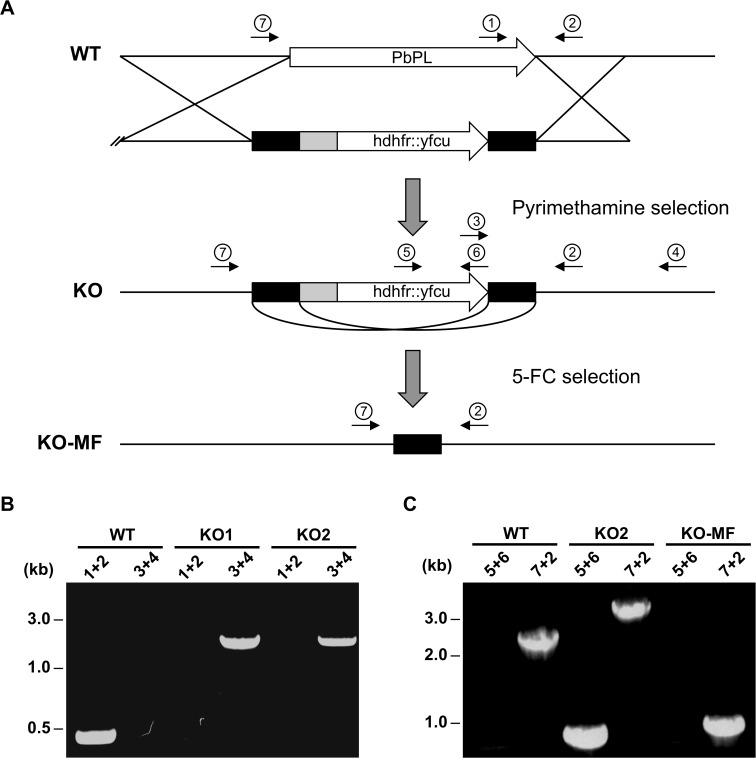
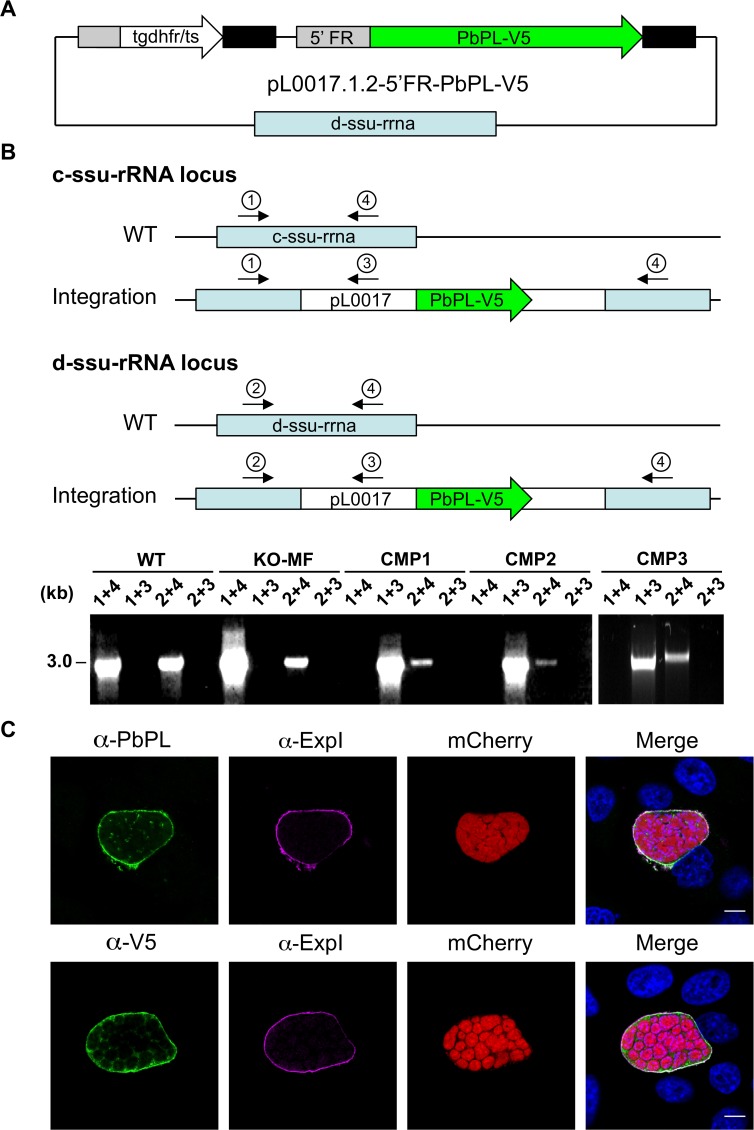
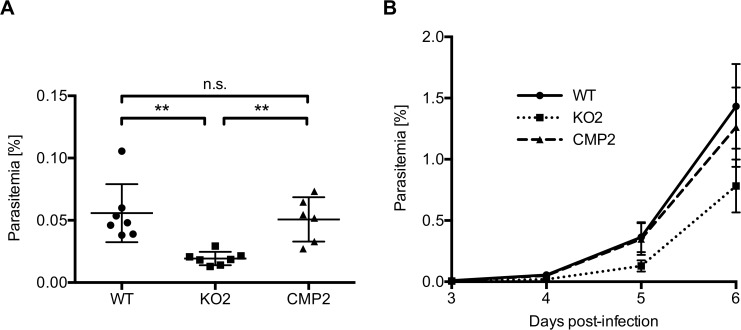
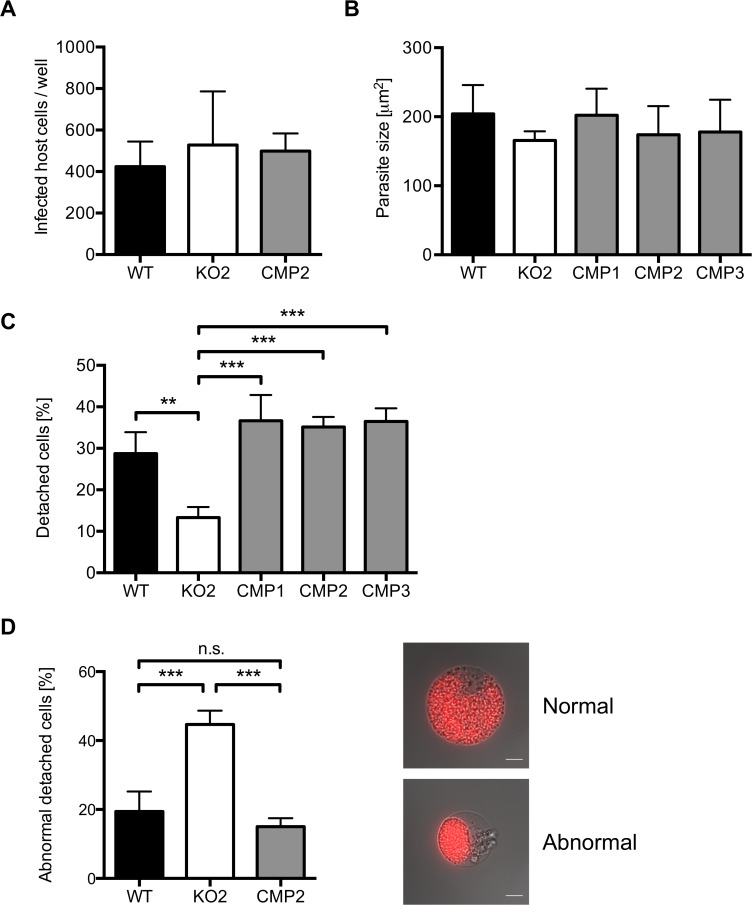
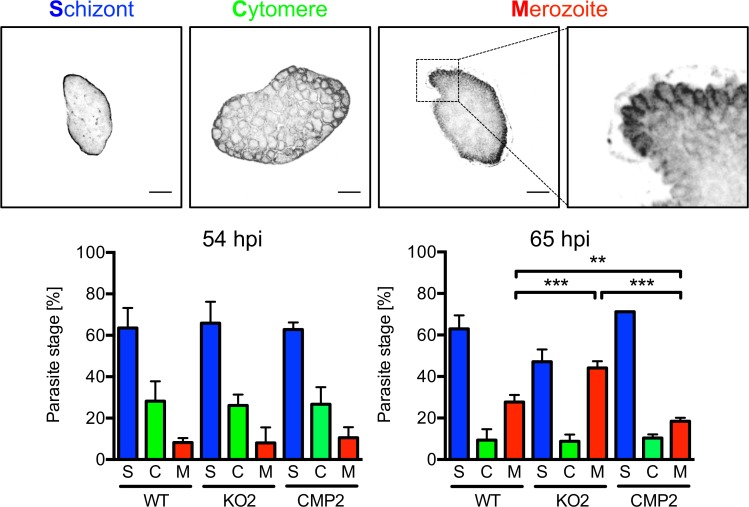
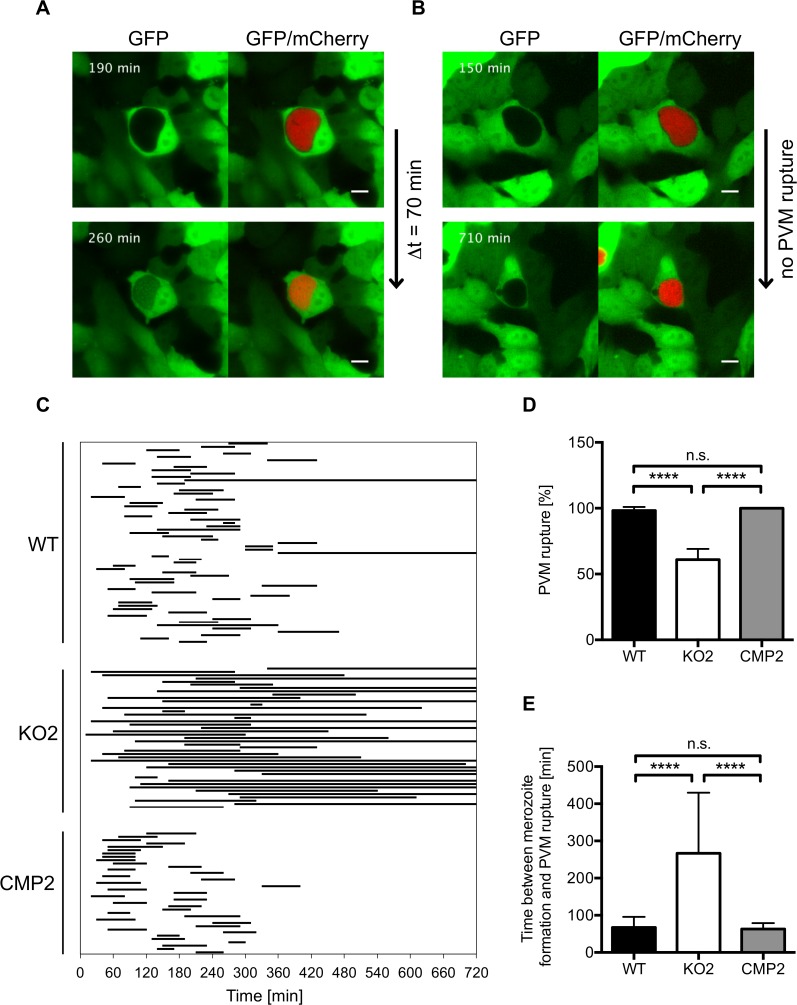
The coordinated exit of intracellular pathogens from host cells is a process critical to the success and spread of an infection. While phospholipases have been shown to play important roles in bacteria host cell egress and virulence, their role in the release of intracellular eukaryotic parasites is largely unknown. We examined a malaria parasite protein with phospholipase activity and found it to be involved in hepatocyte egress. In hepatocytes, Plasmodium parasites are surrounded by a parasitophorous vacuole membrane (PVM), which must be disrupted before parasites are released into the blood. However, on a molecular basis, little is known about how the PVM is ruptured. We show that Plasmodium berghei phospholipase, PbPL, localizes to the PVM in infected hepatocytes. We provide evidence that parasites lacking PbPL undergo completely normal liver stage development until merozoites are produced but have a defect in egress from host hepatocytes. To investigate this further, we established a live-cell imaging-based assay, which enabled us to study the temporal dynamics of PVM rupture on a quantitative basis. Using this assay we could show that PbPL-deficient parasites exhibit impaired PVM rupture, resulting in delayed parasite egress. A wild-type phenotype could be re-established by gene complementation, demonstrating the specificity of the PbPL deletion phenotype. In conclusion, we have identified for the first time a Plasmodium phospholipase that is important for PVM rupture and in turn for parasite exit from the infected hepatocyte and therefore established a key role of a parasite phospholipase in egress.


Conflict of interest statement

The authors have declared that no competing interests exist.

Figures

Fig 1
Fig 1. PbPL is expressed throughout liver stage development and localizes to the PVM.
A) PbPL mRNA expression profile in blood stages (BS) and in liver stages at 24, 48, 54 and 60 hours post-infection (hpi). Transcripts were detected by RT-PCR, using primers specific for PbPL and P. berghei glyceraldehyde-3-phosphate dehydrogenase (GAPDH, PBANKA_132640) as a control. B) Endogenous PbPL localizes to the PVM. An antiserum against His-PbPL195–312 was raised in a mouse and used in IFA of wild-type (WT) and PbPL-knockout (KO2) liver stage parasites constitutively expressing cytosolic mCherry. Parasites were fixed at 30 and 54 hpi and additionally stained with an antiserum against the PVM marker protein ExpI. C) GFP-tagging of PbPL confirms PVM localization. PbPL was expressed as a GFP-fusion protein in P. berghei liver stage parasites additionally constitutively expressing cytosolic mCherry, which were fixed at 54 hpi and analyzed by IFA. PbPL (green), ExpI (purple), mCherry (red). The merged channels additionally contain DAPI-stained nuclei (blue). Scale bars = 10 μm.
Fig 2
Fig 2. Generation and genotype analyses of PbPL-knockout parasite lines.
A) Schematic representation of knockout (KO) strategy and marker recycling. Two clonal PbPL-KO parasite lines were generated by transfection of wild-type (WT) blood stage parasites with a plasmoGEM vector containing a fusion of the positive drug selectable marker hdhfr (human dihydrofolate reductase) and the negative marker yfcu (yeast cytosine deaminase and uridyl phosphoribosyl transferase) under the control of the P. berghei eef1α promoter (grey box) targeting the PbPL coding sequence by double crossover homologous recombination followed by pyrimethamine selection. The selection marker was removed by negative selection with 5-Fluorocytosine (5-FC), whereby marker-free PbPL-KO parasites (KO-MF) were selected that had undergone homologous recombination between the two 3’dhfr untranslated regions (black boxes) present in the targeting vector flanking the hdhfr::yfcu cassette. Locations of primers used for PCR analysis are shown. B) Diagnostic PCR to confirm PbPL-KO clones. Primer 1 and 2 are expected to give a product of 398 bp in case of WT parasites, while primer 3 and 4 are expected to yield a product of 2058 bp for KO parasites. C) Diagnostic PCR to confirm successful removal of selectable marker. Primers 5 and 6 bind in the yfcu gene and are therefore expected to only give a product of 909 bp in case of selectable marker containing KO parasites. Primers 7 and 2 are expected to give a product of 2568 bp in case of WT, a product of 3782 bp for KO and a product of 1001 bp for KO-MF parasites. All primer sequences are listed in S1 Table.
Fig 3
Fig 3. Generation and confirmation of complemented PbPL-knockout parasites.
A) Schematic representation of the plasmid pL0017.1.2-5’FR-PbPL-V5 used to transfect marker-free PbPL-knockout (KO-MF) parasites, thereby generating complemented PbPL-KO (CMP) parasites. The PbPL coding sequence and the endogenous promoter region (1067 bp upstream of the start codon) were amplified from wild-type (WT) parasite gDNA by PCR and cloned in frame with a c-terminal V5-tag into a pL0017-derived plasmid. This vector integrates into the c- or the d-ssu-rRNA locus via single crossover recombination and conveys resistance to pyrimethamine. B) Diagnostic PCR of complemented parasite lines. Successful integration of the transfected plasmid into either of two possible loci in the P. berghei genome was tested by PCR. Locations of primers used for PCR analysis are shown. For each locus, one primer pair (1 and 4, 2 and 4, respectively) yields a PCR product of 3 kb if no integration has taken place. In case of successful integration, the primers are too far apart (>14 kb) to result in a complete PCR product under the chosen conditions. To further confirm integration, additional primer pairs (1 and 3, 2 and 3) were used, which only generate a PCR product of 3 kb if the plasmid has integrated. C) Complemented parasites express PbPL-V5 under the endogenous promoter. HepG2 cells were infected with complemented PbPL-KO sporozoites (CMP2) constitutively expressing cytosolic mCherry (red), fixed at 54 hpi and analyzed by IFA using an antiserum against PbPL (green, upper panel) or a monoclonal antibody against the V5-tag (green, lower panel) in combination with an antiserum against the PVM marker protein ExpI (purple). The merged channels additionally contain DAPI-stained nuclei (blue). Scale bars = 10 μm. IFAs are representative for the CMP1 and CMP3 parasite lines, which showed similar PbPL- and V5-stainings. All primer sequences are listed in S1 Table.
Fig 4
Fig 4. PbPL-knockout parasites take longer to appear in the blood after sporozoite infection.
C57BL/6 mice were injected intravenously with 1,000 wild-type (WT), PbPL-knockout (KO2) or complemented PbPL-KO (CMP2) sporozoites and subsequent blood stage parasitemia was measured by FACS analysis. A) Blood stage parasitemia at day 4. B) Development of parasitemia between day 3 and 6 post-infection. Shown are means +/− SD of 6–7 infected mice per group. For statistical analysis of parasitemia at day 4, a one-way analysis of variance (ANOVA) followed by a Holm-Sidak multiple comparison test was performed (** p < 0.01, n.s. = not significant). See also S3 Fig.
Fig 5
Fig 5. PbPL does not affect liver stage growth but plays a role in detached cell formation
A) PbPL-knockout (KO2) sporozoites have a similar infectivity as wild-type (WT), and complemented PbPL-KO (CMP2) sporozoites. For determination of sporozoite infectivity, HepG2 cells were infected with 10,000 WT, KO2 or CMP2 sporozoites and the average number of infected host cells per well was quantified 48 hpi in triplicate. Numbers of infected host cells were not statistically different from each other (one-way ANOVA, p = 0.6892). B) PbPL-knockout parasites grow normally in size. HepG2 cells were infected with WT, KO2 and complemented PbPL-KO (CMP1–3) sporozoites. 48 hpi, parasite size (area) was determined by density slicing using ImageJ. For each parasite line, the average size of 50–100 parasites was determined in each of three separate experiments. Parasites did not show a significant difference in size (one-way ANOVA, p = 0.6567). C) PbPL-KO parasites produce fewer detached cells (DCs). DCs in the supernatant were counted at 65 hpi in triplicate and were normalized to the number of infected cells at 48 hpi. D) Detached cells from PbPL-KO parasites show an abnormal morphology. DCs were harvested at 65 hpi and the percentage of cells with an abnormal morphology was determined. DCs with abnormal morphology were defined by merozoites still being clustered in the PV in contrast to merozoites freely distributed in the host cell in DCs with normal morphology. A representative image of DCs with normal and abnormal morphology is shown. Scale bars = 10 μm. For all experiments means +/− SD of three to four independent experiments are shown. For statistical analysis a one-way ANOVA followed by a Holm-Sidak multiple comparison test was performed (** p < 0.01, *** p < 0.001, n.s. = not significant). See also S4 Fig.
Fig 6
Fig 6. PbPL is involved in merozoite release.
HepG2 cells were infected with wild-type (WT), PbPL-knockout (KO2) and complemented PbPL-KO (CMP2) sporozoites. The percentage of attached hepatocytes containing schizont (S), cytomere (C) and merozoite (M) stage parasites was determined at 54 and 65 hpi. Schizont stages are either negative for the merozoite surface protein MSP1 or display an MSP1 staining only at the parasite plasma membrane without invaginations. Cytomere stages are defined by their MSP1-positive parasite plasma membrane with clear invaginations, while in merozoite-containing hepatocytes, individual merozoites are surrounded by MSP1 staining. Representative MSP1 staining of each parasite stage is shown at the top. For each time point, 50–100 parasites were analyzed. Scale bars = 10 μm. Shown are means +/− SD of three independent experiments. For statistical analysis a one-way ANOVA followed by a Holm-Sidak multiple comparison test was performed (** p < 0.01, *** p < 0.001).
Fig 7
Fig 7. PbPL mediates disruption of the PVM.
HepG2 cells expressing GFP (green) were infected with mCherry-expressing wild-type (WT), PbPL-knockout (KO2) and complemented PbPL-KO (CMP2) sporozoites (red). The percentage of merozoite-forming parasites that ruptured the PVM and the time difference between successful formation of merozoites and PVM rupture was measured by quantitative live-cell imaging. The influx of GFP into the PV was used as a measure of PVM rupture. Imaging was started around 55 hpi and lasted for 12 hours. Representative images for WT (A) and PbPL-KO (B) parasites are shown. The upper images show the time point of successful merozoite formation, at which individual merozoites were visible and all larger yet undivided parts of the parasite cytoplasm, typical of the cytomere stage, had disappeared. The lower images show the time point of PVM rupture (GFP influx) in a host cell infected with a WT parasite and the end point of imaging of a host cell infected with a PbPL-KO parasite, in which the PVM did not rupture (the course of events are better visible in the corresponding S1–S3 Movies). Scale bars = 10 μm. C) Time between formation of merozoites and PVM rupture. Each line represents the time difference between successful merozoite formation (beginning of line) and PVM rupture (end of line), as illustrated in A and B, and corresponds to one analyzed parasite. Continuous lines indicate parasites that did not rupture the PVM at all, which were not considered for determination of the average PVM rupture time in E. D) Percentage of merozoite-forming parasites that ruptured the PVM. The percentage of PVM rupture was determined in 3 (KO2, CMP2) or 6 (WT) imaging sessions, in which the number of parasites that successfully developed to merozoites within the first 6 hours of imaging was set to 100% in each experiment. Based on these, the percentage of parasites that successfully ruptured the PVM was calculated. E) Elapsed time from merozoite formation to PVM rupture. In D and E, means +/− SD are shown. Data were acquired in and are representative of 3 (KO2, CMP2) or 6 (WT) imaging experiments, in which a total of 61 WT, 43 KO2 and 37 CMP2 parasites were analyzed. For statistical analysis a one-way ANOVA followed by a Holm-Sidak multiple comparison test was performed (**** p < 0.0001, n.s. = not significant). See also S1–S3 Movies.

Similar articles

Cited by

References

    1. Hybiske K, Stephens RS (2008) Exit strategies of intracellular pathogens. Nat Rev Microbiol 6: 99–110. 10.1038/nrmicro1821 - DOI - PubMed
    1. Friedrich N, Hagedorn M, Soldati-Favre D, Soldati T (2012) Prison break: pathogens' strategies to egress from host cells. Microbiol Mol Biol Rev 76: 707–720. 10.1128/MMBR.00024-12 - DOI - PMC - PubMed
    1. Ward GE, Miller LH, Dvorak JA (1993) The origin of parasitophorous vacuole membrane lipids in malaria-infected erythrocytes. J Cell Sci 106 (Pt 1): 237–248. - PubMed
    1. Spielmann T, Montagna GN, Hecht L, Matuschewski K (2012) Molecular make-up of the Plasmodium parasitophorous vacuolar membrane. Int J Med Microbiol 302: 179–186. 10.1016/j.ijmm.2012.07.011 - DOI - PubMed
    1. Sturm A, Amino R, van de Sand C, Regen T, Retzlaff S, et al. (2006) Manipulation of host hepatocytes by the malaria parasite for delivery into liver sinusoids. Science 313: 1287–1290. - PubMed

Publication types