

Analysis of sphingosine kinase activity in single natural killer cells from peripheral blood
- PMID: 25786072
- PMCID: PMC4566154
- DOI: 10.1039/c5ib00007f
Analysis of sphingosine kinase activity in single natural killer cells from peripheral blood
Abstract
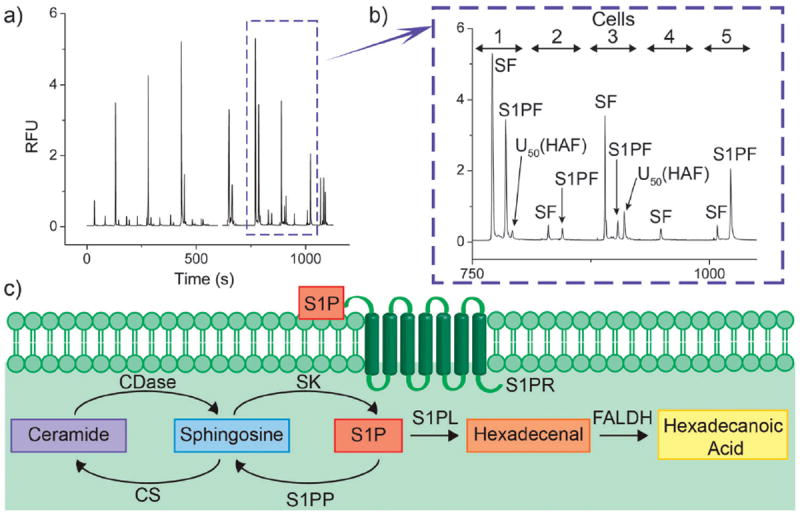
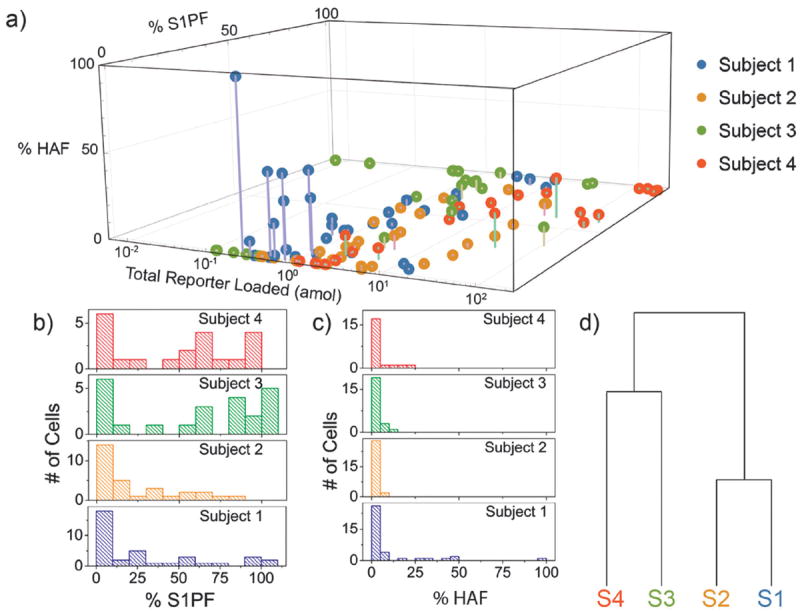
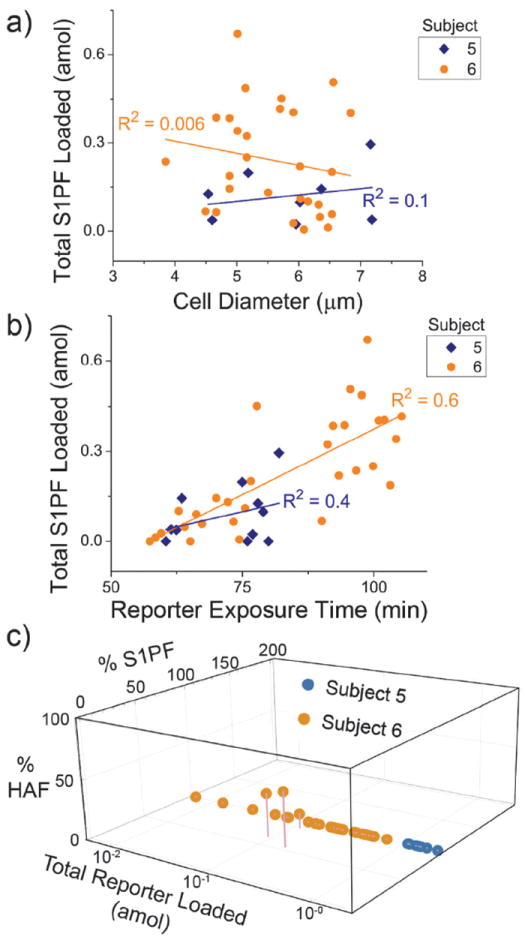
Sphingosine-1-phosphate (S1P), a lipid second messenger formed upon phosphorylation of sphingosine by sphingosine kinase (SK), plays a crucial role in natural killer (NK) cell proliferation, migration, and cytotoxicity. Dysregulation of the S1P pathway has been linked to a number of immune system disorders and therapeutic manipulation of the pathway has been proposed as a method of disease intervention. However, peripheral blood NK cells, as identified by surface markers (CD56(+)CD45(+)CD3(-)CD16) consist of a highly diverse population with distinct phenotypes and functions and it is unknown whether the S1P pathway is similarly diverse across peripheral blood NK cells. In this work, we measured the phosphorylation of sphingosine-fluorescein (SF) and subsequent metabolism of S1P fluorescein (S1PF) to form hexadecanoic acid fluorescein (HAF) in 111 single NK cells obtained from the peripheral blood of four healthy human subjects. The percentage of SF converted to S1PF or HAF was highly variable amongst the cells ranging from 0% to 100% (S1PF) and 0% to 97% (HAF). Subpopulations of cells with varying levels of S1PF formation and metabolism were readily identified. Across all subjects, the average percentage of SF converted to S1PF or HAF was 37 ± 36% and 12 ± 19%, respectively. NK cell metabolism of SF by the different subjects was also distinct with hierarchical clustering suggesting two possible phenotypes: low (<20%) or high (>50%) producers of S1PF. The heterogeneity of SK and downstream enzyme activity in NK cells may enable NK cells to respond effectively to a diverse array of pathogens as well as incipient tumor cells. NK cells from two subjects were also loaded with S1PF to assess the activity of S1P phosphatase (S1PP), which converts S1P to sphingosine. No NK cells (n = 41) formed sphingosine, suggesting that S1PP was minimally active in peripheral blood NK cells. In contrast to the SK activity, S1PP activity was homogeneous across the peripheral blood NK cells, suggesting a bias in the SK pathway towards proliferation and migration, activities supported by S1P.
Figures
Similar articles
-
Sphingosine signalling regulates decidual NK cell angiogenic phenotype and trophoblast migration.Hum Reprod. 2013 Nov;28(11):3026-37. doi: 10.1093/humrep/det339. Epub 2013 Sep 3. Hum Reprod. 2013. PMID: 24001716
-
Sphingosine kinase as an oncogene: autocrine sphingosine 1-phosphate modulates ML-1 thyroid carcinoma cell migration by a mechanism dependent on protein kinase C-alpha and ERK1/2.Endocrinology. 2009 May;150(5):2055-63. doi: 10.1210/en.2008-0625. Epub 2008 Dec 30. Endocrinology. 2009. PMID: 19116345
-
Extracellular export of sphingosine kinase-1 enzyme. Sphingosine 1-phosphate generation and the induction of angiogenic vascular maturation.J Biol Chem. 2002 Feb 22;277(8):6667-75. doi: 10.1074/jbc.M102841200. Epub 2001 Dec 10. J Biol Chem. 2002. PMID: 11741921
-
Sphingosine kinase, sphingosine-1-phosphate, and apoptosis.Biochim Biophys Acta. 2002 Dec 30;1585(2-3):193-201. doi: 10.1016/s1388-1981(02)00341-4. Biochim Biophys Acta. 2002. PMID: 12531554 Review.
-
Role of sphingosine kinases and lipid phosphate phosphatases in regulating spatial sphingosine 1-phosphate signalling in health and disease.Cell Signal. 2009 Jan;21(1):14-21. doi: 10.1016/j.cellsig.2008.08.008. Epub 2008 Aug 15. Cell Signal. 2009. PMID: 18768158 Review.
Cited by
-
Monolithic Silica Microbands Enable Thin-Layer Chromatography Analysis of Single Cells.Anal Chem. 2022 Oct 4;94(39):13489-13497. doi: 10.1021/acs.analchem.2c02622. Epub 2022 Sep 19. Anal Chem. 2022. PMID: 36121711 Free PMC article.
-
Chemical fixation to arrest phospholipid signaling for chemical cytometry.J Chromatogr A. 2017 Nov 10;1523:97-106. doi: 10.1016/j.chroma.2017.05.022. Epub 2017 May 10. J Chromatogr A. 2017. PMID: 28528682 Free PMC article.
-
Large 22q13.3 deletions perturb peripheral transcriptomic and metabolomic profiles in Phelan-McDermid syndrome.HGG Adv. 2022 Sep 26;4(1):100145. doi: 10.1016/j.xhgg.2022.100145. eCollection 2023 Jan 12. HGG Adv. 2022. PMID: 36276299 Free PMC article.
-
Analytical Techniques for Single-Cell Biochemical Assays of Lipids.Annu Rev Biomed Eng. 2023 Jun 8;25:281-309. doi: 10.1146/annurev-bioeng-110220-034007. Epub 2023 Apr 17. Annu Rev Biomed Eng. 2023. PMID: 37068764 Free PMC article. Review.
-
A multi-organ-on-chip to recapitulate the infiltration and the cytotoxic activity of circulating NK cells in 3D matrix-based tumor model.Front Bioeng Biotechnol. 2022 Jul 25;10:945149. doi: 10.3389/fbioe.2022.945149. eCollection 2022. Front Bioeng Biotechnol. 2022. PMID: 35957642 Free PMC article.
References
Publication types
MeSH terms
Substances
Grants and funding
LinkOut - more resources
Full Text Sources
Other Literature Sources
Research Materials
Miscellaneous
