. 2015 Mar 18;10(3):e0118977.
doi: 10.1371/journal.pone.0118977. eCollection 2015.

A mechanistic tumor penetration model to guide antibody drug conjugate design

Affiliations

A mechanistic tumor penetration model to guide antibody drug conjugate design

Christina Vasalou et al. PLoS One. .

Abstract

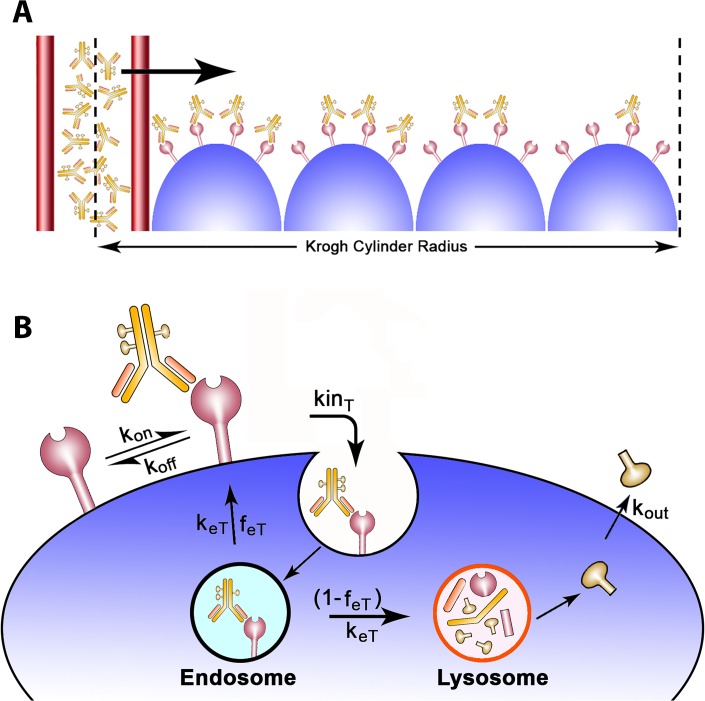
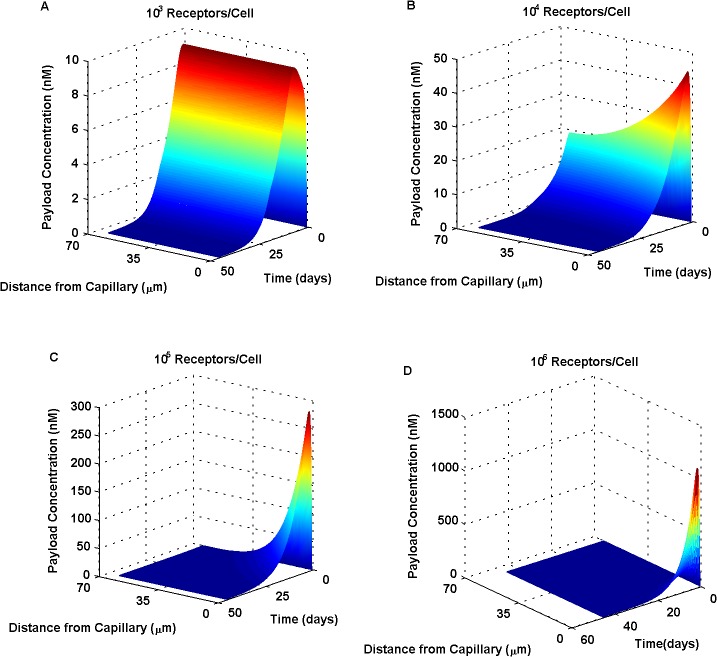
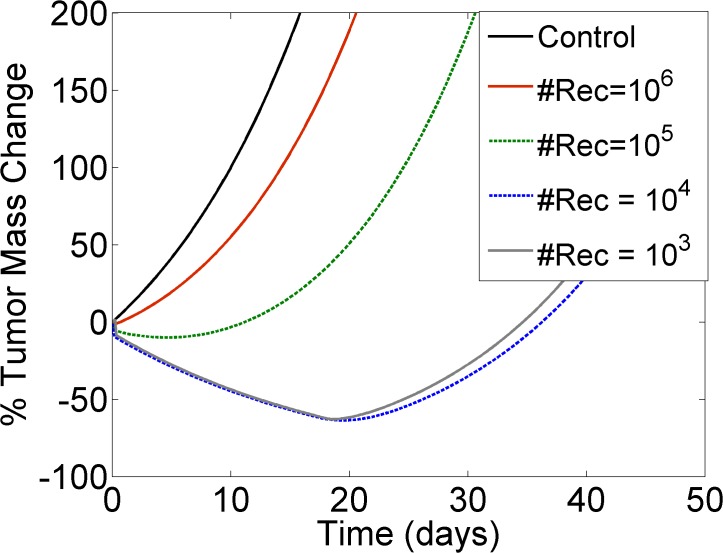
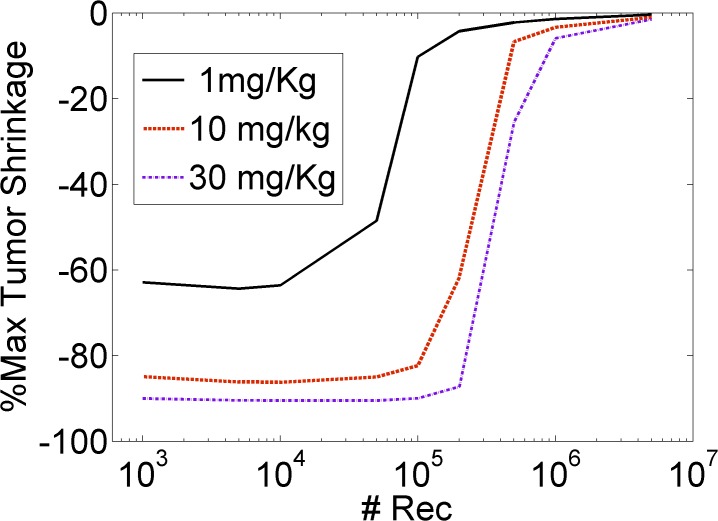
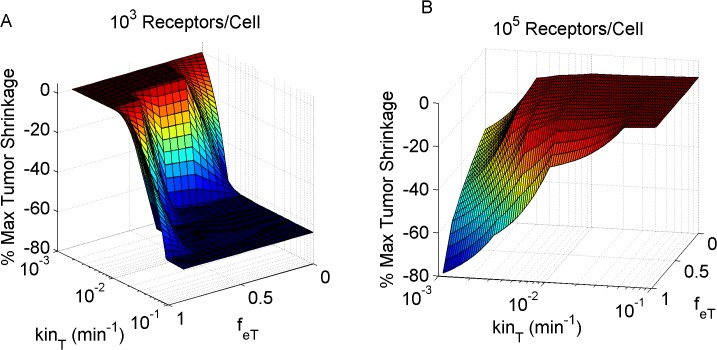
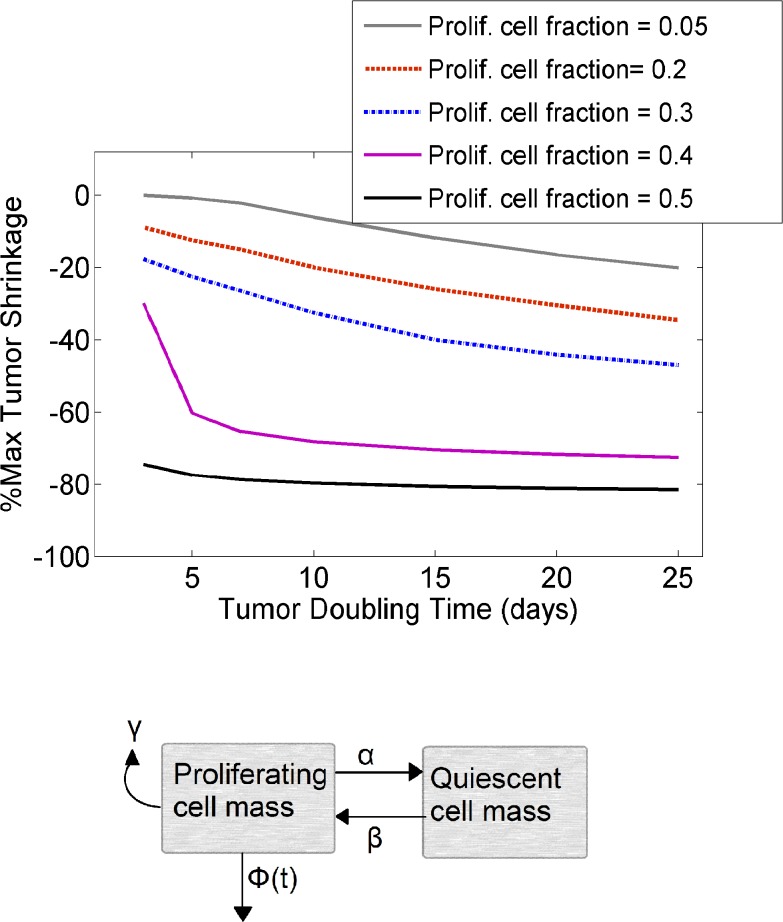
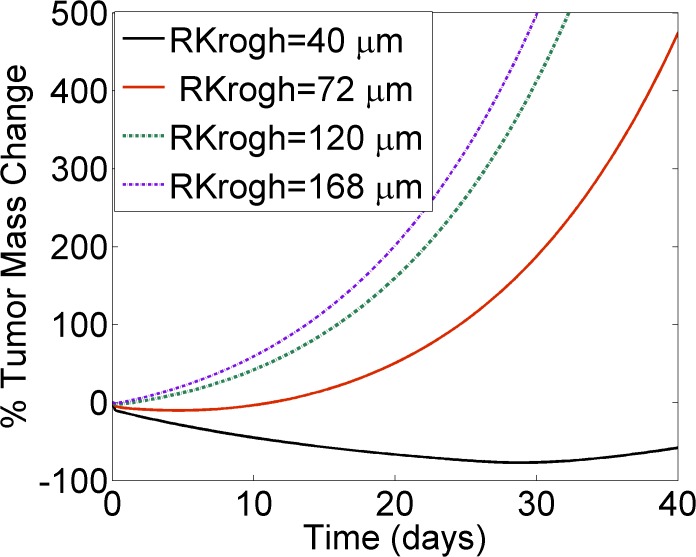
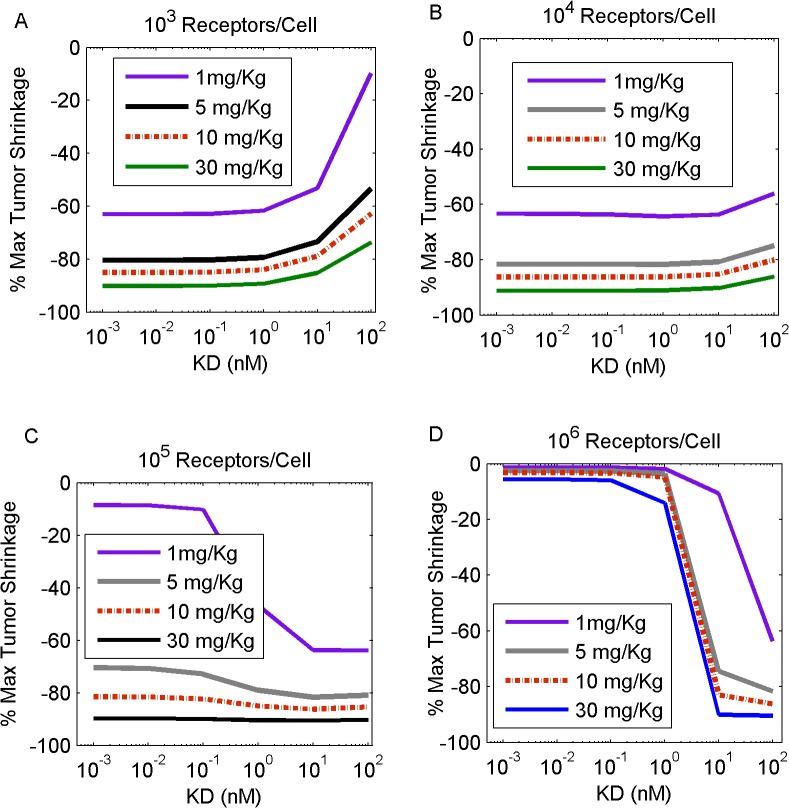
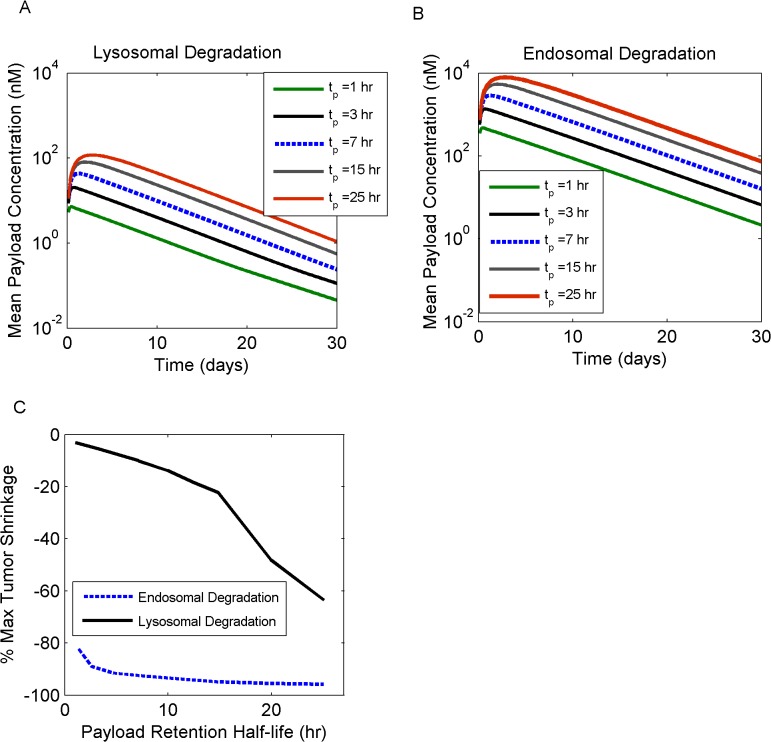
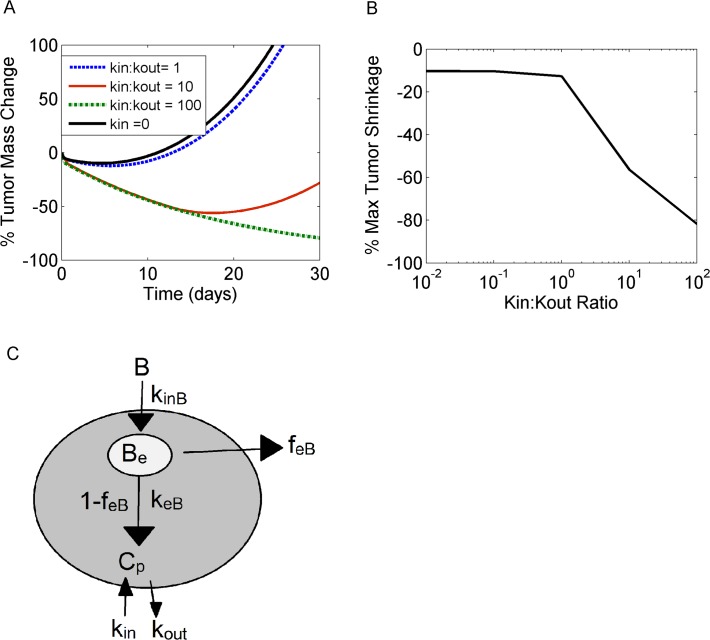
Antibody drug conjugates (ADCs) represent novel anti-cancer modalities engineered to specifically target and kill tumor cells expressing corresponding antigens. Due to their large size and their complex kinetics, these therapeutic agents often face heterogeneous distributions in tumors, leading to large untargeted regions that escape therapy. We present a modeling framework which includes the systemic distribution, vascular permeability, interstitial transport, as well as binding and payload release kinetics of ADC-therapeutic agents in mouse xenografts. We focused, in particular, on receptor dynamics such as endocytic trafficking mechanisms within cancer cells, to simulate their impact on tumor mass shrinkage upon ADC administration. Our model identified undesirable tumor properties that can impair ADC tissue homogeneity, further compromising ADC success, and explored ADC design optimization scenarios to counteract upon such unfavorable intrinsic tumor tissue attributes. We further demonstrated the profound impact of cytotoxic payload release mechanisms and the role of bystander killing effects on tumor shrinkage. This model platform affords a customizable simulation environment which can aid with experimental data interpretation and the design of ADC therapeutic treatments.


Conflict of interest statement

Competing Interests: At the time of these analyses, all authors were Novartis employees. This does not alter the authors' adherence to PLOS ONE policies on sharing data and materials.

Figures

Fig 1
Fig 1. ADC tumor penetration schematic.
A) A cross section of the Krogh cylinder illustrates the passage of ADCs through the capillary wall into the tumor tissue. The Krogh cylinder radius is equal to half the mean intercapillary distance, which is a tumor specific value. B) ADCs reversibly bind to antigen receptors located on the surface of tumor cells. Upon its formation, the ADC/receptor complex internalizes at a kinT rate and is further sorted in the endosomes. The complex exits the endosomes with a keT rate and is either recycled back to the surface with a feT fraction or degraded in the lysosomes. The model assumes payload release in the lysosomes in its nominal case; upon its release, the payload can diffuse out of the cytosol with a kout rate. The model assumes no payload reentry (no bystander killing effects) unless otherwise noted.
Fig 2
Fig 2. Increasing target receptor density has a profound effect on payload distribution across the tumor tissue.
Receptors numbers per cell were varied from 103 (A) to 104 (B), 105 (C) and 106 (D). Low antigen (receptor) levels (A,B) resulted in more homogeneous payload distributions, as compared to high antigen levels (C,D) which produced pronounced, steep radial gradients. Increased receptor expression resulted in the rapid binding of ADC near its site of entry, an observation often termed as the “binding site barrier”.
Fig 3
Fig 3. Tumor response to ADC therapy is driven by antigen expression levels.
The Y-axis illustrates the % change in tumor mass from its initial value at time zero: negative values indicate a decrease and positive values indicate an increase in tumor mass from its baseline. Higher receptor numbers per cell (#Rec) diminish the ability of the tumor to shrink in response to ADC. Control (black solid line) was compared against increasing receptor densities: #Rec = 106(red solid line), #Rec = 105(green dashed line), #Rec = 104 (blue dashed line) and #Rec = 103(gray solid line). All simulations assumed a single intravenous administration of 1mg/Kg ADC, characterized by a binding affinity of KD = 0.1 nM.
Fig 4
Fig 4. The maximum extent of tumor shrinkage as a function of antigen receptor levels.
The Y-axis illustrates the maximal achievable tumor mass reduction; the more negative the values, the greater the tumor shrinkage, whereas a value of zero indicates that the tumor could not be shrunk. Lower receptor numbers (#Rec) produced improved tumor mass loss compared to higher receptor levels. Simulations assumed a single intravenous administration of either 1mg/Kg (black solid line), 10 mg/Kg (red dashed line) or 30 mg/Kg (purple dashed line) of ADC, characterized by a binding affinity of KD = 0.1 nM.
Fig 5
Fig 5. Tumor mass shrinkage as a function of target receptor kinetics.
Increasing the internalization rate (kin T) and reducing the receptor recycling fraction (f eT) had a positive effect on tumor mass reduction, in the instance of low antigen expression levels (simulations of 103 receptors per cell; A). The opposite effect is noted for tumors with high antigen expression (105 receptors per cell B).
Fig 6
Fig 6. Intrinsic tumor growth properties affect the maximum extent of tumor shrinkage.
A) Increasing tumor doubling time as well as the proliferating cell fraction enhanced tumor reduction in response to a single intravenous administration of 1mg/Kg ADC. The binding affinity was set equal to 0.1nM. Proliferating cell fractions simulated: 0.05 (gray solid line), 0.2 (red dashed line), 0.3 (blue dashed line), 0.4 (purple solid line) and 0.5 (black solid line). B) Simplified illustration of the tumor mass model, which included the dynamics of both proliferating as well as quiescent cell mass. Φ(t) indicates the proliferating mass reduction due to drug effect. More details can be found in the text.
Fig 7
Fig 7. Tumor vascularization affects tumor response to ADC therapy.
Increasing the Krogh cylinder radius (RKrogh) simulates tumors of decreased vascularization. RKrogh was increased from 40μm (black solid line), to 72 μm (red solid line), 120 μm (green dashed line), and up to 168 μm (purple dashed line). The graph demonstrates that highly vascularized tumors can reduce more promptly in contrast to less vascularized tumors, when applying the same ADC therapy. Dosing regimen simulated: single intravenous administration of 1mg/Kg ADC, characterized by a binding affinity of KD = 0.1 nM.
Fig 8
Fig 8. Increasing KD produces a differential effect on tumor mass shrinkage, depending on antigen (receptor) level expression.
Simulations included tumors that contained 103 (A), 104 (B), 105 (C) and 106 (D) receptors per cell. Increasing doses of 1mg/Kg (purple line), 5 mg/Kg (gray line), 10 mg/Kg (red dashed line) and 30 mg/kg (black line) of a single ADC intravenous administration were simulated. Our results show that decreasing KD is beneficial when targeting tumors of low antigen expression. Contrarily, high antigen expressing tumors require increased KD values to reduce in mass.
Fig 9
Fig 9. ADC efficacy as a function of payload cleavage mechanisms and intracellular kinetics.
Lysosomal (A) versus endosomal (B) payload cleavage scenarios were simulated; the effect of payload retention half-life(t p) was also explored, by increasing it from 1 hr (green line), to 3 hrs (gray solid line), 7 hrs (blue dashed line), 15 hrs (gray solid line), and 25 hrs (red solid line). The maximum extent of tumor shrinkage (C) was improved for endosomal (blue dashed line) versus lysosomal (black line) payload cleavage and for longer retention half-lives.
Fig 10
Fig 10. Bystander killing effects become significant depending on payload kinetics.
Ratio of k in (transfer rate from interstitial tumor tissue into the cytosol) versus k out (transfer rate from the cytosol into the interstitial tumor tissue) was increased, and the effect on the % tumor mass change over time (A) and maximum tumor shrinkage (B) was reported. K in with a nominal value of zero (black solid line), was gradually increased for the purpose of these simulations, to achieve k in-to-k out ratios equal to 1 (blue dashed line), 10 (red solid line) and 100 (green dashed line). C) Simplified illustration of ADC kinetics and payload release. Payload accumulation within the cytosol depends on k in and k out transfer rates. For more information on intracellular kinetic equations, refer to text.

References

    1. Burris HA, Rugo HS, Vukelja SJ, Vogel CL, Borson RA, Limentani S, et al. Phase II Study of the Antibody Drug Conjugate Trastuzumab-DM1 for the Treatment of Human Epidermal Growth Factor Receptor 2 (HER2)-Positive Breast Cancer After Prior HER2-Directed Therapy. Journal of Clinical Oncology. 2011;29(4):398–405. 10.1200/JCO.2010.29.5865 - DOI - PubMed
    1. Krop I, LoRusso P, Miller KD, Modi S, Yardley D, Rodriguez G, et al. A Phase II Study of Trastuzumab-DM1 (T-DM1), a Novel HER2 Antibody-Drug Conjugate, in Patients Previously Treated with Lapatinib, Trastuzumab, and Chemotherapy. Cancer Research. 2009;69(24):795S–S.
    1. Younes A, Gopal AK, Smith SE, Ansell SM, Rosenblatt JD, Savage KJ, et al. Results from a pivotal phase II study of brentuximab vedotin (SGN-35) in patients with relapsed or refractory Hodgkin lymphoma (HL). ASCO Meeting Abstracts 2011. p. (15 suppl; abstr 8031).
    1. www.clinicaltrial.gov.
    1. Wadleigh M, Richardson PG, Zahrieh D, Lee SJ, Cutler C, Ho V, et al. Prior gemtuzumab ozogamicin exposure significantly increases the risk of veno-occlusive disease in patients who undergo myeloablative allogeneic stem cell transplantation. Blood. 2003;102(5):1578–82. - PubMed

Substances

LinkOut - more resources